IDixie
- 指标
- Evgeniy Scherbina
- 版本: 1.0
IDixie is an indicator which shows open and close values of the American dollar index, DXY or "Dixie". The indicator is calculated from weighted values of 6 major symbols: EURUSD, USDJPY, GBPUSD, USDCAD, USDSEK, and USDCHF.
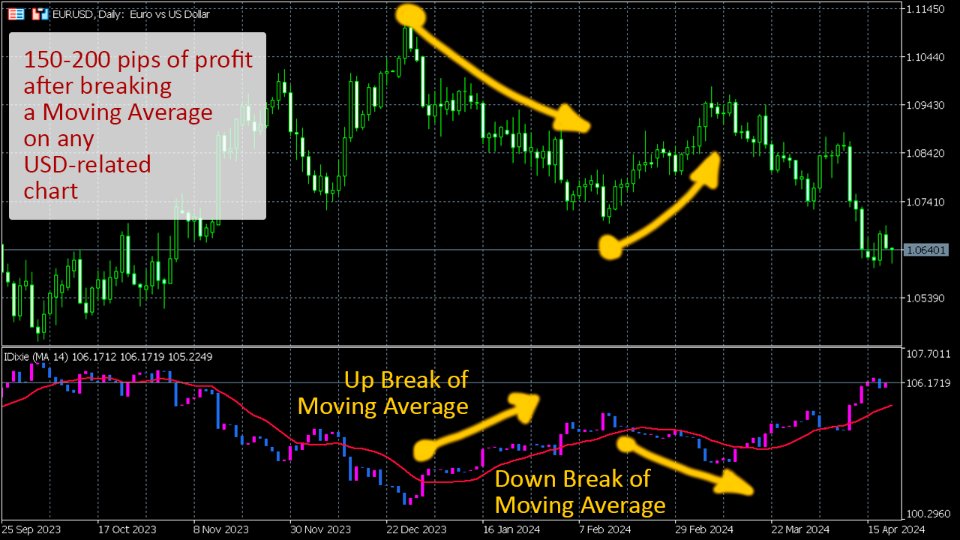
In addition to "Dixie" values, the indicator also shows a moving average. You can set the period of the moving average. When bars of the indicator break through the moving average, this creates good opportunities to enter the market. As a rule, signals from this indicator are more reliable than similar signals from a moving average on separate symbols.
You should be careful with the "Max bars" property. If you set a very big value, the indicator will be cyclically trying to load what cannot be loaded. For example, a value over 300 for a monthly chart can be too much. You can, of course, load many more bars for a daily chart or lower.
Trading Recommendations
- Recommended charts - at least 1-hour. Better - daily charts.
- After a bar, which breaks the moving average, has formed, you can enter the market. You should be careful with the breaking direction. It is opposite for symbols like EURUSD and GBPUSD. It is the same direction for symbols like USDJPY, USDCAD, USDSEK, or USDCHF.
- You can trail a trade with a 100 (1000) pips trail on a daily chart.
Indicator Properties
- Suffix >> it can be handy for those who have symbols with different suffixes in their terminal. Most users can leave this field empty.
- Max bars
- Moving average period
- Moving average color
- Line width of moving average
- Candle width
- Candle color for buy
- Candle color for sell
- Price line color

