Wave Mark And Quick Drawing
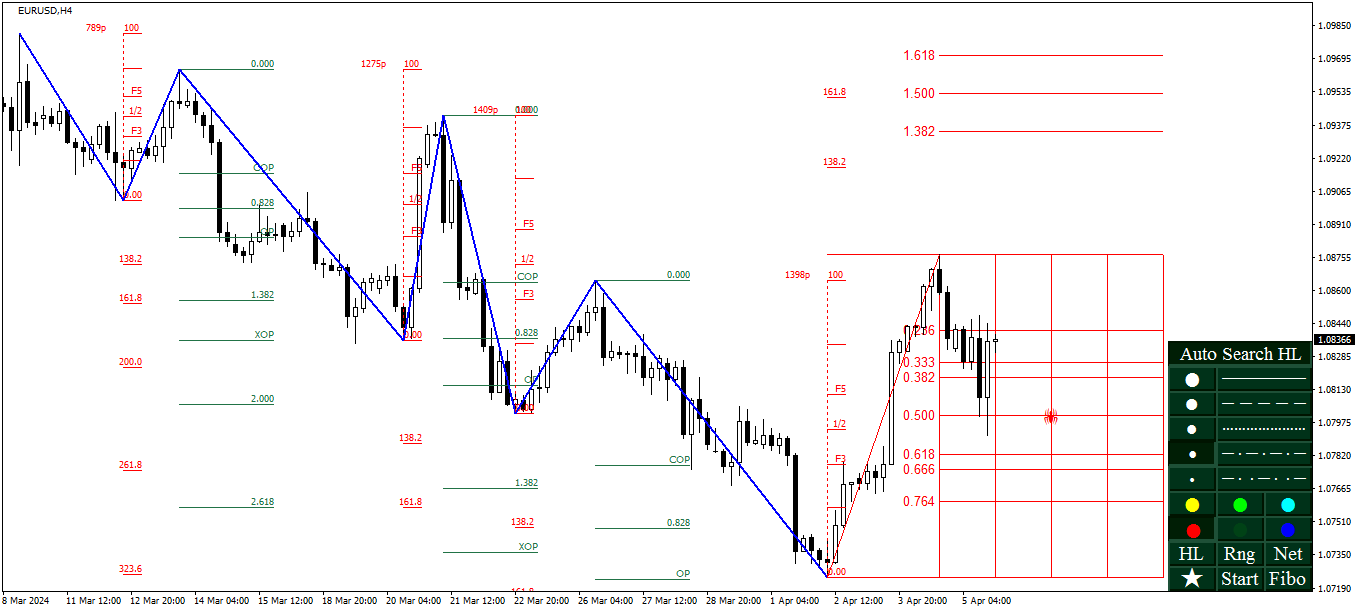
绘图部分
(1) 画线类型
- 折线
- Fibo
- 水平趋势线
- 区间线
- 时空网格
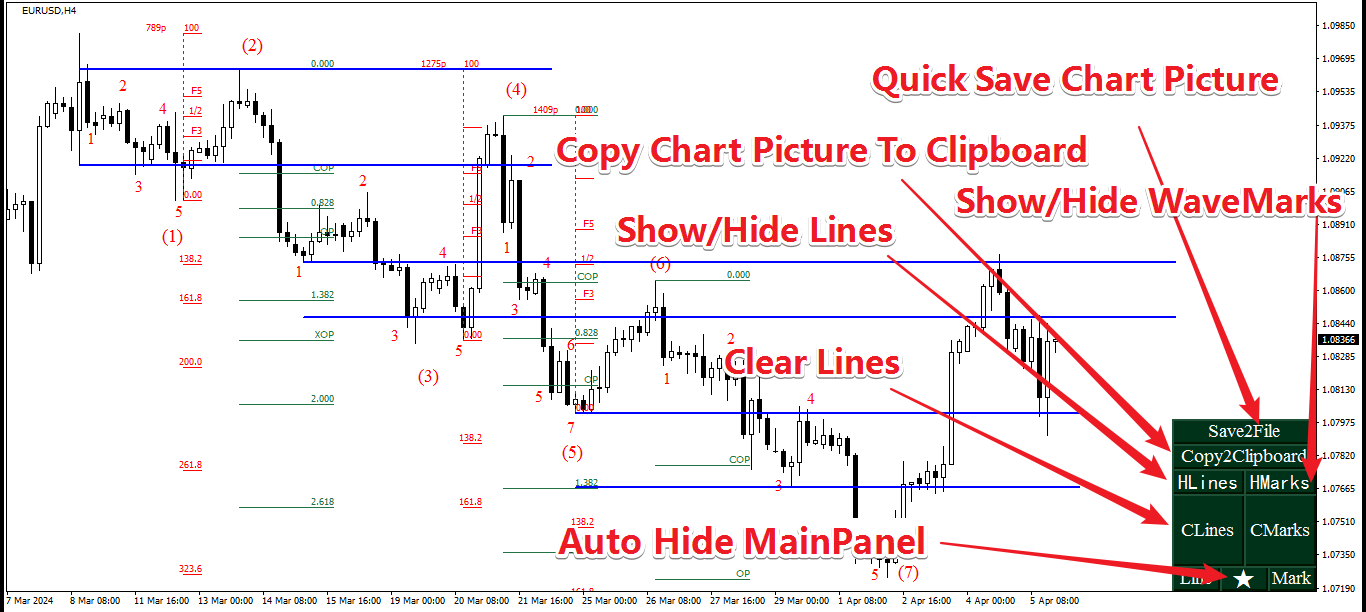
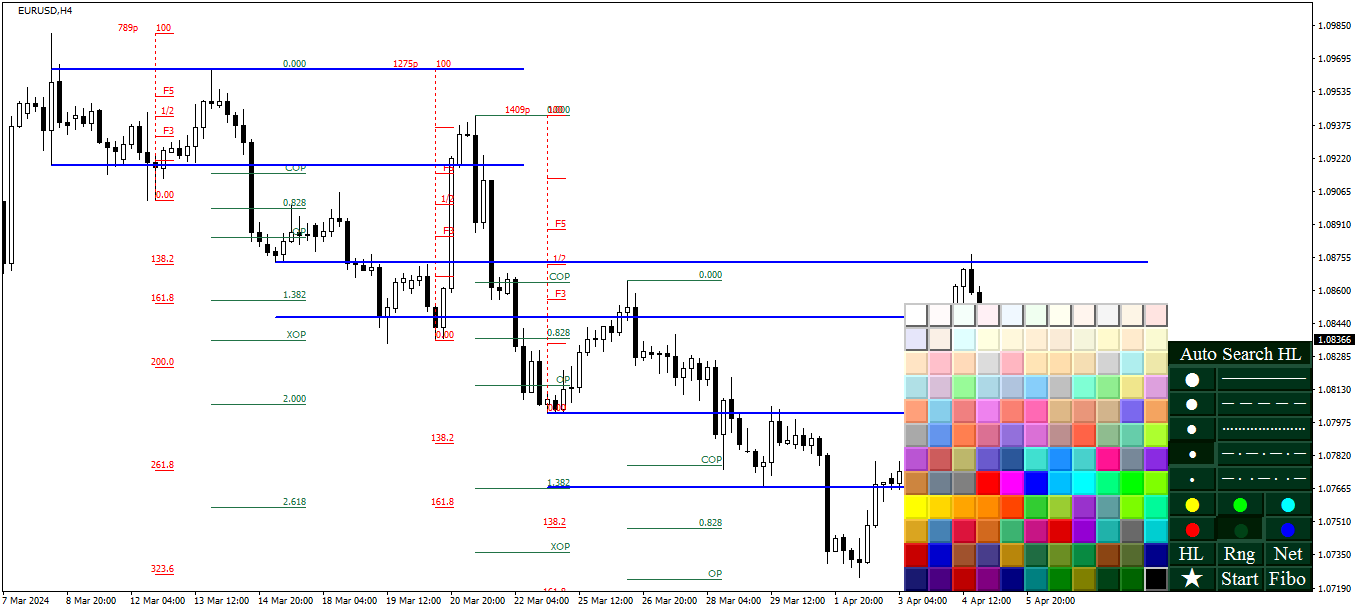
(2) 设置线条颜色、样式和宽度
- 要设置线的颜色内置或样式和宽度,只需点击某些按钮
- 当按下第二行中间一个颜色按钮时,调出颜色选择面板设置自定义颜色
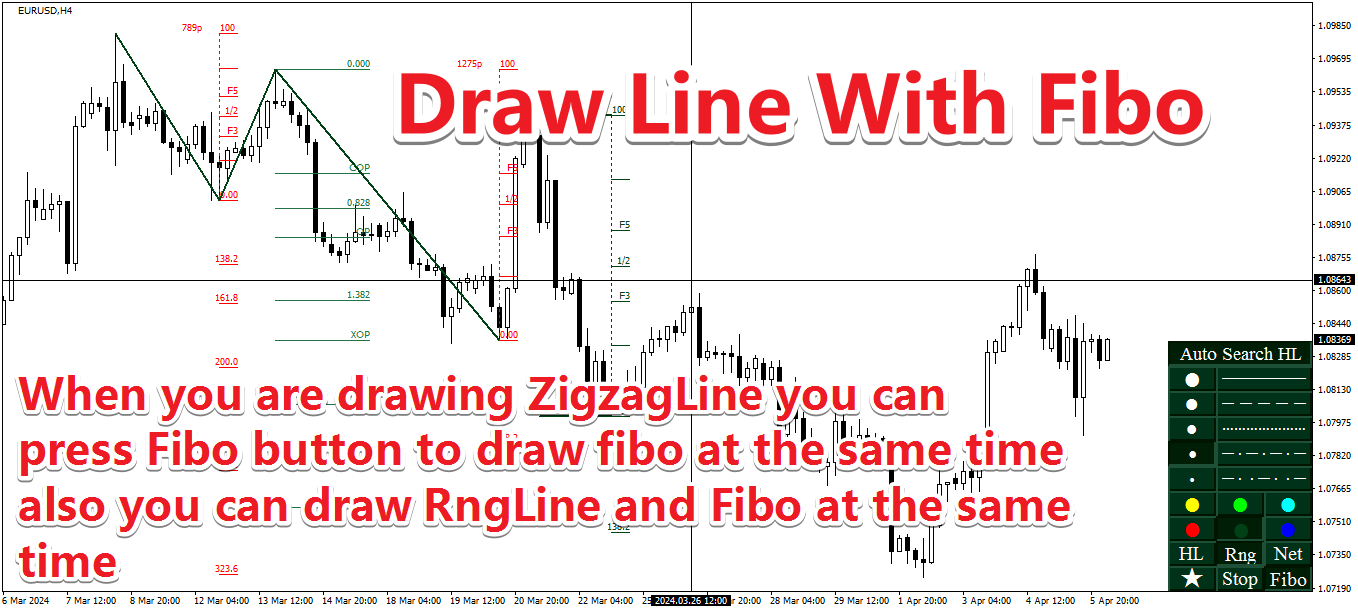
(3) 开始画线
- 如果你没有按下任何绘图类型按钮(HL/Rng/Net/Fibo),当你选择线条颜色按钮或线条样式按钮或线条宽度按钮时,它将默认绘制折线
- 当您正在绘制折线或区间线时,您可以按Fibo按钮,它将同时绘制 斐波那契回调和斐波那契扩展
- 如果您想绘制可以精确定位吸附在最高价和最低价的画线,您可以在绘制时按下Autosearchhl按钮
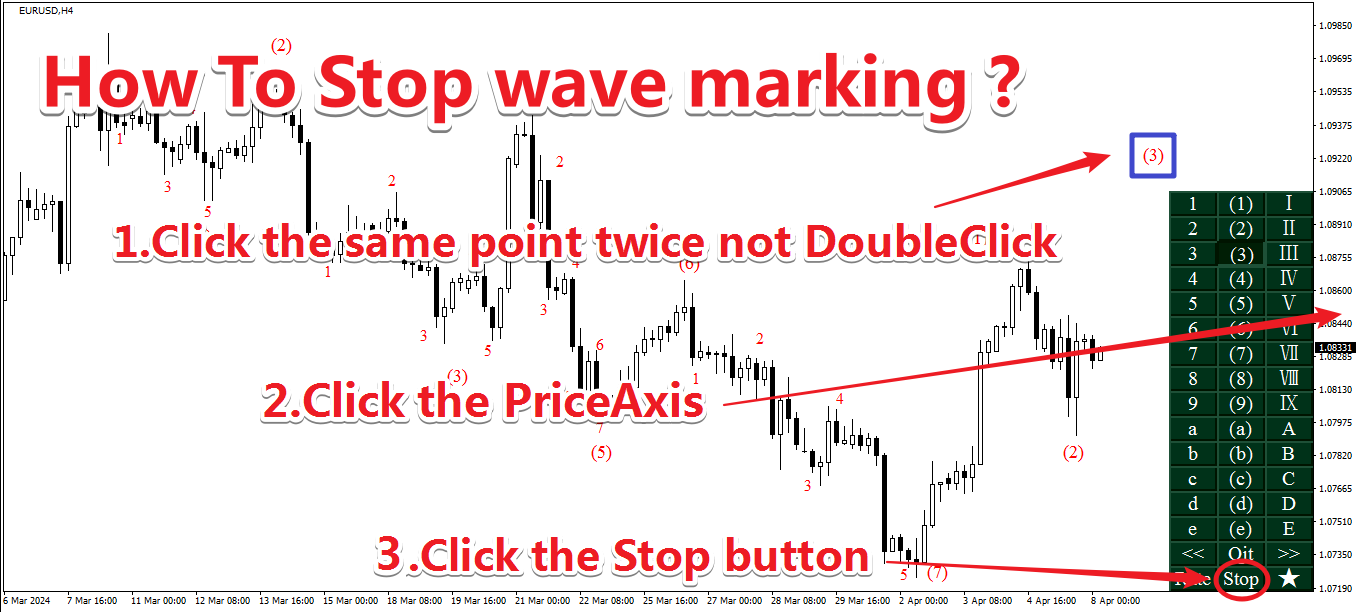
(4) 结束画线
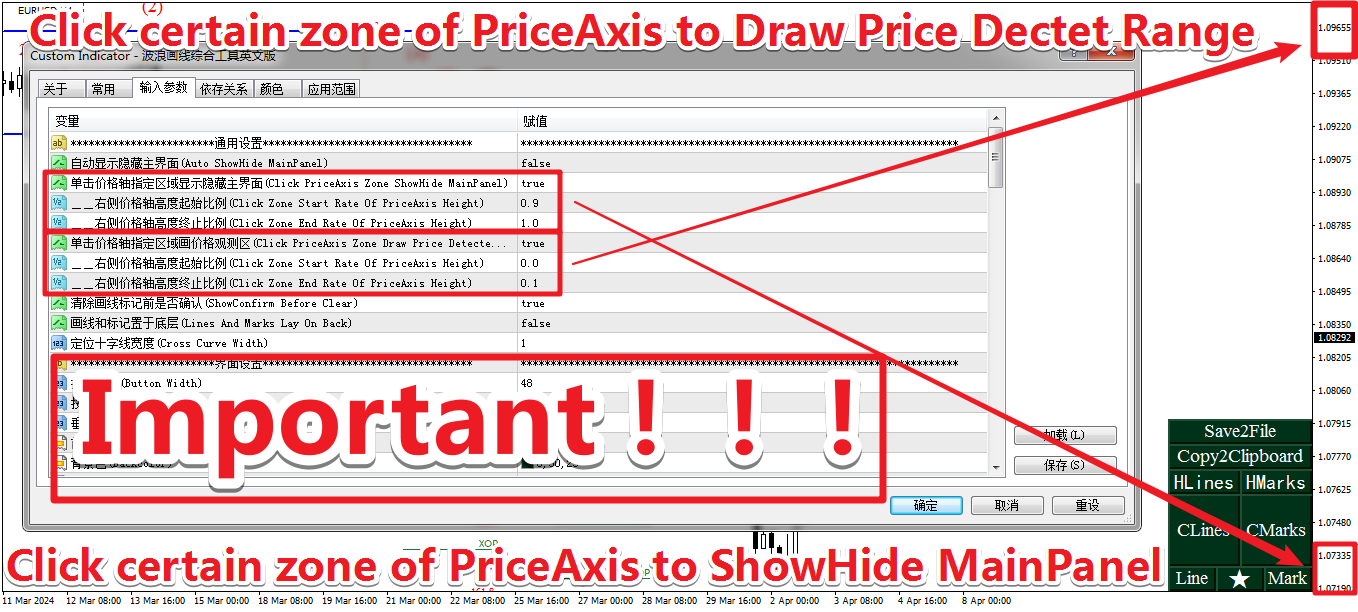
- 单击 同一区域(误差范围为20像素)两次,绘图停止
- 单击 价格轴停止
- 单击停止按钮停止
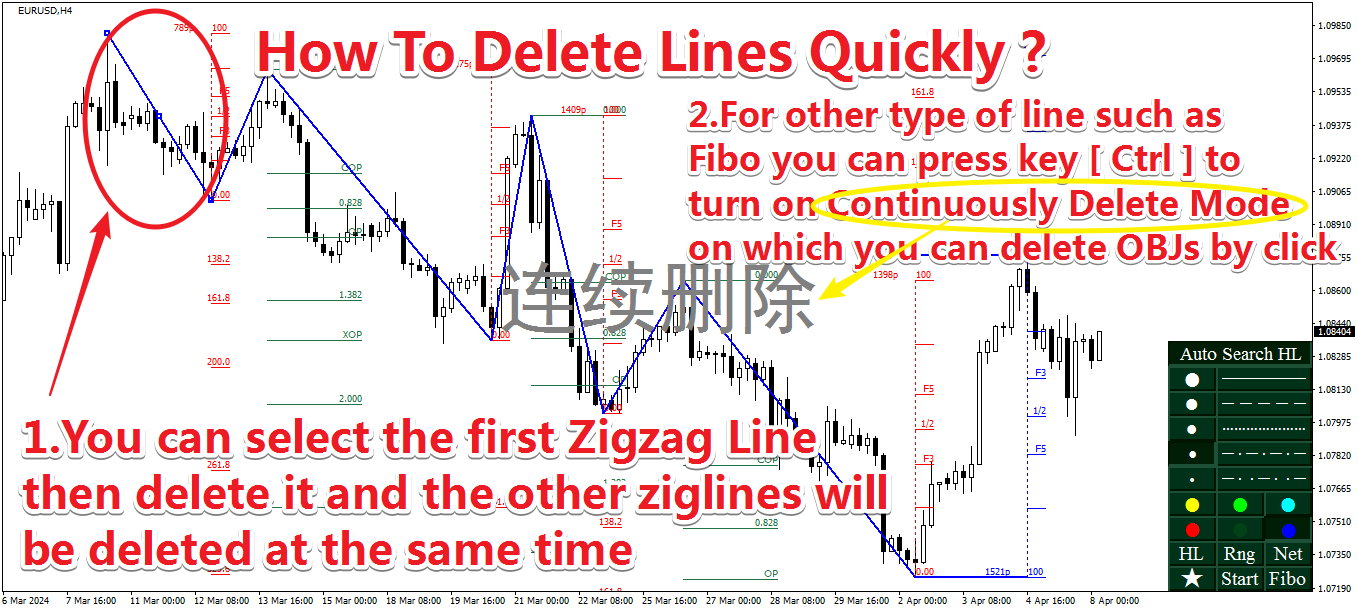
(5) 删除画线
- 选择折线的第一段,然后删除它可以将折线全部删除
- 按热键Ctrl打开连续删除模式,然后通过单击删除对象
- 单击“清除”按钮可清除所有绘图
- 点击“波浪标记”按钮清除所有波浪标记
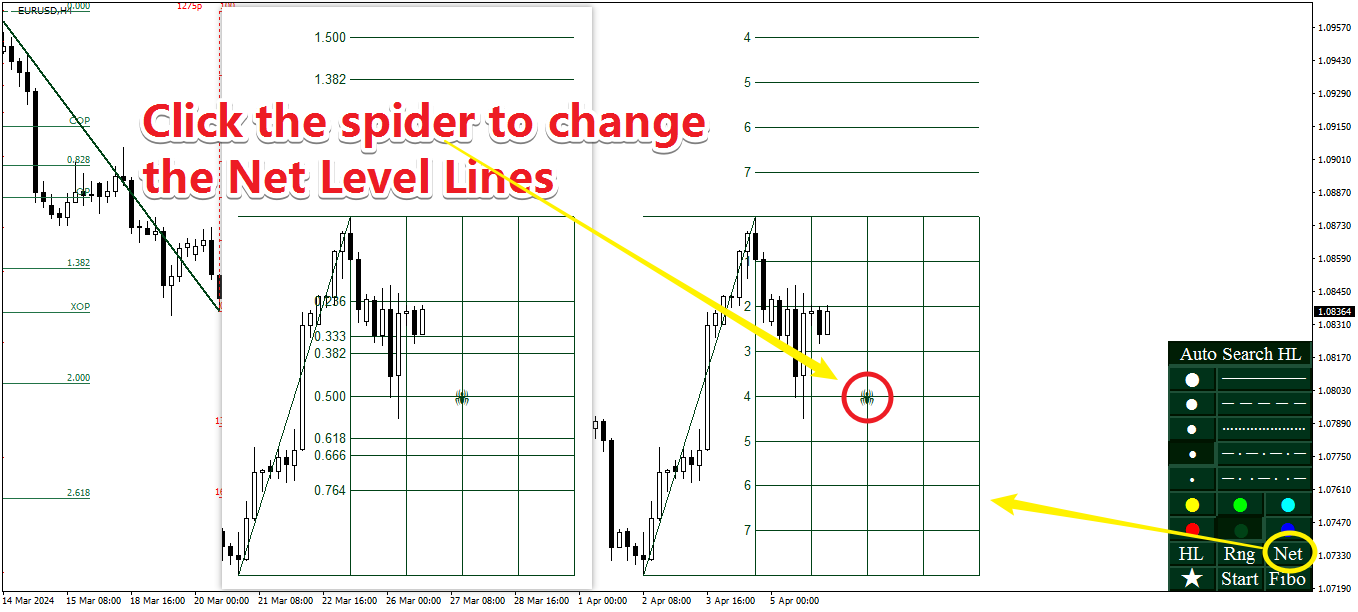
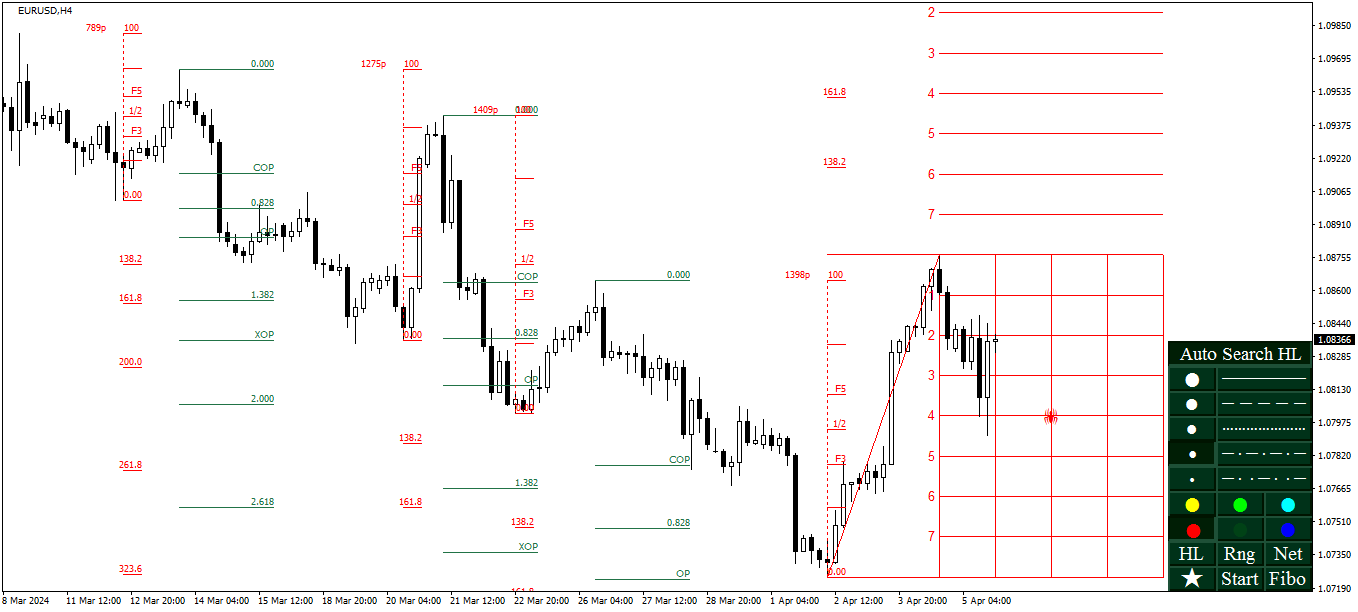
(6) 改变时空网格水平位比率
- 单击时空网格的中心蜘蛛图标以切换水平比率位
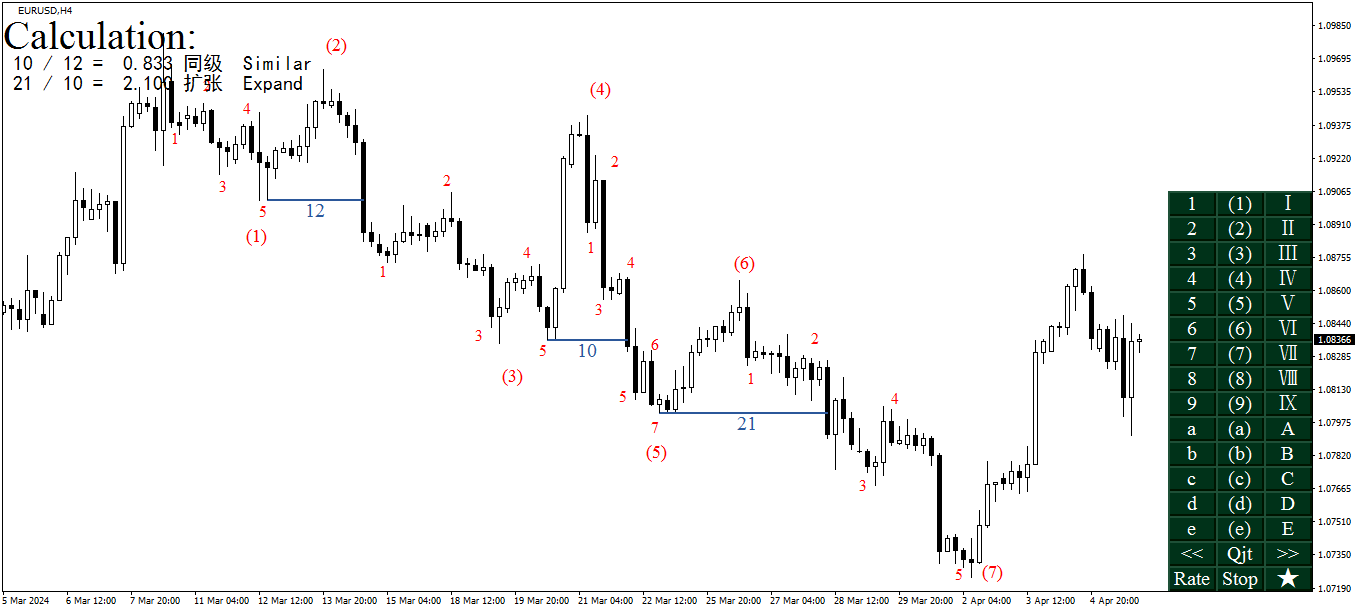
波浪标记部分
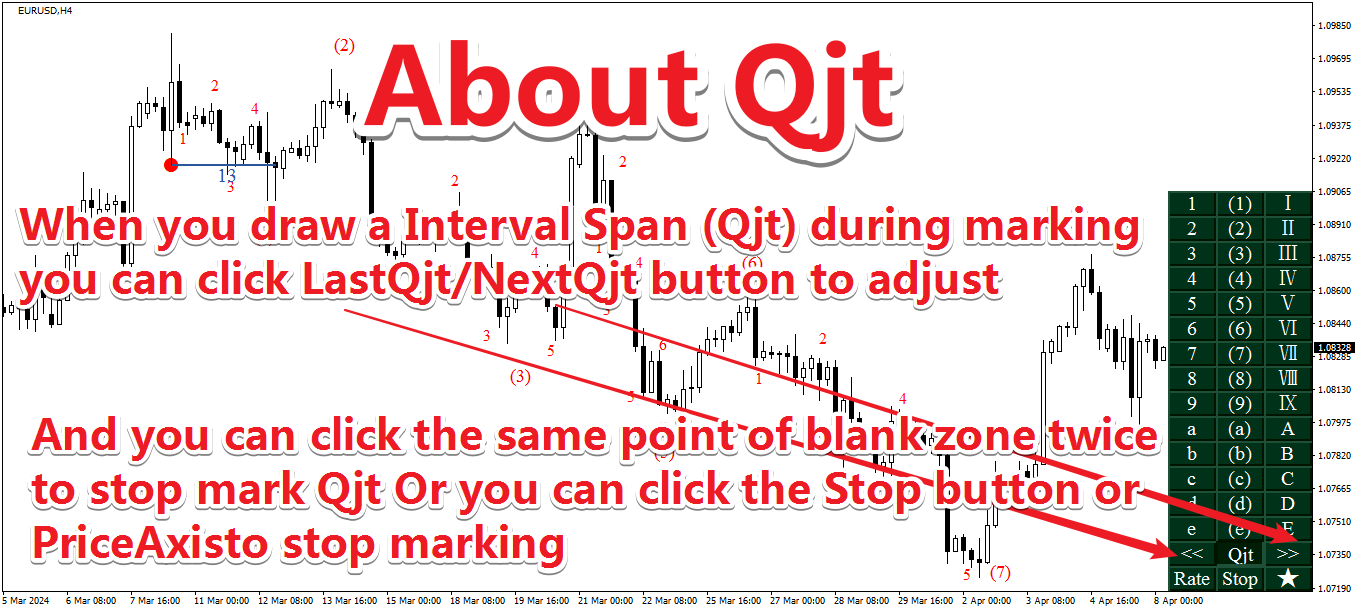
(1) 停波浪标记或Qjt标记
- 标记停止时,点击两次同一区域(误差范围为20像素)(停止标记Qjt时,该区域应位于空白区域)
- 点击价格轴停止
- 单击停止按钮停止
(2) Qjt标记
- 按下Qjt按钮
- 点击BMS(市场结构突破)之前的价格高点或低点
- 当有多级别突破同时存在时,点击<</>>按钮调整Qjt
(3) 计算Qjts序列的比率
- 点击Rate按钮
- 选择需要计算的Qjts