很遗憾,"Telecontrol"不可用
您可以检查MIKHAIL VINOGRADOV的其他产品:

Telegram 控制(Telecontrol) — 连接 Telegram 机器人和 MetaTrader 5 终端,提供高级的 Telegram 交易信号 和 MT5 到 Telegram 的集成。 它帮助汇总来自多个终端的数据,并通过 Telegram 机器人进行管理。该服务适合管理多个 MT5 终端,每个终端都可以单独配置,以便最佳显示和感知信息。所有终端数据都汇集在一个 Telegram 频道中,从而启用 MetaTrader Telegram 警报 和 Telegram 通知 。设置面板允许您快速更改并保存界面和操作的设置,包括 MT5 到 Telegram 和 MT5 Telegram 集成 。 Telecontrol 的主要功能: 交易信息: 以方便的格式发送有关交易开始和完成的数据。非常适合 自动信号 和 Telegram 交易复制器 。 订单信息: 以方便的格式发送订单启动数据,包括 交易信号到 Telegram 。 汇总结果信息: 显示选定时间段(5、10、15、30、60 分钟)内交易的总结果,包括利润、交易数量和回撤。适用于
FREE

Level Assistant is an expert assistant for manually setting support and resistance levels.
Traders often form their own levels. If there are many charts of different periods, the level will be multiplied by all charts.
When placing a horizontal line on a chart, the Assistant suggests converting this line into a level. At the same time, he himself will determine the color and thickness of the line, depending on the period of the instrument and where it is relative to the price. Mark the leve
FREE

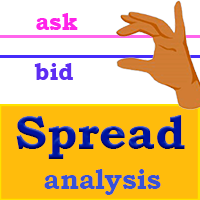
交易中的点差是市场上金融工具的购买价格和销售价格之间的差额。 点差是交易者为交易机会向经纪人支付的佣金。
每个经纪人都提供自己的交易条款,这已经不是什么秘密了。 价差的大小很重要。 有很多顾问(特别是黄牛)在不同的经纪人表现出不同的结果。 我们一再遇到这种情况。 因此,使用此实用程序,找出您的经纪人在特定工具期间提供的价差。
运行该实用程序几天。 检查日志中的屏幕上的消息,以及在数据文件(。.\MQL5\Files)。
实用程序输入参数:
type_account -账户类型的名称,所有经纪商可能有不同的缩写(ECN,PRO,VIP,RAW等。) actual_spread -仅为活动期间选择数据(这是从2-22小时) save_file_result -将数据保存到文本文件
FREE

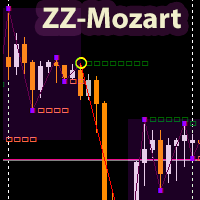
The ZigZagMozart indicator is based on the calculation of the advanced ZigZag. Displays trend break points (white squares), resulting points (yellow circles), flat zones (purple dots). The only indicator parameter: “ pivot in points ” - the minimum shoulder between the peaks of the indicator. The indicator uses market analysis based on the strategy of the famous modern trader Mozart. https://www.youtube.com/watch?v=GcXvUmvr0mY.
ZigZagMozart - works on any currency pairs. If the parameter “piv

The Regression indicator shows the direction of the trend. The graph shows up to 3 regression lines with different time periods. The straight line is built as the average inside the wave channel of the price movement (shown on one ScreenShot).
In this case, you can disable any of the lines. Also, the indicator allows you to change the color for each line. It is interesting to calculate the relative angle in degrees. The angle display can also be turned off.
Thanks to this indicator, you can