• 概述
  • 评论 (1)
  • 评论
  • 新特性

NakaTrend

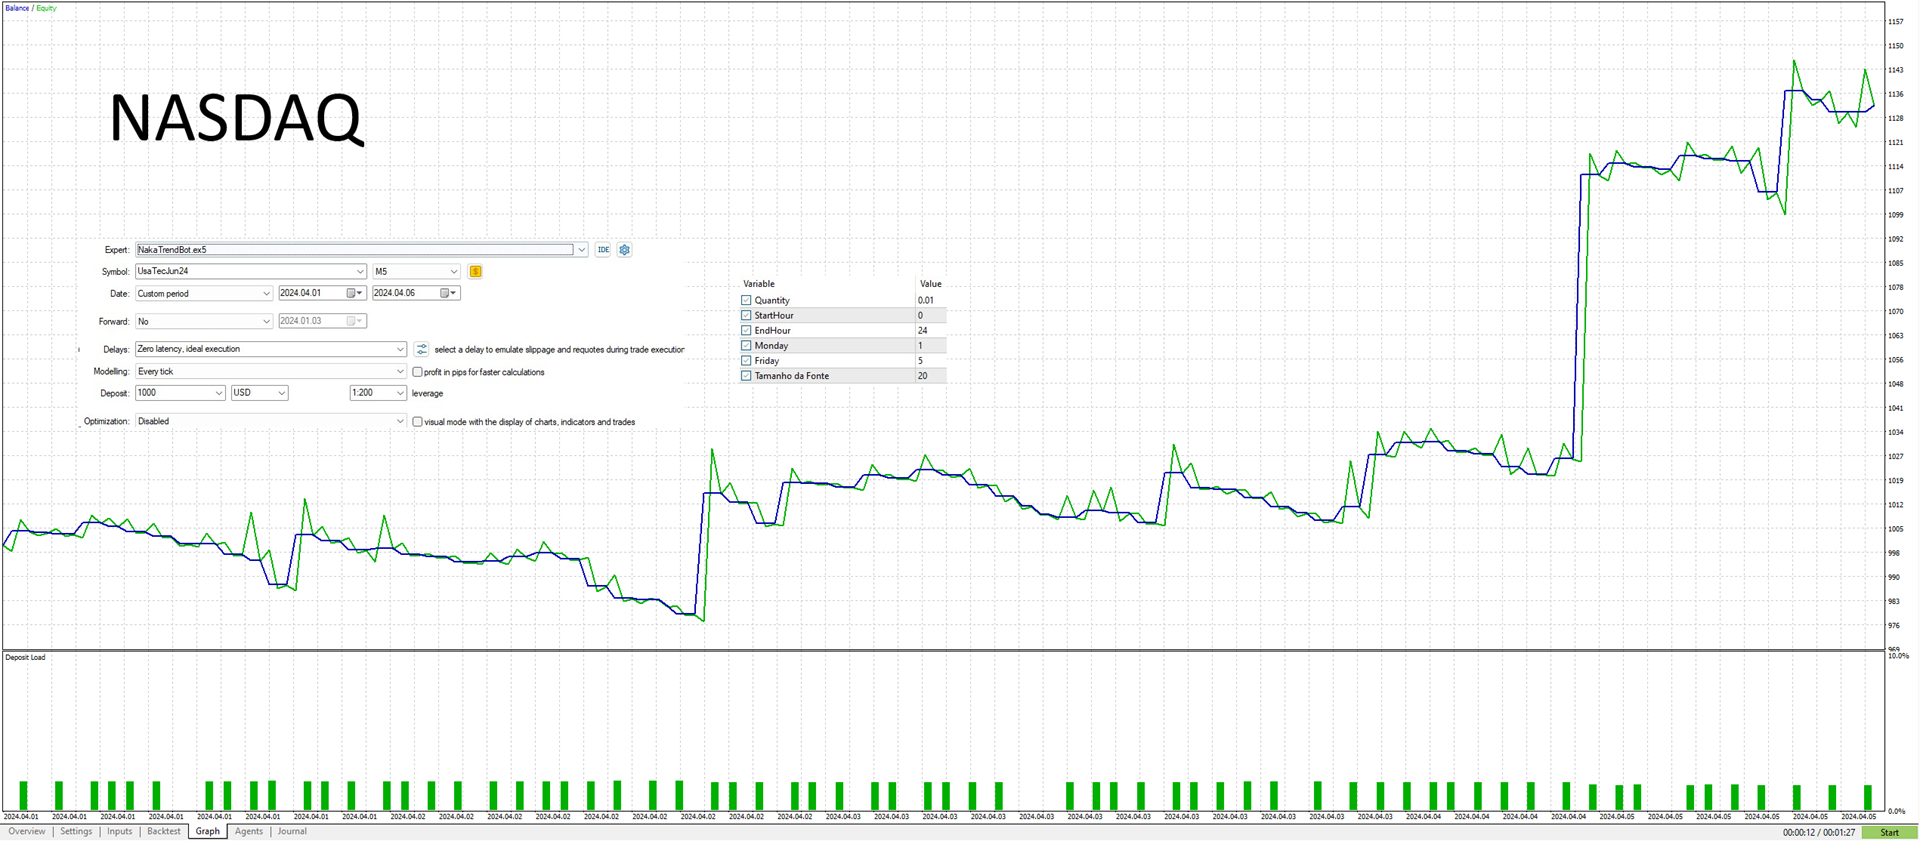
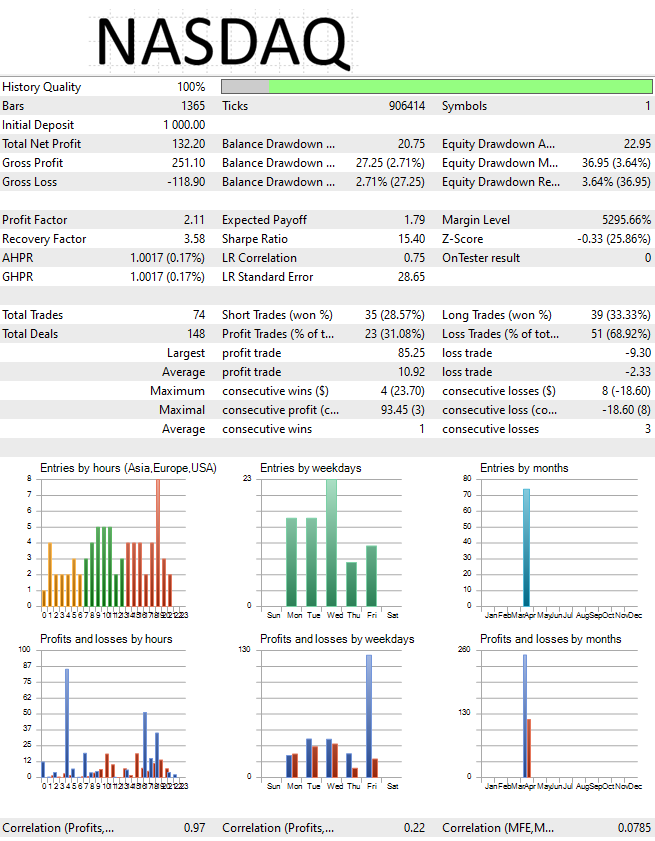
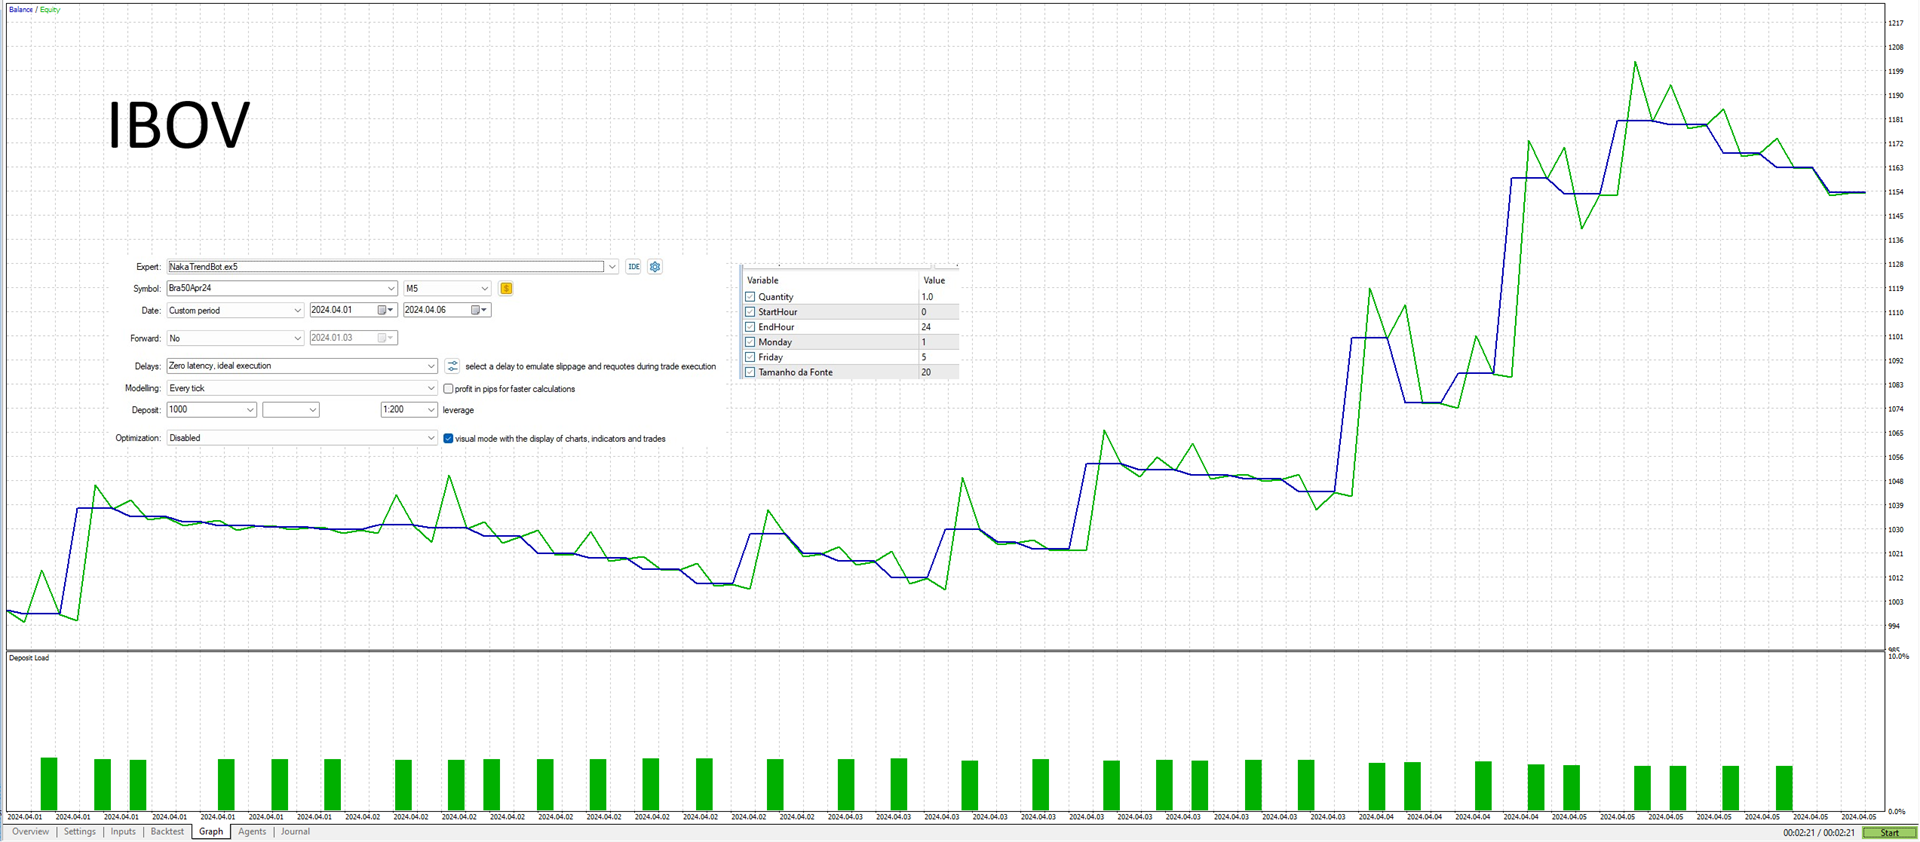
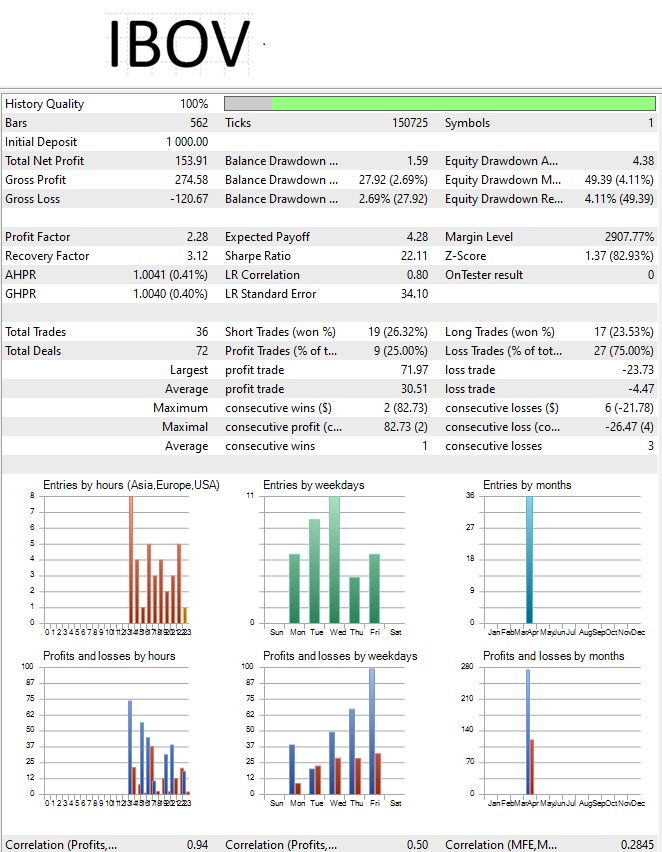
"介绍NakaTrend:您在MetaTrader 5中的终极趋势检测器!

准备彻底改变您的交易体验了吗?来看看NakaTrend,您在精确和轻松识别趋势变化方面的首选指标。

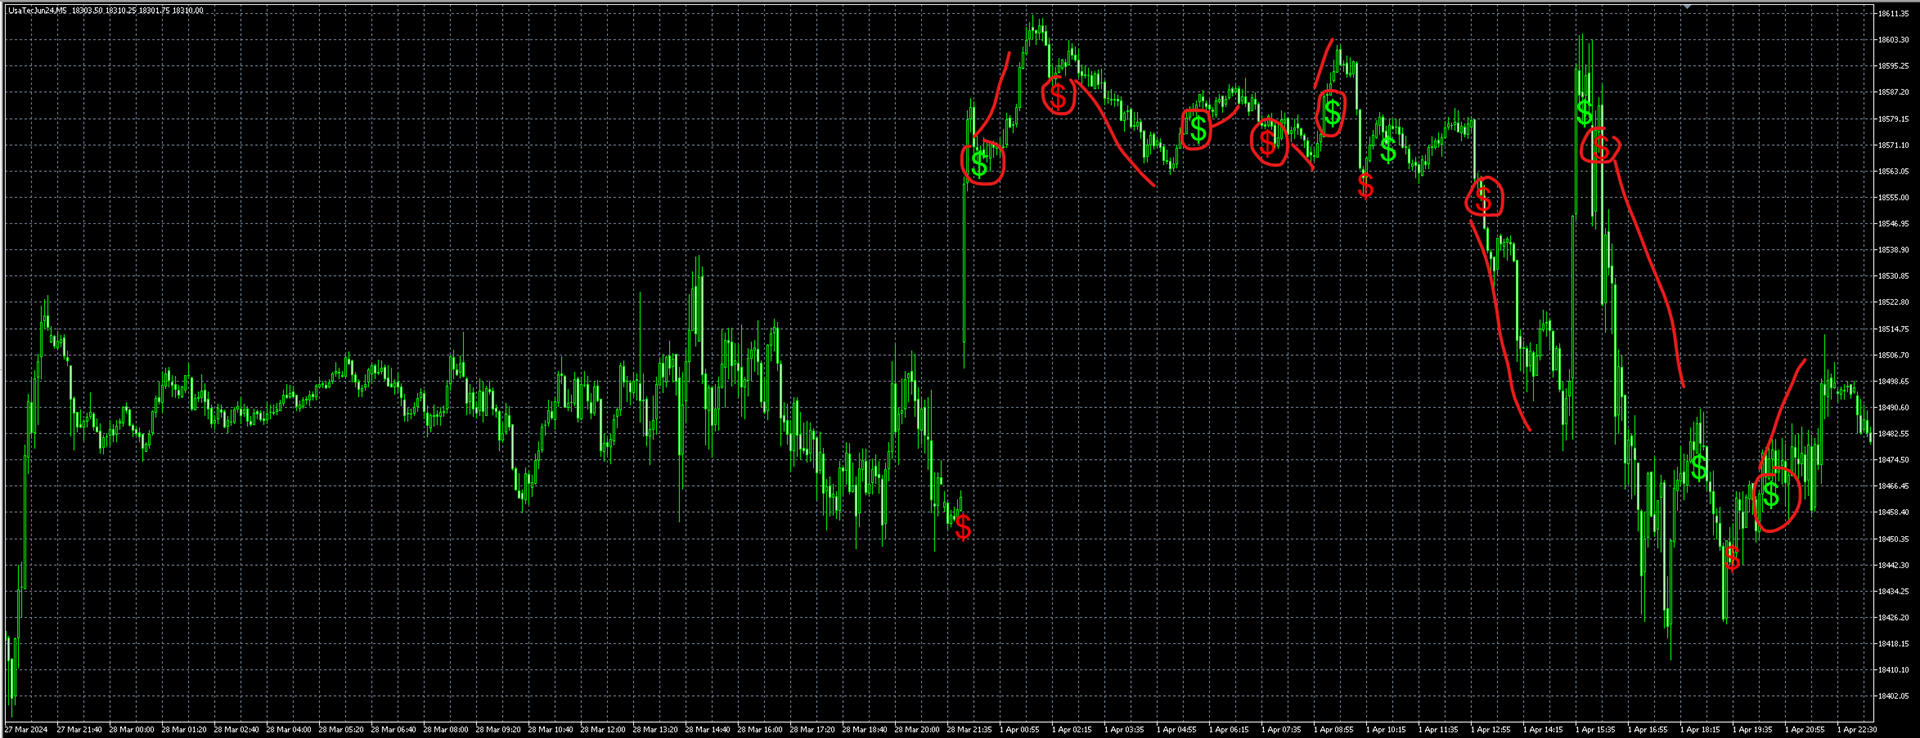
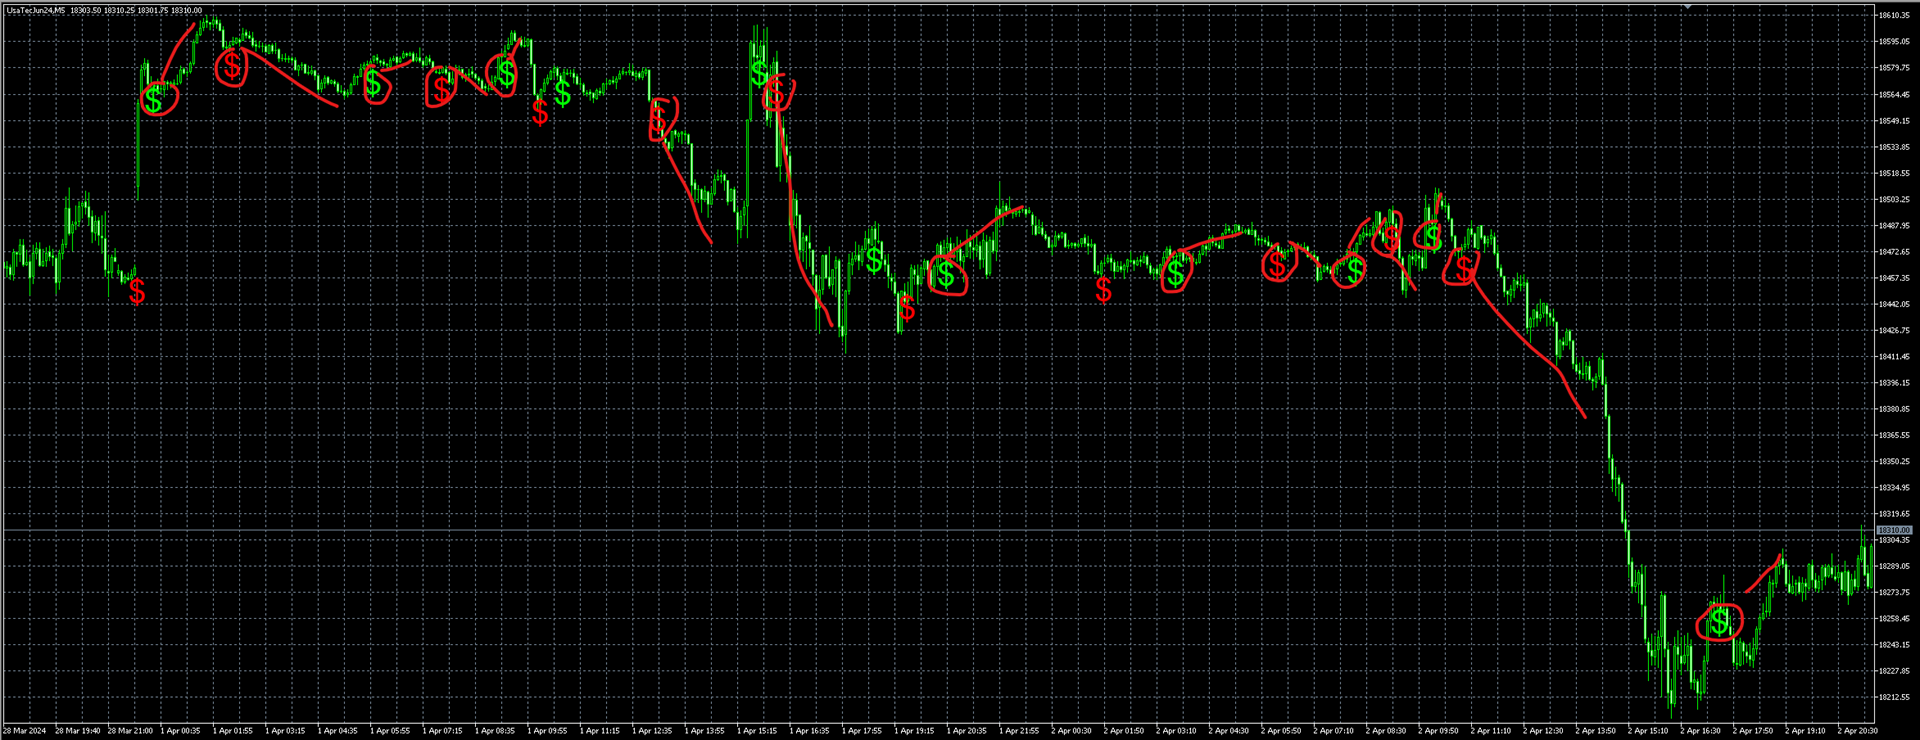
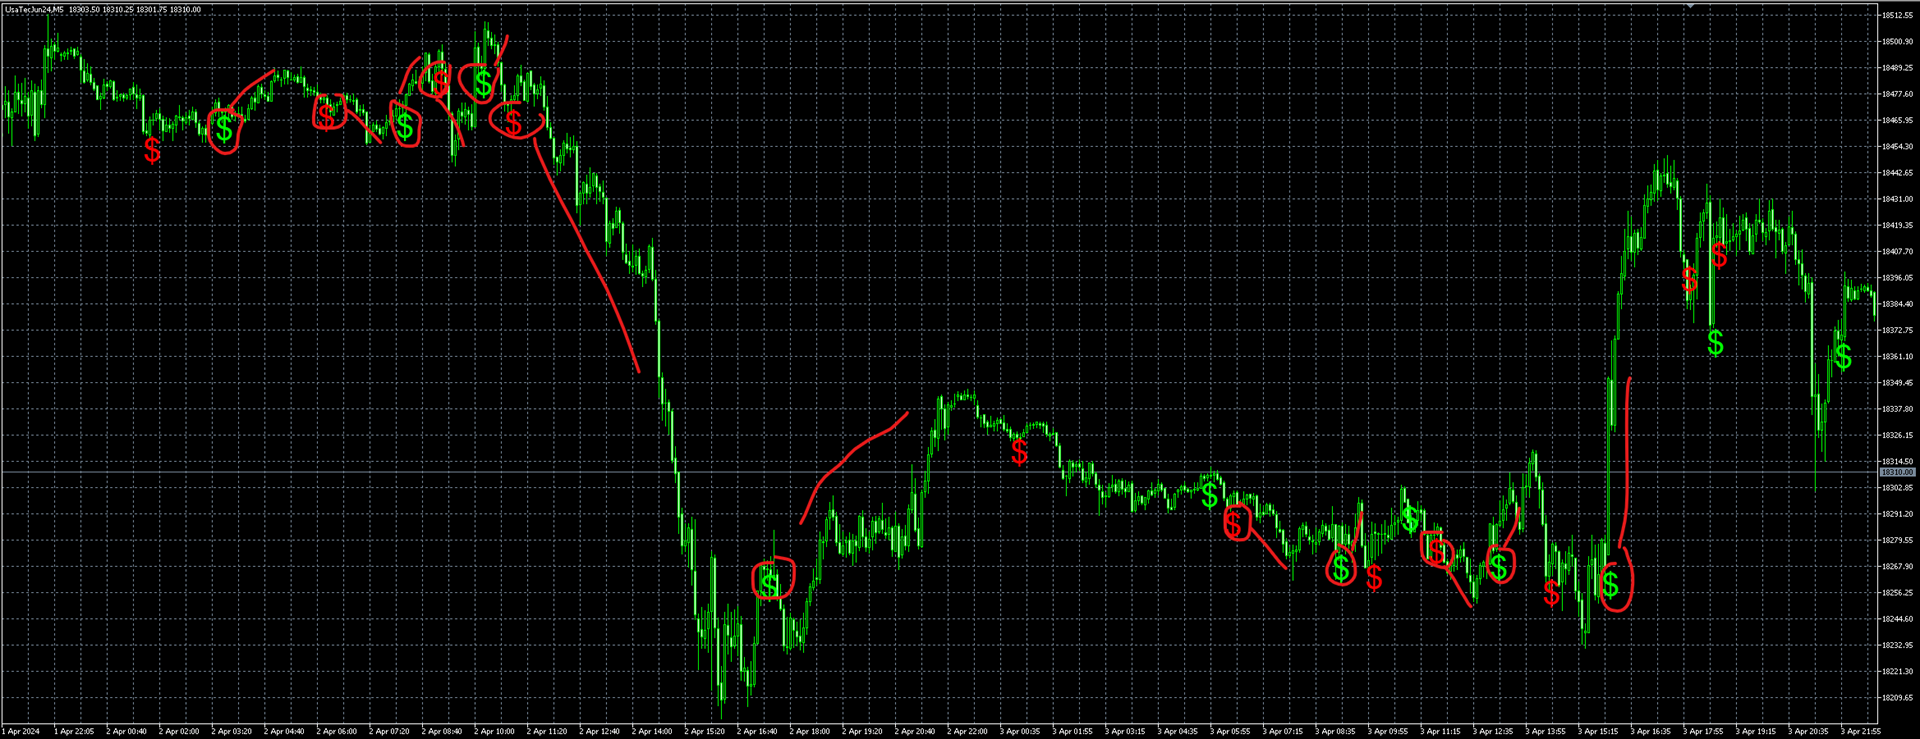
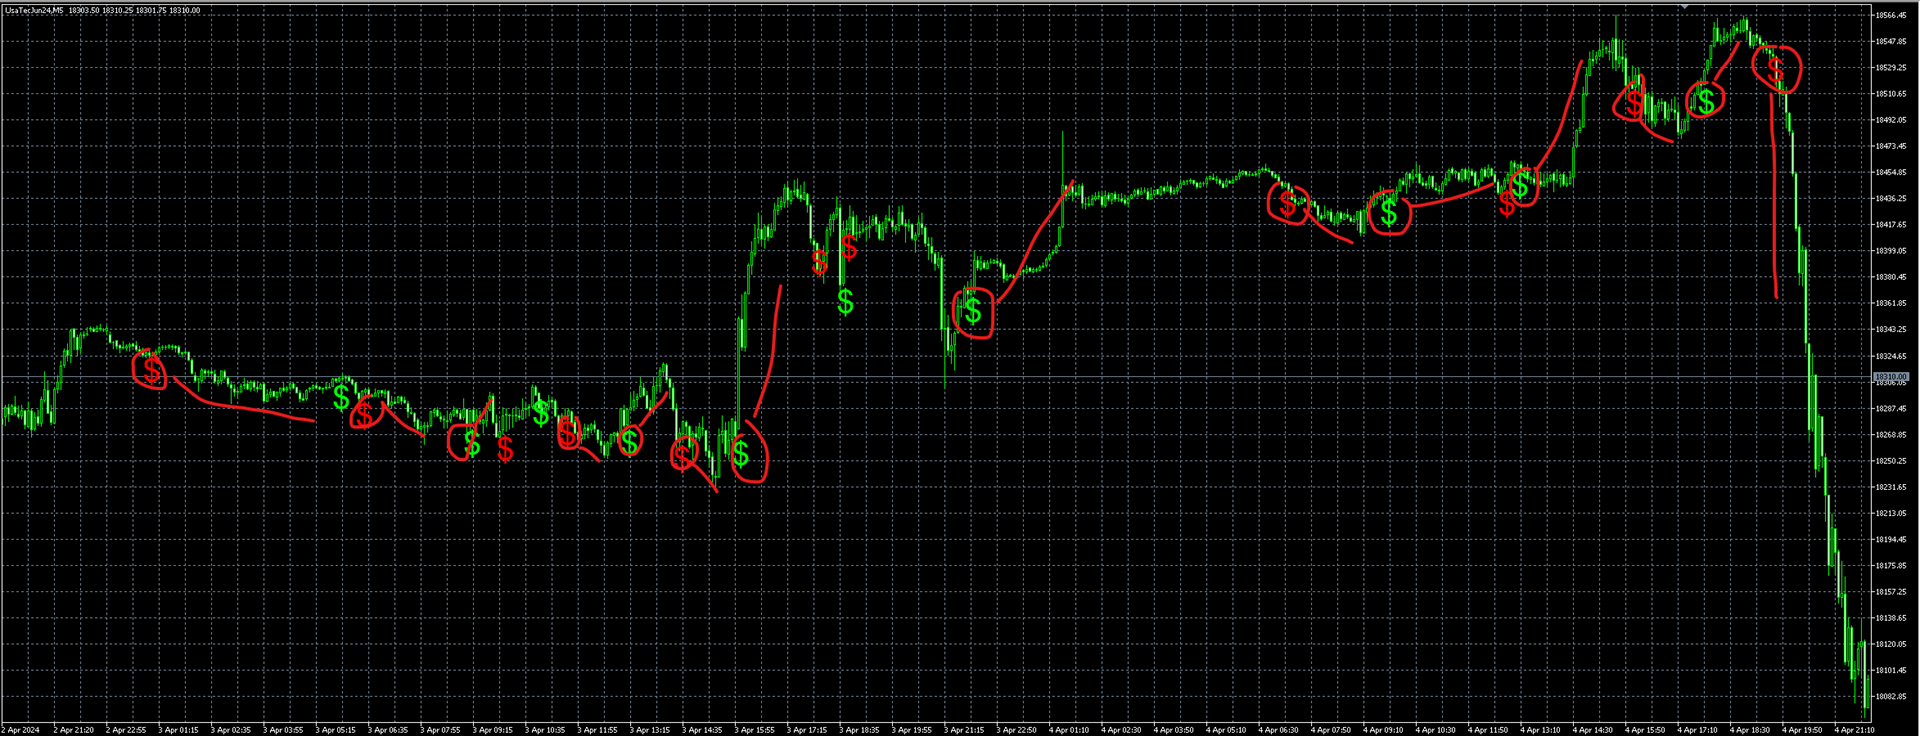
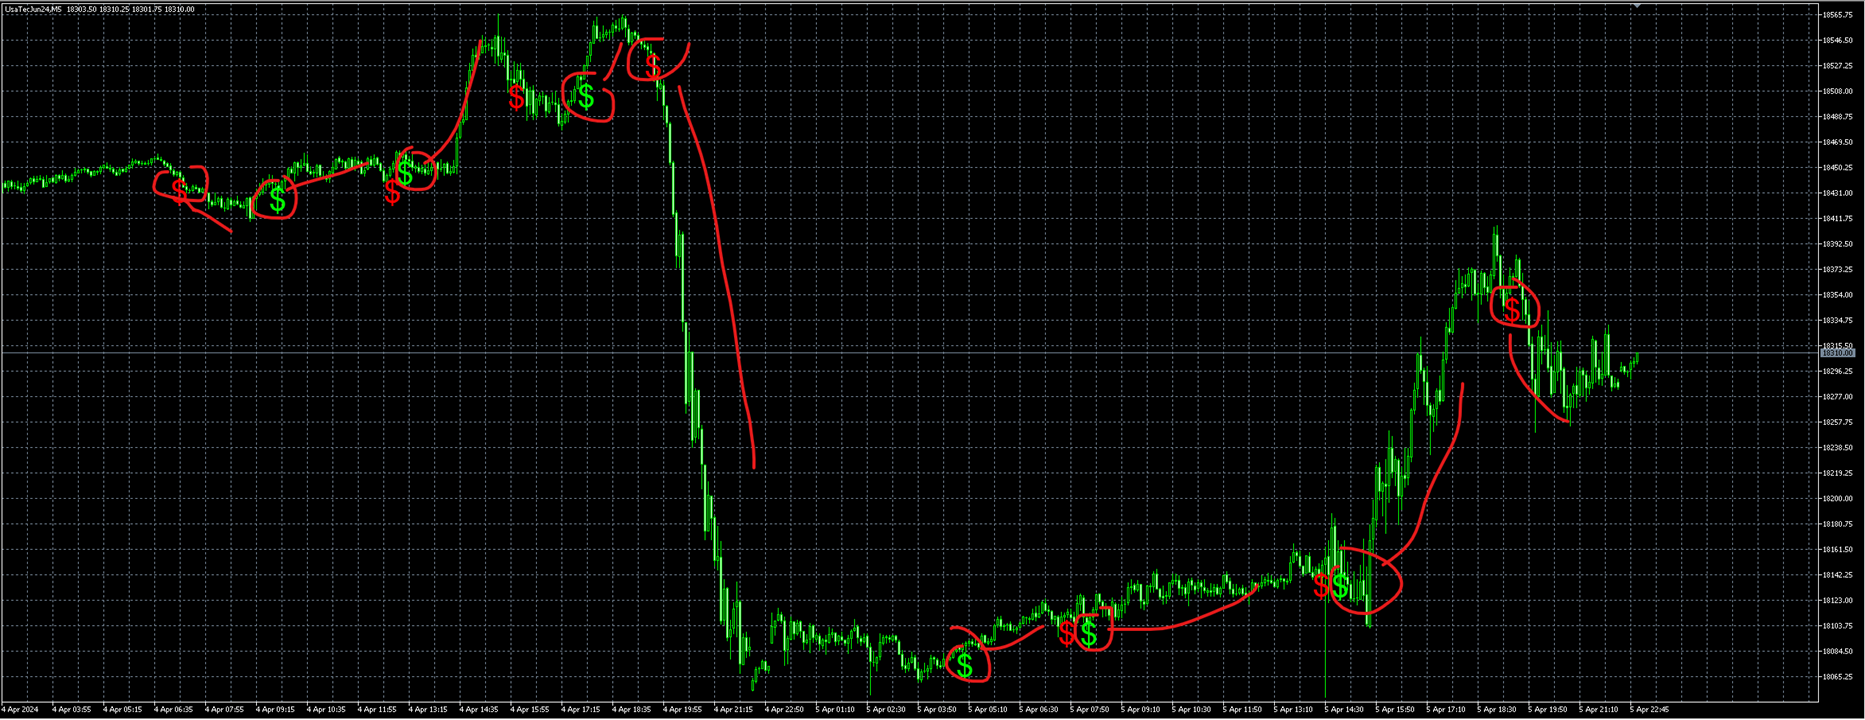
有了NakaTrend,您将不会错过任何利用市场变化的机会。当出现看涨趋势时,NakaTrend会用绿色美元符号来表示,提示您进入买单。当趋势转为看跌时,会出现红色美元符号,表明这是放空的完美时机。

但这还不是全部- NakaTrend赋予您掌控交易的能力,允许手动下单。您的直觉与NakaTrend的见解相结合,将带领您取得有利的结果。

那些依赖猜测或过时指标的日子已经一去不复返了。NakaTrend利用先进的算法为您提供清晰、可操作的信号,您可以信任。

由于NakaTrend直接在MetaTrader 5中运行,将其集成到您的交易例程中是顺畅且无需麻烦的。只需安装NakaTrend,您将立即获得其强大的功能和功能。

但请记住,成功的交易不仅仅是进入交易-还包括知道何时退出。NakaTrend将这一决定留给您,让您可以根据自己的风险偏好和市场情况管理交易。

为了充分利用NakaTrend,请确保您实施可靠的风险管理实践。这意味着设置止损水平,遵守头寸大小原则,并保持纪律性的交易方式。

不要满足于猜测的过时指标。拥抱NakaTrend的力量,开启交易机会的新世界!

用NakaTrend改变您的交易之旅-成为MetaTrader 5的终极趋势检测器。立即开始,迈出实现财务目标的第一步!

感受NakaTrend可以给您的交易带来的差异-加入我们成功交易者的社区,将您的交易提升到新的高度!

有了NakaTrend的支持,可能性无限。别再等了-抓住这个机会,革新您的交易策略,并开始最大化您的利润!"
推荐产品
Vertical Volume
Kim Yonghwa
5 (3)
特点 用于检查价格量的指标。 主要适用于EURUSD,其他货币对可能无法工作或计算时间较长。 为了平稳使用,请打开“将图表边界从右边界向右移”的选项,如屏幕截图所示。 出现新的柱状数据时重置数据。 变量 COlOR:指标颜色设置 WIDTH:指标宽度设置 PERIOD:确定计算数据的时间周期 ------------------------‐-----------------------------------------------------------------------------------------------------------------------------------------------
FREE
TickChart Indicator plots tick line on the main window of MetaTrader. In the Lite version, the number of ticks is limited to 20 and the alert function described below is omitted.  The tick-line shows the most detailed, fastest and real-time activities of the market, which are usually hidden in bars or candles longer than 1 minute. Usually, several new tick-line segments appear while a bar of M1 time frame is completed. After the release of an important economic indicator, the number of ticks pe
FREE
Sentiment Liner This is a steroidised Daily-Weakly-Monthly high-low and open, must have indicator. With this stuff user can determine the average of (daily-weakly-montly) open levels. 4 example: if you in day mode switch the average to 5, you get the 5 day sentiment. In weakly mode turn the average to 4, than you get the 4 weak sentiment,...so on. Naturally one can us as a simple day-week-month high and low indikator. S1: high S2: low Pivot: open, Average: averager
FREE
Ultimate Fibonacci Trader
Philip Effiong Philip
Whether you're an analyst looking for a Fibonacci charting platform for Fibonacci Ratio analysis, or a trader looking for an advanced Fibonacci trading tool, Ultimate Fibonacci  has what you need. Ultimate Fibonacci   has the most advanced and full-featured Fibonacci charting and trading software on the market. GIVE ME A GOOD RATING! Ultimate Fibonacci  measures and calculates Fibonacci projections and Retracement levels for you, as well as Price projections (like Wave 2 vs. 1 or Wave 4 vs. 2
FREE
Fair Value Gap Scanner
Usiola Oluwadamilol Olagundoye
The Fair Value Gap Detector is a MetaTrader 5 indicator designed to identify and draw rectangles on the chart wherever fair value gaps (FVGs) are detected. Fair value gaps occur when there is a significant disparity between the current price and the fair value of an asset. These gaps can provide valuable insights into potential trading opportunities, as they often indicate overbought or oversold conditions in the market. Key Features: FVG Detection: The indicator utilizes a proprietary algorith
FREE
RSI Chart Levels
Nikolay Mitrofanov
5 (6)
The indicator draws levels based on the overbought and oversold values ​​of the RSI indicator. The maximum values ​​are taken into account, which are equal to or exceeded certain limits. That is, for example, when the price has gone into the overbought zone, the highest price is selected from all prices in this zone for this period of time, and as soon as the indicator value returns to a value below the overbought value, the level is fixed and the calculation of new values ​​begins. The sam
FREE
Graphic Alignment Context
Ricardo Alexandre Laurentino
The Graphic Alignment Context (GAC) Technical Indicator measures the vertical difference of the simple average price of a financial instrument in the context of three different timeframes determined by a defined number of bars or candles (periods) to determine the strength of the buy or sell trend. sale. Ascending average prices indicate Buying strength (1), Descending average prices indicate Selling strength (-1) and any scenario different from the previous two conditions indicates Neutrality
FREE
One of the simplest Pivot Point indicator, easy to operate, and most complete for a single chart in determining    Resistance   and   Support  level lines. In single chart,  it will show R&S Level Line with 5 popular types of Pivot Point, Highest&Lowest of closing price Include the Trend and up to 3 Time Frames. Five   types   (Floor, Woodie, Camarilla, DeMark, & Fibonacci)   of popular   Pivot Points   in determining   Resistance   and   Support   levels. With just using simple button on th
FREE
VWAP Simple
Deibson Carvalho
4.06 (34)
The Volume Weighted Average Price is similar to a moving average, except volume is included to weight the average price over a period.    Volume-Weighted Average Price [VWAP] is a dynamic, weighted average designed to more accurately reflect  a security’s true average price over a given period . Mathematically, VWAP is the summation of money (i.e., Volume x Price) transacted divided by the total volume over any time horizon, typically from market open to market close. VWAP reflects the capital
FREE
Simple Weis Wave
Jean Jacques Huve Ribeiro
4.2 (5)
One of the best tools for analyzing volume, Weis Wave was idelized by David Weis, to facilitate the reading of directional flow. For the VSA method disciples it is an evolution of the practices created by Richard Wycoff, facilitating a predictive reading of the market, always seeking an accumulation and distribution of the negotiated contracts. Cumulative wave volume  Range of wave ( removed) Average Wave volume Ref "Tim Ord lectures" ( removed)
FREE
Dsc Panel Trade
Diogo Sawitzki Cansi
o DSC Panel é um auxiliar para deixar ordens já posicionadas em pontos estratégicos no gráfico de maneira automática. Em conjunto com o indicador DSC Vwap Channel e DSC Candle Agression é uma poderosa ferramenta para o trader obter uma excelente assertividade em suas operações.   VEJA OS NOSSOS RESULTADOS OPERANDO MINI INDICE NO INSTAGRAM:  https://www.instagram.com/diogo.cansi/   GRUPO DO TELEGRAM =  https://t.me/robosdsc Maiores informa çõ es pelo email dscinvestimentos@gmail.com Ou pelo
FREE
This indicator is stand alone version from  MP Pivot Levels  (All in one) containing Demark's Pivots. Calculations:     PP = X / 4     R1 = X / 2 - LOWprev     S1 = X / 2 - HIGHprev Uses: When the pair currency price may change the direction of movement. Possible constraints of support and resistance that creates plateaus for the currency pair prices. Tendency identification by comparing the present prices according to current day's pivot point and also the prior day's pivot points. ___________
FREE
Slow RSI
Flavio Javier Jarabeck
4.83 (6)
For those who feel that regular RSI is too fast and too noisy to be used on regular trades or in EAs and want to have an alternative to meter the Momentum of the Price, here is a solution presented on the great article of the Technical Analysis of Stocks & Commodities magazine (April, 2015), by Vitali Apirine, called: Slow Relative Strenght Index . Its reading is almost the same as the regular RSI, but its levels of Overbought and Oversold are 80 and 20 instead. SRSI is very powerful to show div
FREE
Decision Point
Zoltan Nemet
5 (2)
With this indicator user can determine not just pivot like turning points. User able to spot trading ranges boundaries and support-resistance levels.  In a strong trend the reverse signals also gives us excellent entry points. Recommended user settings: In the Attis volume: look back period : 1 or (3) MA_Lenght 99. ( of course one can play with the settings and get tailored signals... as you need)
FREE
Color Trend
Bruno Goncalves Mascarenhas
Combining the best of Price Action , Directional Movement , and Divergence / Convergence analysis, the Candle Color Trend is the easy and reliable way to identify the direction of the trend. The indicator automatically paints the candles according to the premise that the upward trend is defined by prices that form a series of ascending tops and bottoms. On the other hand, the downward trend is defined by prices that form a series of descending tops and bottoms. Color Trend is certainly one
FREE
Rejection Zones
Paulo Henrique Faquineli Garcia
Este poderoso indicador analisa o gráfico e mostra zonas de Rejeição de Preços! Isto é, locais onde o preço foi, mas não foi aceito pelo mercado! A visualização desta zona de Rejeição, facilita o entendimento do trader na tomada de decisões de onde operar e como operar! O indicador é composto por 4 linhas, sendo classificadas em 2 grupos: Linhas Vermelha e Amarela: Denotam os extremos onde o preço conseguiu chegar, mas não foi aceito! Linhas Laranja e Azul: A partir delas, denotam o Início da
FREE
MADayLevel
Azamat Mullayanov
Простейший индикатор для ручной торговли. Для комфортной торговли так же имеется эксперт https://www.mql5.com/ru/market/product/41133 Суть идикатора: уровни строяться на основе Moving Average с выбранным периодом по ценам High и Low. На разнице между High и Low строятся следующие уровни выше и ниже. В случае если бар не выходит за уровни, помечается зеленой меткой. Данную метку и уровни можно использовать для выставления отложенных ордеров когда цена на долго застревает между уровнями. Входны
FREE
QuantumAlert Stoch Navigator is a free indicator available for MT4/MT5 platforms, its work is to provide "alerts" when the market is inside "overbought and oversold" regions in the form of "buy or sell" signals. This indicator comes with many customization options mentioned in the parameter section below, user can customise these parameters as needful. Join our   MQL5 group , where we share important news and updates. You are also welcome to join our private channel as well, contact me for the p
FREE
Pivot Classic, Woodie, Camarilla, Fibonacci and Demark Floor/Classic Pivot points, or simply pivots, are useful for identifying potential support/resistance levels, trading ranges, trend reversals, and market sentiment by examining an asset's high, low, and closing values. The Floor/Classic Pivot Points can be calculated as follows. Pivot Point (P) = (High + Low + Close)/3 S1 = P * 2 - High S2 = P - (High - Low) S3 = Low – 2*(High - P) R1 = P * 2 - Low R2 = P + (High - Low) R3 = High + 2*(P - Lo
FREE
TilsonT3
Jonathan Pereira
Tillson's T3 moving average was introduced to the world of technical analysis in the article ''A Better Moving Average'', published in the American magazine Technical Analysis of Stock Commodities. Developed by Tim Tillson, analysts and traders of futures markets soon became fascinated with this technique that smoothes the price series while decreasing the lag (lag) typical of trend-following systems.
FREE
功能 斐波那契回调交易指标 根据之前选择的1小时、4小时、1天和1周中的某个时间段绘制斐波那契图表。 当市场价格触及斐波那契水平时,颜色会变化,并显示触摸时间。 斐波那契图在-23.6、0、23.6、38.2、50、61.8、76.4、100和123.6水平绘制,当柱更新时,图表会刷新。 变量 时间框架:根据选择的1小时、4小时、1天和1周时间框架绘制斐波那契图表。 FiboWidth:确定水平线的粗细。 FiboStyle:设置枢轴水平线的样式。 TouchedColor:触摸时变化的颜色。 如果您发现任何错误或希望看到改进,请发表评论。 评价对开发者非常有帮助。如果您满意,请给我们5星评价。 -----------------------
FREE
General Clock
Fernando Lahude Ritter
A Simple clock that on the left side "Time" shows r espectively the TimeCurrent, followed beneath by the TimeLocal. On the right hand side we have the remaining minutes and seconds of the current candle. TimeLocal is synced every 500 miliseconds however, the TimeCurrent and the time left on the candle are synced every tick, so this can lead to inconsistencies on the readings so keep that in mind. This indicator have no plots or buffers so it cannot be used in any time based EA.
FREE
Colored Adaptive Moving Average AMA
Flavio Javier Jarabeck
4.78 (9)
If you like to use traditional Moving Averages (like SMAs and EMAs) to provide your trades for dynamic levels of Support and Resistance, you will love the Adaptive Moving Average (AMA). Created in 1995 by Perry Kaufman and presented to the world in his book " Smarter   Trading :  Improving   Performance   in   Changing   Markets ", the Adaptive Moving Average (also known as KAMA - Kaufman Adaptive Moving Average) has the goal to be the perfect companion for following a trend without noise, but s
FREE
All in 1 Propsense MT5
Mark Bernardinis
5 (3)
Apply to the 5 minute timeframe against the major USD forex pairs. AUDUSD EURUSD GBPUSD USDCAD USDCHF USDJPY Highlights the PropSense Book Levels Turn on/off for Sydney, Asia, London and New York Sessions Shows the Tokyo and London Fixes Turn on/off for Tokyo and London Configure how many historical fixes to show Shows the Sessions Turn on/off visible indication for sessions (supports 4 sessions) Visibly shows the sessions (out of the box configuration for Sydney, Tokyo, London and New York) Hig
FREE
Standard PVSR
Ashok Kumar Singha
Standard PVSR is based on Pivot Points. Steps to Setup the Indicator: Install the Custom Indicator; Set all the Lines Color, Width and Styles; Set visualization to All Timeframe; and DONE It can be used for: All Pairs: Forex, Cryptocurrencies, Metals, Stocks, Indices etc. All Timeframe All Brokers All type of Trading Style like Scalping, Swing, Intraday, Short-Term, Long-Term etc. Multiple Chart -->> For any Type of Support, Guidance, Setup Issue, EA Optimization, Input Setup etc.
FREE
AliPivot Points
Alexandra Voicu
AliPivot Points is a Meta Trader 5 Indicator that draws you the latest pivot points. You can choose from timeframes ranging from 1 Minute to 1 Month. Calculation methods for pivot points includes: Classic Pivot Points Camarilla Pivot Points Fibonacci Pivot Points Woodie Pivot Points You can personalize the line colors, style, and width to suit your preference. The indicator displays values on the right side of the chart. AliPivot Points values can also be utilized by developers for creating Expe
FREE
Estratégia de negociação MACD O cálculo do MACD é executado uma vez a cada tick, e são considerados para fim de cálculo os três últimos resultados, para analisar o cruzamento da linha de zero, ou seja quando o último resultado for maior que 0 e o antepenúltimo não então há um cruzamento para cima e analogamente para baixo, quando um cruzamento é constatado o estado de uma variável de controle é alterado de "false" para "true", permitindo o abertura de uma posição caso a média de sinal também cru
FREE
Activity Power
Zoltan Nemet
5 (5)
Multi time frame, multy currency special swing volume indicator with engulfing waves too. Simpler to use compare to Weis Wave. User don't need to adjust wave size. Just use of the basic or the upper time frames. As a multi time frame indikator user can do  very complex time frame analysyses. As well as a multy currency indicator one can make market sector-segment analysyses. Use with Wckoff principles.
FREE
The   Pivot Point indicator   automatically calculates and displays the pivot point line and support and resistance levels. Pivot can be calculated according to the Classic, Floor, Fibonacci, Woodie, Camarilla or DeMark formula. It is also possible to select the period for calculating the indicator. A trader can choose from daily, weekly, monthly, or user-defined periods. Types of pivots Classic Floor Fibonacci Woodie Camarilla DeMark Main features The indicator shows the current and histor
FREE
FT ADX Color Candles
FELIPE MISAEL MORAES KRUGER
4.86 (7)
Trading can be quite tiring when you need to look at several things at the same time. Format of candles, supports, resistances, schedules, news and indicators. This tool aims to facilitate the analysis of the ADX indicator. It colors the candles based on the levels of the indicator and the DI lines. The period, the limit of the indicator and the colors of the candles are customizable. You can also place a visual aid on the lower right side of the graph to view the values of ADX, DI + and
FREE
该产品的买家也购买
Atomic Analyst MT5
Issam Kassas
5 (15)
首先值得强调的是,该交易指标是非重绘、非延迟的指标,这使其成为手动和机器人交易的理想选择。 用户手册:设置、输入和策略。 Atomic Analyst是一种PA价格行动指标,利用价格的力量和动量来寻找市场上更好的机会。配备了高级过滤器,可帮助去除噪音和假信号,并提高交易潜力。使用多层复杂的指标,Atomic Analyst扫描图表,并将复杂的数学计算转化为任何初学者都能理解并用来做出一致交易决策的简单信号和颜色。 “Atomic Analyst”是专为新手和经验丰富的交易者量身定制的综合交易解决方案。它将高级指标和一流功能融合为一体的交易策略,使其成为所有类型交易者的多功能选择。 日内交易和剥头皮策略:专为快速准确的日内交易和短期交易而设计。 日内和摆动交易策略:可用作追求价格大幅波动的日内和摆动交易者的可靠工具。 多货币和市场:凭借其可靠的精度,在不同的工具和市场上运作。 多个时间框架:可在多个时间框架上使用,性能良好。 稳定性:所有指标均不重绘、不重绘和不滞后,确保可靠的信号。 信号清晰度:提供箭头信号,用于清晰的入场和出场点。 实时警报:通过交易入场、SL和TP警报通知交
Quantum Trend Sniper
Bogdan Ion Puscasu
5 (46)
介绍   量子趋势狙击指标 ,突破性的 MQL5 指标,正在改变您识别和交易趋势反转的方式!由拥有超过13年交易经验的资深交易员团队开发,     量子趋势狙击指标   旨在通过其创新的方式以极高的准确度识别趋势反转,将您的交易之旅推向新的高度。 ***购买量子趋势狙击指标,即可免费获得量子突破指标!*** 当量子突破指标识别出趋势反转时,它会向您发出警报和信号箭头,并建议您三个止盈水平。 它既适合新手交易者,也适合专业交易者。 量子 EA 通道:       点击这里 MT4版本:       点击这里 建议: 时间范围: 所有时间范围。为了获得最佳结果,我们建议在 M15、M30 和 H1 时间范围内使用它。 货币对:欧元兑美元、英镑兑美元、澳元兑美元、欧元兑英镑、, EURAUD,  XAUUSD 账户类型:ECN、Raw 或 Razor,点差极低 经纪时间:任意 经纪商:IC Markets、Pepperstone with Raw 和 Razor 的点差最低 建议止损:50 点 建议止盈水平:20 点、50 点和
首先,值得强调的是,这个交易系统是一个非重绘、非重画和非滞后的指标,这使得它非常适合手动和机器人交易。 在线课程,手册和下载预设。 “智能趋势交易系统 MT5”是专为新手和经验丰富的交易者量身定制的综合交易解决方案。它结合了超过 10 个优质指标,具有 7 多个强大的交易策略,使其成为适用于各种市场条件的多功能选择。 趋势跟随策略:提供精确的入场和止损管理,以有效地跟随趋势。 反转策略:识别潜在的趋势反转,使交易者能够利用区域市场的机会。 剃头策略:专为快速准确的日内交易和短期交易而设计。 稳定性:所有指标都不会重绘、不会重画和不会滞后,确保可靠的信号。 定制:支持自定义策略,以满足个人交易偏好。超过 7 种策略和组合可帮助您找到最佳策略。 信号清晰度:提供箭头信号,以指示清晰的入场和退出点。 实时警报:通过交易进出警报使交易者保持了解。 深入分析:提供更高时间框架的趋势分析和实时交易监控。 自适应颜色编码:利用蜡烛颜色编码来显示成交量、趋势和反转蜡烛信号。通过蜡烛颜色分析市场方向。 “智能趋势交易系统 MT5”赋予交易者必要的工具,以便在各种市场条件下做出明智和战略性的交易决策。无论
Gold Stuff mt5
Vasiliy Strukov
4.9 (181)
Gold Stuff mt5 是专为黄金设计的趋势指标,也可用于任何金融工具。 该指标不会重绘,也不会滞后。 推荐时间框架 H1。 购买后立即联系我以获得设置和个人奖励!   你可以在我的个人资料中找到它。   重要! 购买后立即与我联系,以获得说明和奖金!   您可以免费收到我们的强力支持和趋势扫描指标的副本,请私信。大部头书!   设置 绘制箭头 - 打开关闭。 在图表上绘制箭头。 警报 - 打开关闭声音警报。 电子邮件通知 - 打开关闭。 电子邮件通知。 Puch-notification - 打开关闭。 推送通知。 接下来,调整色域。 Gold Stuff mt5 是专为黄金设计的趋势指标,也可用于任何金融工具。 该指标不会重绘,也不会滞后。 推荐时间框架 H1。 购买后立即联系我以获得设置和个人奖励!   设置 绘制箭头 - 打开关闭。 在图表上绘制箭头。 警报 - 打开关闭声音警报。 电子邮件通知 - 打开关闭。 电子邮件通知。 Puch-notification - 打开关闭。 推送通知。 接下来,调整色域。
Entry Points Pro for MT5
Yury Orlov
4.55 (160)
这款指标用于 MT5,可提供准确的入场交易信号,且无重绘。 它可应用在任何金融资产:外汇、加密货币、贵金属、股票、指数。 它将提供极其精准的评估,并告诉您何时开仓和平仓的最佳时机。 观看 视频 (6:22),其中包含一个仅处理单一信号的示例,该信号即可值回指标购价! 大多数交易者在 Entry Points Pro 指标的帮助下,在第一个交易周内即改善了他们的交易结果。 订阅我们的 Telegram 群 ! Entry Points Pro 指标的益处。 入场信号无重绘 如果信号出现,并得到确认,则它不会再消失;不像是重绘指标,它会导致重大的财产损失,因为它们可以在显示信号后再将其删除。 无差错开仓 指标算法可令您找到入场交易(买入或卖出资产)的理想时机,从而提高每位交易者的成功率。 Entry Points Pro 可操作任何资产 它允许您在 MT5 平台上交易任何经纪商的加密货币、股票、贵金属、指数、大宗商品和货币。 提供任何方向的信号 Entry Points Pro 指标提供针对任意价格走势的入场交易信号 - 上涨、下跌或横盘(横向)。
Trend Screener Pro MT5
STE S.S.COMPANY
4.88 (66)
使用趋势筛选指标释放趋势交易的力量:由模糊逻辑和多货币系统提供支持的终极趋势交易解决方案! 使用趋势筛选器(由模糊逻辑提供支持的革命性趋势指标)提升您的趋势交易。 它是一个强大的趋势跟踪指标,结合了超过 13 种高级工具和功能以及 3 种交易策略,使其成为使您的 Metatrader 成为趋势分析器的多功能选择。 限时优惠:趋势筛选指标终身仅需 50 美元。 ( 原价 125$ ) (优惠延长) 体验趋势筛选器 100% 无需重新绘制的准确性,确保您的交易决策不受过去价格变化的影响。 释放多时间框架和多货币功能的多功能性,使您能够以无与伦比的信心在外汇、商品、加密货币和指数领域进行交易。 利用 Trend Screener 的综合策略套件增强您的交易: - 趋势跟踪策略和趋势延续策略 :趋势筛选器的趋势跟踪策略提供清晰的趋势延续信号,让您有效捕捉趋势走势并管理风险。 - 反转策略和早期入场点策略 :趋势筛选器的反转策略可检测市场方向的潜在变化,使您能够预测趋势反转并利用疲弱的市场趋势。通过早期入场点,您可以在潜在的趋势变化之前定位自己 获取可观的利润。 - 倒卖策略: 趋势筛选器的倒卖
AT Forex Indicator MT5
Marzena Maria Szmit
5 (3)
The AT Forex Indicator MT5 is a sophisticated trading tool designed to provide traders with a comprehensive analysis of multiple currency pairs. This powerful indicator simplifies the complex nature of the forex market, making it accessible for both novice and experienced traders. AT Forex Indicator uses advanced algorithms to detect trends, patterns and is an essential tool for traders aiming to enhance their forex trading performance. With its robust features, ease of use, and reliable signal
TPA True Price Action indicator reveals the true price action of the market makers through 100% non-repainting signals strictly at the close of a candle! TPA shows entries and re-entries, every time the bulls are definitely stronger than the bears and vice versa. Not to confuse with red/green candles. The shift of power gets confirmed at the earliest stage and is ONE exit strategy of several. There are available now two free parts of the TPA User Guide for our customers. The first "The Basics"
TPSpro RFI Levels MT5
Roman Podpora
5 (8)
Reversal First Impulse levels (RFI)      INSTRUCTIONS        RUS       -       ENG              R ecommended to use with an indicator   -   TPSpro  TREND PRO -  Version MT4                 A key element in trading is zones or levels from which decisions to buy or sell a trading instrument are made. Despite attempts by major players to conceal their presence in the market, they inevitably leave traces. Our task was to learn how to identify these traces and interpret them correctly. Main functi
首先,值得强调的是,这个交易工具是非重绘、非重画和非滞后的指标,非常适合专业交易。 在线课程,用户手册和演示。 智能价格行动概念指标是一个非常强大的工具,既适用于新手,也适用于经验丰富的交易者。它将超过20个有用的指标合并到一个指标中,结合了高级交易思想,如内圈交易员分析和智能资金概念交易策略。该指标侧重于智能资金概念,提供有关大型机构交易方式的见解,帮助预测它们的动向。 它在流动性分析方面尤其擅长,有助于理解机构的交易方式。它擅长预测市场趋势,并仔细分析价格波动。通过将您的交易与机构策略对齐,您可以更准确地预测市场走向。该指标多才多艺,擅长分析市场结构,识别重要的订单区块,并识别各种模式。 它擅长识别BOS和CHoCH等模式,理解动量的转变,并突出显示供需强劲的关键区域。它还擅长发现强大的不平衡,并分析价格创造更高高点或更低低点的模式。如果您使用斐波那契回撤工具,该指标可以满足您的需求。它还可以识别相等的高点和低点,分析不同的时间框架,并通过仪表板显示数据。 对于使用更高级策略的交易者,该指标提供了工具,如公平价值差指标和优惠和折扣区域的识别。它特别关注高时间框架订单
FX Power MT5 NG
Daniel Stein
5 (5)
通过 mql5 和 Telegram 上 的晨间简报获取每日市场更新,包括详细信息和屏幕截图 ! FX Power MT5 NG 是我们长期以来非常受欢迎的货币强度计算器 FX Power 的下一代产品。 这款下一代强度计算器能提供什么?您所喜爱的原版 FX Power 的所有功能 附加功能 黄金/XAU 强度分析 更精确的计算结果 可单独配置的分析周期 可自定义计算限制,以获得更好的性能 为希望查看更多信息的用户提供特殊的多实例设置 无尽的图形设置,可在每个图表中设置您最喜欢的颜色 无数的通知选项,让您再也不会错过任何重要信息 采用 Windows 11 和 macOS 风格的全新圆角设计 神奇的移动指标面板 FX Power 主要功能 所有主要货币的完整强势历史 所有时间框架内的货币强弱历史 所有经纪商和图表的计算结果完全相同 100% 可靠的实时计算 -> 无重绘 可通过下拉列表选择分析时段 通过自定义模式单独配置分析时段 可在一个图表中使用多个实例 可移动 FX Power 显示屏(通过拖放) 适用于高分辨率 QHD、UHD 和 4K 显示器 自动终端配置 针对平板电脑
成為突破者,隨著價格反轉,市場結構會改變利潤。 訂單突破者指示器可以識別趨勢或價格走勢何時接近枯竭並準備好逆轉。它會提醒您市場結構的變化,通常會在發生逆轉或重大回調時發生。 該指標使用專有計算來確定突破和價格動能。每當在可能的耗盡點附近形成新的高點時,指標就會繪製最後一個生成該高點的順序塊。然後,它將隨價格移動隨價格跟隨定單。然後,當價格轉向相反方向並突破該訂單塊時,它會提醒您,從而創建新的市場結構並開始趨勢或重大回調的可能逆轉。 訂單塊是在創建高/低之前的最後一個相反的彩色蠟燭,並且當價格跌破這些關鍵區域以下時,這表明趨勢可能會發生短期或長期反轉。 特徵 提醒您關鍵耗盡點的市場結構變化 價格接近耗盡水平時自動提取訂單塊 在一個方向繼續移動時,在價格後面跟踪定單,以提醒您最佳的反轉輸入 將顏色更改為純色塊,以顯示何時發生市場結構中斷。 適用於所有交易品種和時間範圍 內置集成的彈出窗口和電子郵件警報 策略和如何與定單破壞者指標進行交易 當斷路器塊發生時,您有兩個選擇。 看左邊!我們正在尋求供應/需求或支撐/阻力位嗎?市場結構轉變(逆轉)通常發生在價格重新測試舊水平或
FX Volume MT5
Daniel Stein
4.94 (17)
通过 mql5 和 Telegram 上 的 " 晨间简报 "获取每日市场更新,包括详细信息和屏幕截图 ! 外汇交易量(FX Volume)是第一个也是唯一一个从经纪商角度真正洞察市场情绪的交易量指标。 直接在您的图表上看到这些信息是真正改变游戏规则和突破性的交易解决方案。 受益于独特的市场数据洞察,如 比率(Ratios )显示货币多头和空头头寸的比率(百分比 比率变化 显示所选时间段内的多头比率及其百分比变化 总交易量 显示货币的总交易量(多头和空头),以手为单位 多头 交易量显示货币所有多头头寸的交易量 空头 交易量显示所有货币空头头寸的交易量 净多头 显示净多头交易量,即所有多头头寸减去所有空头头寸(以手为单位)。 净多头百分比 显示货币净多头交易量的变化 请阅读我们的基本教程 -> "如何使用外汇交易量进行交易 " 获取更多信息,如常见问题、交易技巧和教程视频,请访问我们的 外汇交易量公共信息频道 请 安装并运行 SI Connect 以建立与我们数据中心的持续连接 背景信息 我们都知道,外汇是一个分散的市场。这就是为什么我们必须打破常规思维,开发一个独
Blahtech Market Profile MT5
Blahtech Limited
5 (8)
Was: $249  Now: $99   Market Profile defines a number of day types that can help the trader to determine market behaviour. A key feature is the Value Area, representing the range of price action where 70% of trading took place. Understanding the Value Area can give traders valuable insight into market direction and establish the higher odds trade. It is an excellent addition to any system you may be using. Inspired by Jim Dalton’s book “Mind Over Markets”, this indicator is designed to suit the
ICT, SMC, SMART MONEY CONCEPTS, SMART MONEY, Smart Money Concept, Support and Resistance, Trend Analysis, Price Action, Market Structure, Order Blocks, BOS/CHoCH,   Breaker Blocks ,  Momentum Shift,   Supply&Demand Zone/Order Blocks , Strong Imbalance,   HH/LL/HL/LH,    Fair Value Gap, FVG,  Premium  &   Discount   Zones, Fibonacci Retracement, OTE, Buy Side Liquidity, Sell Side Liquidity, BSL/SSL Taken, Equal Highs & Lows, MTF Dashboard, Multiple Time Frame, BigBar, HTF OB, HTF Market Structure
XQ Indicator MetaTrader 5
Marzena Maria Szmit
5 (1)
Step into the realm of Forex trading with confidence and precision using XQ, a cutting-edge Forex indicator designed to elevate your trading game to unprecedented heights. Whether you're a seasoned trader or just stepping into the world of currency exchange, XQ Forex Indicator empowers you with the insights and signals needed to make informed trading decisions. The signal conditions are a combination of three indicators, and XQ Forex Indicator only display  medium and long-term trends . The ind
Blahtech Supply Demand MT5
Blahtech Limited
4.54 (13)
Was: $299  Now: $99   Supply Demand uses previous price action to identify potential imbalances between buyers and sellers. The key is to identify the better odds zones, not just the untouched ones. Blahtech Supply Demand indicator delivers functionality previously unavailable on any trading platform. This 4-in-1 indicator not only highlights the higher probability zones using a multi-criteria strength engine, but also combines it with multi-timeframe trend analysis, previously confirmed swings
IX Power MT5
Daniel Stein
5 (3)
IX Power 终于将 FX Power 的无与伦比的精确性带到了非外汇交易符号中。 它能准确判断您喜爱的指数、股票、商品、ETF 甚至加密货币的短期、中期和长期趋势强度。 您可以 分析 终端提供的 一切 。试试吧,体验一下您在交易时如何把握 时机 。 IX Power 主要功能 100% 精确的非重绘计算结果 - 适用于您终端中的所有交易符号 下拉式选择预配置以及可单独配置的强度分析周期 通过电子邮件、消息和手机通知的无数种通知选项 可访问的 EA 请求缓冲区 可自定义计算限制,以获得更好的性能 为希望查看更多信息的用户提供特殊的多实例设置 无尽的图形设置,让您在每个图表中都能找到最喜欢的颜色 采用 Windows 11 和 macOS 风格的圆角新面板设计 神奇的移动指标面板,可在子窗口和主图表之间无缝移动 适用于高分辨率 QHD、UHD 和 4K 显示器,并针对平板电脑和触摸屏进行了优化 IX Power 参数 最重要的参数不言自明,但我们很快会在另一篇文章中为您提供所有 IX Power 参数的完整说明。 使用别名 "参数可为技术交易符号
Advanced Supply Demand MT5
Bernhard Schweigert
4.53 (15)
任何新手或专业交易者的最佳解决方案! 该指标是一款独特、高质量、且价格合理的交易工具,因为我们已经整合了许多专有功能和新公式。 依据此更新,您将能够显示双重时间帧区域。 您不仅可以显示一个较高的时间帧,还可以同时显示图表时间帧,加上更高的时间帧:显示嵌套时区。 供需双方所有交易者都会喜欢它。 :) 重要信息披露 高级供需的最大潜力,请访问 https://www.mql5.com/zh/blogs/post/720245   想象您的交易如何得以改善,是因为您能够精准定位入场或目标位吗? 构建于新的底层算法,它可以更轻松地识别出买卖双方之间的潜在失衡。 这是因为它以图形方式展示供需最强劲区域,及其过去的表现(显示旧区域)。 这些功能旨在帮助您更轻松地发现最佳入场区域和价位。 现在您可以针对您的交易品种和时间帧来优化和编辑区域强度! 高级供需指标适用于所有产品和时间帧。 它是一个新的公式,非常新的功能是两个区域强度函数可由用户输入进行调整! 这在交易中是一大优势。 当您学习如何使用专有功能,例如带有价格游离最小 X 因子的区域强度时,您能够判断该区域强劲与否。 供需区域用作警报触发器
Matrix Arrow Indicator MT5
Juvenille Emperor Limited
5 (14)
矩阵箭头指标 MT5   是一种独特的 10 合 1 趋势,遵循   100% 非重绘多时间框架指标 ,可用于所有符号/工具: 外汇 、 商品 、 加密货币 、 指数 、 股票 。 Matrix Arrow Indicator MT5 将在其早期阶段确定当前趋势,从多达 10 个标准指标中收集信息和数据,它们是: 平均定向运动指数 (ADX) 商品渠道指数 (CCI) 经典 Heiken Ashi 蜡烛 移动平均线 移动平均收敛散度 (MACD) 相对活力指数 (RVI) 相对强弱指数 (RSI) 抛物线SAR 随机振荡器 威廉姆斯的百分比范围 当所有指标给出有效的买入或卖出信号时,相应的箭头将打印在图表上,在下一根蜡烛/柱线开盘时,指示强劲的上升趋势/下降趋势。用户可以选择使用哪些指标,并可以单独调整每个指标的参数。 Matrix Arrow Indicator MT5 仅从选定的指标中收集信息,并仅根据其数据打印箭头。   Matrix Arrow Indicator MT5   还可以为所有新信号发送终端、推送通知或电子邮件警报。无论您是黄牛、日内交易者还是波段交易者, Mat
Legacy of Gann for MT5
Pavel Zamoshnikov
5 (6)
The indicator very accurately determines the levels of the possible end of the trend and profit fixing. The method of determining levels is based on the ideas of W.D.Gann, using an algorithm developed by his follower Kirill Borovsky. Extremely high reliability of reaching levels (according to K. Borovsky  - 80-90%) Indispensable for any trading strategy – every trader needs to determine the exit point from the market! Precisely determines targets on any timeframes and any instruments (forex, met
Bill Williams Advanced
Siarhei Vashchylka
5 (7)
Bill Williams Advanced is designed for automatic chart analysis using Bill Williams' "Profitunity" system. The indicator analyzes four timeframes at once. Manual (Be sure to read before purchasing) Advantages 1. Automatically analyzes the chart using the "Profitunity" system of Bill Williams. The found signals are placed in a table in the corner of the screen. 2. Equipped with a trend filter based on the Alligator indicator. Most of the system signals are recommended to be used only accordi
该仪表盘显示所选符号的最新可用谐波形态,因此您可以节省时间并提高效率 /  MT4 版本 。 免费指标:  Basic Harmonic Pattern 指标列 Symbol:   显示所选符号 Trend:     看涨或看跌 Pattern:    形态类型(Gartley、蝴蝶、蝙蝠、螃蟹、鲨鱼、Cypher 或 ABCD) Entry:     入口价格 SL: 止损价 TP1: 第一止盈价 TP2: 第二次获利价格 TP3: 第三次获利价格 Current price:    当前价格 Age (in bars):   最后绘制的模式的年龄 主要输入 Symbols :   从 "28 种主要货币对 "或 "选定符号 "中选择。 Selected Symbols :   希望监控的符号,用逗号分隔("EURUSD,GBPUSD,XAUUSD")。如果您的经纪商为货币对设置了后缀或前缀,您必须在以下两个参数中添加(货币对前缀或货币对后缀)。 Max Iteration:   调整模式的最大迭代次数(如果该值越小,则模式越少,性能越快;如果该值越大,则模式越多,性能
Easy Buy Sell Signal Alert
Franck Martin
4.86 (7)
Easy By Sell is a market indicator for opening and closing positions. It becomes easy to track market entries with alerts. It indicates trend reversal points when a price reaches extreme values ​​and the most favorable time to enter the market. it is as effective as a Fibonacci to find a level but it uses different tools such as an algorithm based on ATR indicators and Stochastic Oscillator. You can modify these two parameters as you wish to adapt the settings to the desired period. My othe
介绍     Quantum Breakout PRO   ,突破性的 MQL5 指标,正在改变您交易突破区域的方式!由拥有超过13年交易经验的资深交易员团队开发,     量子突破 PRO     旨在通过其创新和动态的突破区域策略将您的交易之旅推向新的高度。 量子突破指标将为您提供带有 5 个利润目标区域的突破区域的信号箭头,以及基于突破框的止损建议。 它既适合新手交易者,也适合专业交易者。 量子 EA 通道:       点击这里 重要的!购买后请私信我领取安装手册。 建议: 时间范围:M15 货币对:GBPJPY、EURJPY、USDJPY、NZDUSD、XAUUSD 账户类型:ECN、Raw 或 Razor,点差极低 经纪商时间:GMT +3 经纪商:IC Markets、Pepperstone with Raw 和 Razor 的点差最低 规格: 不重漆! 最多 5 个建议利润目标区域 建议止损水平 可定制的盒子。您可以设置自己的 Box Time Start 和 Box Time End。 接触 如果您有任何疑问或需要帮
Volume by Price MT5
Brian Collard
5 (4)
The Volumebyprice.com Indicator for MetaTrader 5 features Volume Profile and Market Profile TPO (Time Price Opportunity). Volume and TPO histogram bar and line charts. Volume Footprint charts. TPO letter and block marker collapsed and split structure charts. Session filtering and grouping. Static, dynamic and flexible range segmentation and compositing methods with relative and absolute visualizations. Graphical layering, positioning and styling options to suit the user's analytic and aesthetic
Dark Absolute Trend MT5
Marco Solito
5 (11)
Dark Absolute Trend   is an Indicator for intraday trading. This Indicator is based on   Trend Following  strategy but use also candlestick patterns and Volatility. We can enter in good price with this Indicator, in order to follow the main trend on the current instrument. It is advised to use low spread ECN brokers. This Indicator does   Not repaint   and   N ot lag . Recommended timeframes are M5, M15 and H1. Recommended working pairs: All. I nstallation and  Update Guide   -  Troubleshooting
Gartley Hunter Multi
Siarhei Vashchylka
5 (7)
Gartley Hunter Multi - An indicator for searching for harmonic patterns simultaneously on dozens of trading instruments and on all possible timeframes. Manual (Be sure to read before purchasing) | Version for MT4 Advantages 1. Patterns: Gartley, Butterfly, Shark, Crab. Bat, Alternate Bat, Deep Crab, Cypher 2. Simultaneous search for patterns on dozens of trading instruments and on all possible timeframes 3. Search for patterns of all possible sizes. From the smallest to the largest 4. A
Auto Order Block with break of structure based on ICT and Smart Money Concepts (SMC) Futures Break of Structure ( BoS )             Order block ( OB )            Higher time frame Order block / Point of Interest ( POI )    shown on current chart           Fair value Gap ( FVG ) / Imbalance   -  MTF      ( Multi Time Frame )    HH/LL/HL/LH  -  MTF      ( Multi Time Frame )  Choch  MTF      ( Multi Time Frame )  Volume Imbalance     ,  MTF          vIMB Gap’s Power of 3 Equal High
作者的更多信息
NakaSide
Ricardo De Andrade Nakano
介绍NakaSide - 您的终极市场机会指标! 您是否厌倦了错过盈利的交易机会?您是否准备将交易提升到新的水平?不用再找了,因为NakaSide已经出现,将彻底改变您的交易方式! NakaSide不仅仅是又一个普通的指标;它是您在复杂的金融市场中自信而准确导航的秘密武器。凭借其先进的算法和尖端技术,NakaSide旨在检测趋势变化,并在看涨和看跌市场中发现有利可图的机会。 当NakaSide检测到向上趋势转变时,它会以鲜艳的绿色美元符号发出信号,表明可能的购买机会。相反,如果趋势反转,将出现引人注目的红色美元符号,表明可能的卖出机会。 但这就是NakaSide真正脱颖而出的地方:它不仅仅停留在识别趋势上。在侧向市场中,其他人可能会遇到困难的地方,NakaSide表现得最出色,将多个美元符号散布在整个图表上,表明了多个潜在的入场点。这意味着您有更多的机会利用市场波动,无论是上升、下降还是横盘趋势! 但这还不是全部-NakaSide还允许您通过手动输入订单来灵活控制您的交易。无论您是执行买入还是卖出订单,只需按照指示-绿色表示买入,红色表示卖出-并抓住进入市场的时机
NakaTrendBot
Ricardo De Andrade Nakano
介绍NakaTrendBot-您的终极趋势交易伙伴! 您是否厌倦了在市场变动时错失机会?不要再寻找了,NakaTrendBot就在这里,是您在动态交易趋势世界中信赖的盟友。 NakaTrendBot不仅仅是一个机器人;它是一个精密的算法强大器,设计用于精确检测趋势变化和整合。利用先进的机器学习算法和高级技术分析,NakaTrendBot不断扫描市场,以发现情绪和价格行动的微妙变化,使您能够保持领先并利用新兴趋势。 当NakaTrendBot感知到市场趋势变化时,它会迅速调整策略,确保您始终处于能够利用新方向的位置。无论市场是牛市、熊市还是整理市,NakaTrendBot都能够适应并在任何市场条件下蓬勃发展。 但这还不是全部-在整理期间,NakaTrendBot调整其方法以利用短期机会,即使市场安静时也最大限度地提高您的潜在收益。通过智能地管理风险和策略性地进出交易,NakaTrendBot帮助您以信心和精确性驾驭市场。 然而,记住风险管理的重要性是至关重要的。尽管NakaTrendBot可以提供宝贵的见解并精确执行交易,但最终,您需要确保您有效地管理风险并坚持纪律
NakaSideBot
Ricardo De Andrade Nakano
介绍NakaSideBot - 您的终极侧向市场冠军! 当市场变化方向时,您是否已经厌倦了错失利润?NakaSideBot是您的终极侧向市场冠军!这款先进的机器人旨在在不断变化的市场环境中蓬勃发展,适用于趋势和横向市场。 NakaSideBot在市场转变或巩固时表现出色,抓住其他人可能忽视的机会。凭借其先进的算法,它能够及早发现趋势变化并迅速适应,确保您始终处于领先地位。无论市场是看涨、看跌还是巩固,NakaSideBot都是您在任何市场环境中最大化利润的秘密武器。 但这还不是全部 - NakaSideBot是您的风险管理盟友。我们理解保护资本的重要性,这就是为什么NakaSideBot包含智能风险管理功能,帮助您放心交易。 NakaSideBot的特色在于其在横向市场上的出色表现。在其他机器人可能在动荡的条件下遇到困难时,NakaSideBot可以蓬勃发展,利用每一个利润的机会。它轻松驾驭横向市场的能力确保您永远不会错过潜在的收益。 而在趋势市场上,NakaSideBot更是闪耀夺目。凭借其精确的进出信号,NakaSideBot始终实现令人印象深刻的结果,帮助您
筛选:
fanakano
14
fanakano 2024.04.10 17:05 
 

用户没有留下任何评级信息

回复评论
版本 1.3 2024.04.07
Adjusted the $ position and added the function to clear the graph when removing the indicator.
版本 1.1 2024.04.07
Fixed the bug it was not calculating old bars