• 概述
  • 评论 (1)
  • 评论 (1)
  • 新特性

AI Powered Price Clustering

UPDATED VERSION INCORPERATES FIBONACCI FOR BETTER LEVELS

AI Powered Price Clustering" is a custom indicator that integrates k means and Fibonacci. This powerful tool provides traders with valuable insights into price clustering patterns, facilitating more informed trading decisions.

How it works:

With "AI Powered Price Clustering," traders gain access to:

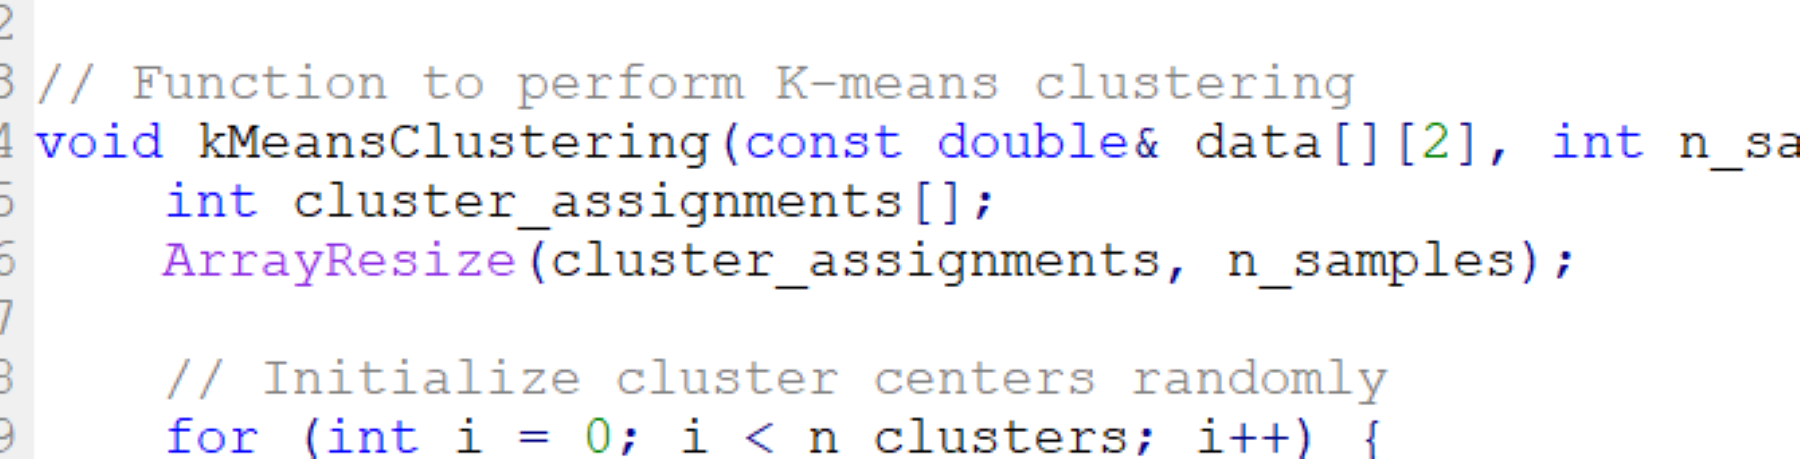
  • A K means algorithm for precise analysis of price clustering patterns.
  • Identification of key Fibonacci levels and centroids for enhanced technical analysis.
  • Real-time updates and multi-timeframe analysis capabilities.
  • Customization options to tailor the indicator to individual preferences and trading styles.
  • Seamless integration with the MetaTrader 4 platform, ensuring a familiar and user-friendly experience.

Technical Description:

  1. Data Collection and Preprocessing:

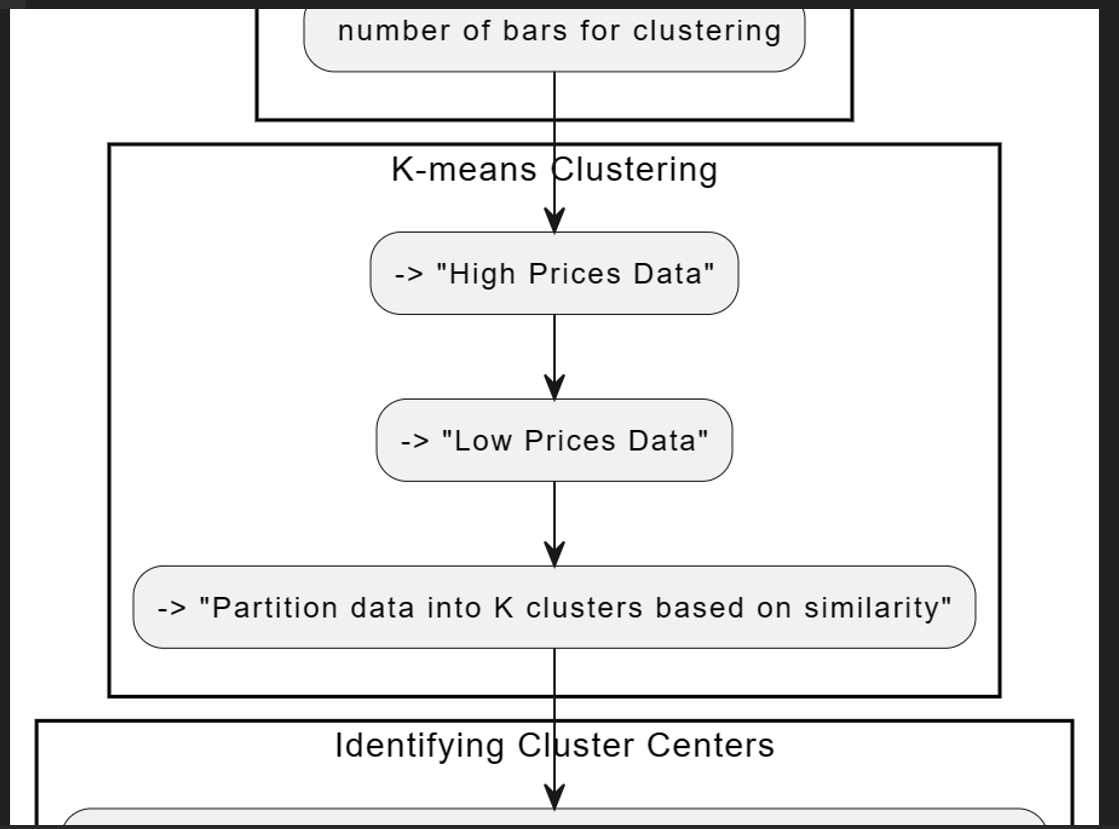
    • The indicator collects historical price data, including open, high, low, and close prices, from MetaTrader 4.
    • It preprocesses the data, extracting relevant features and transforming it into a suitable format for AI analysis.
  2. Clustering Analysis:

    • Utilizes AI clustering algorithms to identify patterns of clustered price levels.
    • Groups data points based on similarity metrics to determine clusters.
  3. Fibonacci Levels and Centroids Calculation:

    • Calculates Fibonacci levels based on the time frame price data.
    • Determines central price
    • Computes next level Fibonacci levels
    • Calculates centroids for clustering analysis based on selected Fibonacci levels.
  4. Visualization and Real-Time Updates:

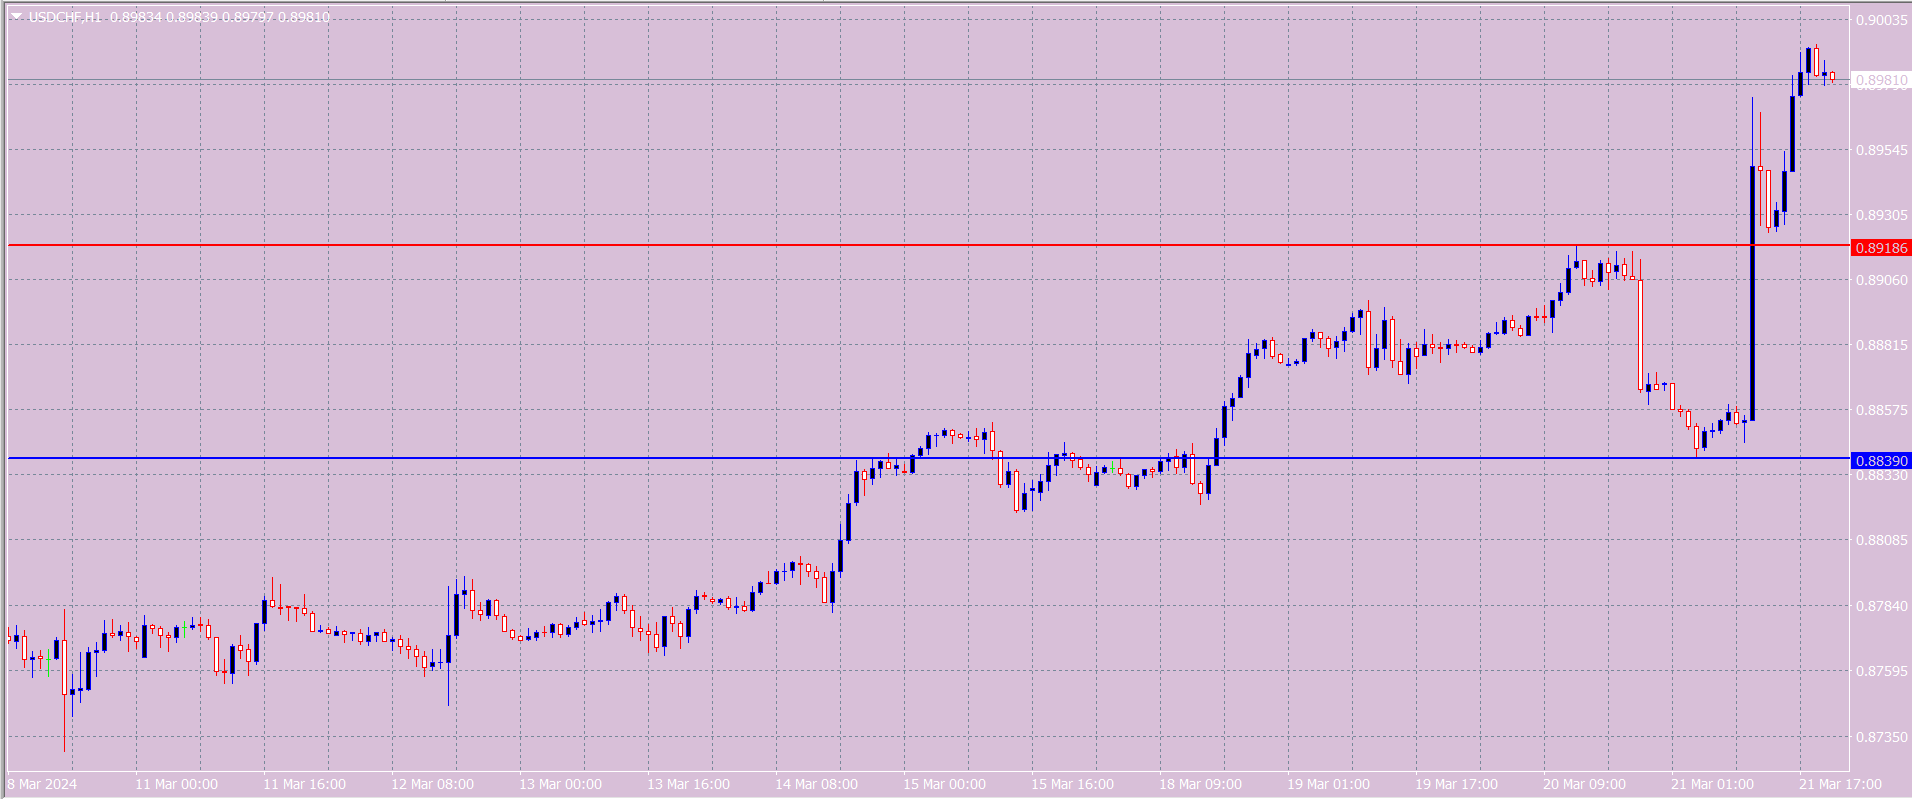
    • Visualizes identified clusters and centroids on the price chart, with clusters represented as horizontal lines.
    • Continuously monitors market data, providing real-time updates to ensure accurate analysis.

How to Use:

  1. Analysis:

    • Analyze price clustering patterns and Fibonacci levels displayed on the price chart.
    • Use identified centroids as reference points for technical analysis and trading decisions.

Overall, "AI Powered Price Clustering" empowers traders with cutting-edge AI technology, facilitating comprehensive analysis of price clustering patterns and Fibonacci levels for enhanced trading strategies.


推荐产品
Ugenesys AI MT4
Odaine Ramon Mcmillan
5 (1)
uGenesys AI - 90% Accurate Daytrading Indicator Introducing the ultimate forex trading indicator system, uGenesys AI, powered by cutting-edge AI technology and advanced analytical techniques, including Time-Series Analysis and Genetic Algorithms. Our AI-powered trading system leverages the power of time-series analysis to identify trends and patterns in historical price data, allowing traders to make informed predictions about future market movements. By analyzing vast amounts of data, our sys
Details of each condition Type 1. Set no use Hedging Martingale, to open the order by yourself only through the push button. TP and SL follow setting. Set Setting_Hedging =false; Set Setting_TrailingStop =false; if not use. Type 2. Semi Auto Recovery Zone You have to open the order by yourself only through the push button. If in the wrong direction and Set true on Hedging Martingale, EA will fix the order with the zone system by use Hedging Martingale Set Setting_Hedging =true; Set Setting_T
Details of each condition Type 1. Set no use Hedging Martingale, to open the order by yourself only through the push button. TP and SL follow setting. Set Setting_Hedging =false;     Use_Signal =false;  Type 2. Semi Auto Recovery Zone You have to open the order by yourself only through the push button. If in the wrong direction and Set true on Hedging Martingale, EA will fix the order with the zone system by use Hedging Martingale Set Setting_Hedging =true;     Use_Signal =false;  Type 3. Us
Hello Guys! I want to share with you a very useful tools. Anyone of us who has used MT4 for some time knows how impractical this platform can be for discretionary trading. That's why I created this graphical interface!  Interface is very simple, all the info that you need are in the video and in the screenshot. NB: Before to run the EA Interface, remember to copy the file in the comment in your MT4 folder "Controls". PATH: .../MQL4/INCLUDE/CONTROLS NB: unfortunately the interface can't be t
XFlow4
Maxim Kuznetsov
XFlow shows an expanding price channel that helps determine the trend and the moments of its reversal. It is also used when accompanying transactions to set take profit/stop loss and averages. It has practically no parameters and is very easy to use - just specify an important moment in the history for you and the indicator will calculate the price channel. DISPLAYED LINES ROTATE - a thick solid line. The center of the general price rotation. The price makes wide cyclical movements around the
Description of the Expert Advisor: You can trade with any strategies and any Expert Advisors, but there comes a time when trading comes to a standstill. All dogmas and rules are violated and you do not know what to do next. My hands drop and I want to take a break, but there are several thousand dollars at stake, which is so insulting to leave to the mercy of fate. You can of course just put a lock, go on vacation and then calmly sort everything out, and you can entrust all this to the advise
MagicSignals EA
Ola Said Abd Elghafar
MagicSignals EA is a fully automated Expert Advisor . It uses smart algorithms to open any trade.Also this system come with very smart Money Management code and not like other Expert Advisor with this ea you will cant use fixed lot to trade. You must use the very smart Money Management system inside this ea to open any trade, you will need only to put your risk and the system will do all other job for you. And if you put zero in the risk setting the system will open the small lot that can make t
NO REPAINT ADVANCED CHART PATTERN INDICATOR By definition, a price ( chart)  pattern is a recognizable configuration of price movement that is identified using a series of  trendlines  and/or curves. When a price pattern signals a change in trend direction, it is known as a reversal pattern; a continuation pattern occurs when the trend continues in its existing direction following a brief pause. Advanced Chart Pattern Tracker is designed to find the MOST ACCURATE patterns. A special script is
Psy Levels
THE FWA COMPANY
This free MT4 indicator allows you to automatically display psychological price levels on your chart It's very powerful when you combine it with other tools such as Fibs levels, Supports & Resistance levels, Moving Averages, Wyckoff schematics, etc. For example, you can use this indi to display horizontal levels every 100 points on your GER40 chart, or 500 points on your BTC chart, etc. ***Please comment, rate and share it to your friends if you like it***
FREE
Market Noise 市場噪音是確定價格圖表上的市場階段的指標,並且還可以在累積或派發階段發生時區分清晰平滑的趨勢運動和嘈雜的平坦運動。 每個階段都適合自己的交易類型:趨勢適合趨勢追蹤系統,平坦適合激進型交易。 當市場噪音開始時,您可以決定退出交易。 同樣,反之亦然,一旦噪音結束,您就需要關閉激進的交易系統。 有人可以使用兩種類型的交易策略進行交易,從一種策略切換到另一種策略。 因此,該指標在交易決策領域中扮演了好助手的角色。 任何價格變動都可以分為兩個部分 - 選定時間段內的總體價格變動以及該時間段內以價格波動形式出現的噪音。 同時,不同時期的不同市場可以表現出噪音和趨勢成分之間廣泛的相互關係(圖1)。 價格變動的噪音水平越高,辨別潛在趨勢的方向和強度就越困難。 因此,在這種情況下有必要使用較慢的趨勢識別方法。 另一方面,在低噪音水平的市場中,主要趨勢很容易確定,並且更快的確定趨勢的方法是合理的,確保價格方向變化的交易訊號的滯後最小。 為了確定市場狀態,使用高級效率比 (ER),該比率基於特定時期內總價格變動與噪音市場變動總和的指數比較。效率比 (ER) 可以變化從0到1。
Flip Flops
Tatiana Savkevych
The Flip Flop indicator tracks market trends, ignoring sharp fluctuations and market noise. The indicator can work both for entry points and as a filter. The Flip Flop indicator displays information in a visual way. Helps in finding entry points during analysis. Suitable for trading on small time frames because it ignores sudden price spikes or corrections in price movements by reducing market noise around the average price.
FIBO Price Calculator 功能简介 1. 自动绘制斐波那契回调线 本指标可自动在MT4图表上绘制斐波那契回调线,助您快速识别潜在支撑和阻力位。 2. 自定义斐波那契数列 用户可自定义斐波那契数列的数值,指标会根据当前市场价格自动换算成相应价格水平。 3. 灵活调整指标窗位置 指标窗可放置在图表的四个角中的任意位置,方便用户根据个人喜好和交易习惯调整布局。 综上所述,本指标不仅能够帮助交易者自动绘制斐波那契回调线,还提供了自定义输入斐波那契黄金数列换算成价格以及自定义指标窗位置的功能,为交易者提供了更便捷、更灵活的技术分析工具。无论是初学者还是经验丰富的交易者,都能够通过本指标更好地把握市场趋势,提高交易成功率。
Volume by Price MT4
Brian Collard
4.64 (11)
The Volume by Price Indicator for MetaTrader 4 features Volume Profile and Market Profile TPO (Time Price Opportunity). Volume and TPO histogram bar and line charts. Volume Footprint charts. TPO letter and block marker collapsed and split structure charts. Static, dynamic and flexible range segmentation and compositing methods with relative and absolute visualizations. Session hours filtering and segment concatenation with Market Watch and custom user specifications. Graphical layering, positio
PZ Fibonacci
PZ TRADING SLU
Are you tired of plotting fibonacci retracements or extensions manually? This indicator displays fibonacci retracements or extensions automatically, calculated from two different price points, without human intervention or manual object anchoring.  [ Installation Guide | Update Guide | Troubleshooting | FAQ | All Products ] Easy to use Manual anchoring is not needed Perfect for price confluence studies The indicator evaluates if retracements or extensions are needed Once drawn, you can manually
The Arrow Scalper
Fawwaz Abdulmantaser Salim Albaker
1 (2)
Dear Friend..  I share with you this simple Expert Adviser .. it is full automatic  this Expert Adviser following the trend of the pair you install on or any stocks or indices , it is works like that: - when the trend on H4 chart show a start of up trend the expert will wait till the 15M & 1H charts show an up trend the EA will open a buy order directly , and do the same for down trend and open a sell order the buy or sell  order lot size and take profit and stop loss will measured manually  by
FREE
The Best One Scalping Trade Panel functional manual trade panel with risk reward, auto SL by candle ( original solution), lot size calculation, one-click trading, scale in and out of trades (partial close),  Works with all symbols not just currency pairs, perfect works on DAX, NASDAQ, GOLD, ...... I earn every day during live stream on ZakopiecFX - join Me Risk by lot Risk by percent SL by points SL by Candle, Renko, RangeBar ( original solution) TP by point TP by Risk/Reward Auto Trailing b
Koala Fibo Base Time
Ashkan Hazegh Nikrou
3 (1)
欢迎来到考拉菲波基地时间     欢迎来到考拉菲波时区     欢迎来到考拉斐波时间延长     欢迎使用Meta Trade错过的工具! 简单介绍: 斐波那契时区是基于斐波那契序列的垂直线。这些线沿X轴(日期轴)延伸,作为一种机制,可根据经过的时间预测逆转。 通常将主要的低点或高点作为起点。距离开始较小,并且随着斐波那契数列的扩展而增加。 图表专家可以将斐波纳契时区扩展到未来,以预测潜在的反转点。 您可以通过Google搜索“ Fibo Base Time,Fibo时区,Fibo Time Extension”按这些名称找到该指标 基本定义为更多信息:     斐波那契时区是垂直线,代表潜在的区域,在该区域中可能会出现高,低或反转的趋势。     斐波那契时区可能并不表示确切的反转点。它们是需要注意的基于时间的区域。     斐波那契时区仅表示与时间相关的潜在重要区域。不考虑价格。该区域可能标记为次要的高或低,或显着的高或低。     斐波那契时区基于斐波那契数列,这给了我们黄金分割率。在整个自然和建筑中都可以找到这个比例。
FREE
在弱波动通道中交易的自动黄牛。该策略的本质是根据货币对的历史分析寻找趋势偏差和波动率的异常波动。自适应算法用于跟踪和打开交易。 机器人不使用高风险策略,例如:无鞅、使用订单网格进行交易、不执行交易、没有最低止损水平。 工作时间:   M1 工作货币对:   AUDCAD, AUDCHF, AUDJPY, AUDNZD, AUDSGD, AUDUSD, CADCHF, CADJPY, CHFJPY, EURAUD, EURCAD, EURCHF, EURGBP, EURJPY, EURNZD, EURSGD, EURUSD, GBPAUD, GBPCAD, GBPYCCADY, GBPNZHF, NZDC , NZDJPY, NZDUSD, USDCAD, USDCHF, USDJPY, USDSGD。 开发商公司官网,可以在这里找到     MQL5 配置文件 欢迎来到我们的公共频道     MQL5 通道 我们的其他产品     华科科技 建议 确保为代理服务器使用具有最小网络延迟的 VPS 或服务器。 使用最低点差和最低佣金的经纪商。 在真实账户上使用它之前,请用您需要的批次进
Program Overview: This program is a trading tool designed to monitor and analyze the 7 major currency pairs. It is a variant of a similar program used for tracking stock indices, but this version focuses on the seven major currency pairs. The program helps in identifying and calculating significant price movements (gaps) between the high and low prices of these currency pairs over a specified time frame. It then provides insights through comments and alerts based on the calculated gaps. Major Cu
Hot Zones
Innovicient Limited
This indicator simplifies your entry zones by displaying the areas where you can plan your entry that potentially could give you high risk/reward ratios. Other than picking the most optimal entry points, the Hot Zone indicator can act as your typical support/resistance indicator for pullbacks for all timeframes. You can use this indicator as the only trading indicator or use it with another indicator for reentry purposes.  Besides, when using Hot Zones, the risk/reward ratio should be well abov
Broom Mt4
Marta Gonzalez
When the market breaks the glass ceiling someone has to use the   broom   and pick up the glass from the floor. Broom   is the system that detects this break and collects the crystals. Being a very aggressive scalping system, it should only be used in pairs with a low spread and low commissions. This system is suitable for small accounts and can be used with only  $ 100. You can download the demo and test it yourself.   Very stable growth curve as result of smart averaging technique
Leo Fibonacci
Dmitriy Zaytsev
The indicator is designed for determining Fibonacci levels. Does not repaint/redraw The blue level shows the zero Fibonacci value (it is also the Pivot level) Red levels show calculated Fibonacci levels (used as a rollback or reversal point) Automatic period detection (periods can be entered manually) Adjustable display calculation method. Settings BarsHistory - the number of bars to be used to display the indicator. Method - method of calculation. AutoPeriod - automated period calculation (true
Profile Map
Dmitriy Sapegin
5 (11)
Market Profile helps the trader to identify the behavior if major market players and define zones of their interest. The key feature is the clear graphical display of the range of price action, in which 70% of the trades were performed. Understanding of the location of volume accumulation areas can help traders increase the probability of success. The tool can be used as an independent system as well as in combination with other indicators and trading systems. this indicator is designed to suit
Key level wedge pro
Presley Annais Tatenda Meck
5 (1)
We have combined all of our beloved indicators the likes of: Key level order block , Key level supply and demand , Key level liquidity grab and Key level wedge into one single indicator and dashboard. Whats new Dashboard : There is an easy access dashboard for all your needs. Multi-timeframe button : There is now a multi-timeframe option for Order Blocks and Supply and demand zones, making it easy to see higher timeframe zones easily on the current timeframe by just clicking the desired timefr
Colored Market Hours
Mohamed Amine Talbi
5 (1)
As the title says, this is an indicator that shows the current open market (session). It has 4 sessions with customizable schedule : 1. London session, 2. New York session, 3. Sydney session, 4. Tokyo session. Indicator inputs: - The color of each session. - The open time and close time of the sessions. - The line width. The objective of the indicator, is to follow each sessions, observe at what times are multiple sessions open, and thus take the chance of the high market movements.
FREE
This indicator will draw Support and Resistance lines calculated on the nBars distance. The Fibonacci lines will appear between those 2 lines and 3 levels above or under 100%. You may change the value of each level and hide one line inside 0-100% range and all levels above or under 100%. Input Parameters: nBars = 24; - amount of bars where the calculation of Support and Resistance will be done. Fibo = true; if false then only Support and Resistance will be shown. Level_1 = true; - display of t
To download MT5 version please click  here . This is the exact conversion from TradingView: "WaveTrend [LazyBear]" By "zeusuk3". One of the coolest indicators out there to detect overbought and oversold zones. It can be used as a part of more complicated strategy and for confirming a potential trade setup. There are buffers to use in EAs also. The indicator is loaded light and non-repaint. - You can message in private chat for further changes you need. Thanks for downloading 
Impulse fractals indicator - is counter-trend oriented complex market fractal pattern.  Market creates bull/bear impulse, trend starts, fractals on impulsed wave are an agressive pullback signals. Buy arrow is plotted when market is bearish and it's impulse showed up-side fractal, and sell arrow is plotted when market is bullish and it's impulse showed dn-side fractal. Main indicator's adjustable inputs : impulsePeriod - main period of impulse histogram  filterPeriod  - smoothes impulse accordi
我们的 Basic Support and Resistance 指示器是提高技术分析所需的解决方案。该指标允许您在图表/ MT5版本 功能 斐波那契水平的集成: 可以选择显示斐波那契水平以及支持和阻力水平,我们的指标使您对市场行为和可能的逆转区域有更深入的了解。 性能优化: 只能在每个栏的打开时更新扩展线,我们的指标可确保最佳性能,而无需牺牲支持和阻力级别的准确性。 输入 主设置 Timeframe:   通过此输入,您可以选择在图表上显示较高时间范围的支撑线和阻力线。 Support/Resistance Strength [Number of Bars]:  使用此输入,您可以确定支撑和电阻的强度。数量越高,支持/阻力越强。 Price mode: 此参数允许您选择哪种价格将用于计算支持和电阻水平。它可以是收盘价,最高价格,最低价格等。取决于您的策略和偏好,您可以选择最适合您需求的价格。 显示设置 Display Fibonacci levels: 此参数确定是否将显示斐波那契水平以及图表上的支持和电阻级别。斐波那契水平是技术分析中使用的关键水平,并使用斐波那契序
该产品的买家也购买
Gann Made Easy
Oleg Rodin
4.86 (83)
Gann Made Easy 是一个专业且易于使用的外汇交易系统,它基于使用先生理论的最佳交易原则。 W.D.江恩。该指标提供准确的买入和卖出信号,包括止损和获利水平。您甚至可以使用推送通知在旅途中进行交易。 购买后请联系我!我将免费与您分享我的交易技巧和丰厚的红利指标! 您可能已经多次听说过江恩交易方法。通常 Gann 的理论不仅对于新手交易者而且对于那些已经有一定交易经验的人来说都是非常复杂的东西。这是因为江恩的交易方法在理论上并不那么容易应用。我花了几年时间来完善这些知识,并将最好的原则应用到我的外汇指标中。 该指标非常易于应用。您所需要的只是将其附加到您的图表并遵循简单的交易建议。该指标不断进行市场分析工作并寻找交易机会。当它检测到一个好的入口点时,它会为您提供一个箭头信号。该指标还显示止损和获利水平。 换句话说,当您像先生一样进行交易时,该指标会为您提供最佳江恩建议。江恩亲自告诉你此时此刻该做什么。但最好的部分是您不需要了解任何有关江恩交易原则的知识,因为该指标会为您完成整个市场分析工作。
- Real price is 80$ - 40% Discount ( It is 49$ now ) Contact me for instruction, add group and any questions! Related Products:  Bitcoin Expert , Gold Expert Introduction The breakout and retest strategy is traded support and resistance levels. it involves price breaking through a previous level.  The break and retest strategy is designed to help traders do two main things, the first is to avoid false breakouts. Many false breakouts start with a candlestick that breaks out of a level but ends w
FX Volume
Daniel Stein
4.58 (33)
通过 mql5 和 Telegram 上 的 " 晨间简报 "获取每日市场更新,包括详细信息和屏幕截图 ! 外汇交易量(FX Volume)是第一个也是唯一一个从经纪商角度真正洞察市场情绪的交易量指标。 直接在您的图表上看到这些信息是真正改变游戏规则和突破性的交易解决方案。 受益于独特的市场数据洞察,如 比率(Ratios )显示货币多头和空头头寸的比率(百分比 比率变化 显示所选时间段内的多头比率及其百分比变化 总交易量 显示货币的总交易量(多头和空头),以手为单位 多头 交易量显示货币所有多头头寸的交易量 空头 交易量显示所有货币空头头寸的交易量 净多头 显示净多头交易量,即所有多头头寸减去所有空头头寸(以手为单位)。 净多头百分比 显示货币净多头交易量的变化 请阅读我们的基本教程 -> "如何使用外汇交易量进行交易 " 获取更多信息,如常见问题、交易技巧和教程视频,请访问我们的 外汇交易量公共信息频道 请 安装并运行 SI Connect 以建立与我们数据中心的持续连接 背景信息 我们都知道,外汇是一个分散的市场。这就是为什么我们必须打破常规思维,开发一个独
Enigmera
Ivan Stefanov
5 (3)
ENIGMERA:市场核心 https://www.enigmera.com 简介 该指标和交易系统是金融市场的一种非凡方法。ENIGMERA 利用分形周期精确计算支撑位和阻力位。它能显示真实的累积阶段,并给出方向和目标。 该系统无论在趋势中还是在修正中都能发挥作用。 它是如何运行的? ENIGMERA 由三条线组成:支撑/阻力线、目标线和偏离线。与一般市场指标将过去的数据推断为现在和未来的情况不同,该系统能提供当前的完整情况。如果你处于支撑位,这意味着真正的支撑;如果你处于阻力位,这意味着真正的阻力。如果突破某一水平,则表示趋势发生变化。没有重绘。 由于市场在不断变化,ENIGMERA 不断调整其评估工具,定期修改策略。  这保证了每种情况都能得到全面评估。这一市场指标的独特性显而易见,其能力不言而喻。  ENIGMERA 为金融分析师和咨询师提供服务,他们需要可靠的见解与客户分享,也为投资者提供服务,他们需要最精确和最可靠的保证。 该系统能够达到最佳精度,使交易者能够自信、清晰地评估他们的选择。 ENIGMERA 将 20 年的交易专长和知识整合到一个综合软件
Gold Stuff
Vasiliy Strukov
4.89 (241)
Gold Stuff 是专为黄金设计的趋势指标,也可用于任何金融工具。 该指标不会重绘,也不会滞后。 推荐时间框架 H1。 在它指标工作全自动专家顾问 EA Gold Stuff。 你可以在我的个人资料中找到它。 重要! 购买后立即与我联系,以获得说明和奖金!   您可以免费收到我们的强力支持和趋势扫描指标的副本,请私信。大部头书! 购买后立即联系我以获得设置和个人奖励!   设置 绘制箭头 - 打开关闭。 在图表上绘制箭头。 警报 - 打开关闭声音警报。 电子邮件通知 - 打开关闭。 电子邮件通知。 Puch-notification - 打开关闭。 推送通知。 接下来,调整色域。 Gold Stuff 是专为黄金设计的趋势指标,也可用于任何金融工具。 该指标不会重绘,也不会滞后。 推荐时间框架 H1。 在它指标工作全自动专家顾问 EA Gold Stuff。 你可以在我的个人资料中找到它。 购买后立即联系我以获得设置和个人奖励!   设置 绘制箭头 - 打开关闭。 在图表上绘制箭头。 警报 - 打开关闭声音警报。 电子邮件通知 - 打开关闭。 电子邮件通
Atomic Analyst
Issam Kassas
5 (2)
首先值得强调的是,该交易指标是非重绘、非延迟的指标,这使其成为手动和机器人交易的理想选择。 用户手册:设置、输入和策略。 Atomic Analyst是一种PA价格行动指标,利用价格的力量和动量来寻找市场上更好的机会。配备了高级过滤器,可帮助去除噪音和假信号,并提高交易潜力。使用多层复杂的指标,Atomic Analyst扫描图表,并将复杂的数学计算转化为任何初学者都能理解并用来做出一致交易决策的简单信号和颜色。 “Atomic Analyst”是专为新手和经验丰富的交易者量身定制的综合交易解决方案。它将高级指标和一流功能融合为一体的交易策略,使其成为所有类型交易者的多功能选择。 日内交易和剥头皮策略:专为快速准确的日内交易和短期交易而设计。 日内和摆动交易策略:可用作追求价格大幅波动的日内和摆动交易者的可靠工具。 多货币和市场:凭借其可靠的精度,在不同的工具和市场上运作。 多个时间框架:可在多个时间框架上使用,性能良好。 稳定性:所有指标均不重绘、不重绘和不滞后,确保可靠的信号。 信号清晰度:提供箭头信号,用于清晰的入场和出场点。 实时警报:通过交易入场、SL和TP警报通知交
FX Power MT4 NG
Daniel Stein
5 (13)
通过 mql5 和 Telegram 上 的晨间简报获取每日市场更新,包括详细信息和屏幕截图 ! FX Power MT4 NG 是我们长期以来非常受欢迎的货币强度计算器 FX Power 的下一代产品。 这款下一代强度计算器能提供什么?您所喜爱的原版 FX Power 的所有功能 附加功能 黄金/XAU 强度分析 更精确的计算结果 可单独配置的分析周期 可自定义计算限制,以获得更好的性能 为希望查看更多信息的用户提供特殊的多实例设置 无尽的图形设置,可在每个图表中设置您最喜欢的颜色 无数的通知选项,让您再也不会错过任何重要信息 采用 Windows 11 和 macOS 风格的全新圆角设计 神奇的移动指标面板 FX Power 主要功能 所有主要货币的完整强势历史 所有时间框架内的货币强弱历史 所有经纪商和图表的计算结果完全相同 100% 可靠的实时计算 -> 无重绘 可通过下拉列表选择分析时段 通过自定义模式单独配置分析时段 可在一个图表中使用多个实例 可移动 FX Power 显示屏(通过拖放) 适用于高分辨率 QHD、UHD 和 4K 显示器 自动终端配置 针对平板电脑
Trend Punch
Mohamed Hassan
4.95 (19)
This indicator is unstoppable when combined with our other indicator called  Support & Resistance . After purchase, send us a message and you will get it   for  FREE as a BONUS! Introducing Trend Punch , the revolutionary forex trend indicator that will transform the way you trade! Trend Punch is uniquely designed to provide precise buy and sell arrows during strong market trends, making your trading decisions clearer and more confident. Whether you're trading major currency pairs or exotic sym
Gann Swing Structure
Kirill Borovskii
5 (1)
This indicator is based on the mathematics of the great trader W.D. Ganna. With its help, you can easily find strong levels by analyzing swings to find the optimal entry point. The indicator works on all instruments and all timeframes. The indicator is fully manual and has control buttons. All you need to do is press the NEW button, a segment will appear, which you can place on any movement, swing or even 1 candle that you want to analyze. By placing the segment, press the OK button. A grid (th
Scalper Inside PRO
Alexey Minkov
4.73 (56)
An exclusive indicator that utilizes an innovative algorithm to swiftly and accurately determine the market trend. The indicator automatically calculates opening, closing, and profit levels, providing detailed trading statistics. With these features, you can choose the most appropriate trading instrument for the current market conditions. Additionally, you can easily integrate your own arrow indicators into Scalper Inside Pro to quickly evaluate their statistics and profitability. Scalper Inside
Dynamic Forex28 Navigator
Bernhard Schweigert
5 (1)
Dynamic Forex28 Navigator - 下一代外汇交易工具。 当前 49% 折扣。 Dynamic Forex28 Navigator 是我们长期流行的指标的演变,将三种功能合二为一: 高级货币强度 28 指标 (695 条评论)+ 高级货币 IMPULSE 带警报 (520 条评论)+ CS28 组合信号(奖励)。 有关指标的详细信息 https://www.mql5.com/en/blogs/post/758844 下一代强度指标提供什么? 您喜欢的原始指标的一切,现在通过新功能和更高的精度进行了增强。 主要特点: 专有货币强度公式。  所有时间范围内的平滑和准确的强度线。 非常适合识别趋势和精确进入。 动态市场斐波那契水平(市场斐波那契)。  此指标独有的独特功能。 斐波那契应用于货币强度,而不是价格图表。 适应实时市场活动以获得准确的反转区域。 实时市场动量。  第 9 行显示市场是活跃还是被动。 对于定时交易至关重要。 全面的警报和显示。  每种货币最强的买入和卖出动量。 ​​28 对的双重动量买入和卖出。 超买/超卖警告外部范围
目前八折优惠! 对任何新手或专家交易者来说都是最好的解决方案! 这个仪表板软件适用于28种货币对。它基于我们的两个主要指标(高级货币强度28和高级货币冲动)。它对整个外汇市场提供了一个伟大的概述。它显示高级货币强度值,货币运动速度和28个外汇对在所有(9)时间段的信号。想象一下,当你可以使用图表上的单一指标观察整个市场,以确定趋势和或剥头皮的机会时,你的交易将得到改善 我们已经在这个指标中建立了一些功能,使你更容易识别强势和弱势货币,同时识别和确认潜在的交易。该指标以图形方式显示货币的强势或弱势是增加还是减少,以及它在所有时间段的表现。 增加的新功能是动态市场斐波那契水平,它适应当前的市场条件变化,这是一个已经在我们的高级货币强度28和高级货币冲动指标中使用的成熟的加分项。 在交易时,总是将弱势货币和强势货币配对,这个新指标将帮助你做到这一点。 用户手册:点击这里  https://www.mql5.com/en/blogs/post/708783 特点  显示每个时间段的ACS28和GAP-speed(冲动)的货币强度值。 列:颜色代码以7种颜色
Trend Screener
STE S.S.COMPANY
4.81 (88)
趋势指标,趋势交易和过滤的突破性独特解决方案,所有重要趋势功能都内置在一个工具中! 它是 100% 非重绘多时间框架和多货币指标,可用于所有符号/工具:外汇、商品、加密货币、指数、股票。 限时优惠:支撑和阻力筛选指标仅售 50美元,终身有效。(原价 250 美元)(优惠延长) 趋势筛选器是有效的指标趋势跟踪指标,它在图表中提供带有点的箭头趋势信号。 趋势分析器指标中可用的功能: 1.趋势扫描仪。 2. 具有最大利润分析的趋势线。 3.趋势货币强度计。 4. 带有警报的趋势反转点。 5. 带有警报的强趋势点。 6. 趋势箭头 每日分析示例,每日信号表现...等与我们的趋势筛选指标,可以在这里找到: 点击这里 限时优惠:Trend Screener Indicator 仅售 50 美元且终身可用。原价 125$) 通过访问我们的 MQL5 博客,您可以找到我们所有的高级指标以及分析示例、每日信号表现...等。 : 点击这里 我们的趋势系统由 2 个指标组成: 1. Trend Screener Indicator:显示趋势仪表盘、图表中的趋势线、入场点...等。 2.
TPSproTREND PrO
Roman Podpora
4.79 (19)
TPSpro TREND PRO 是一个趋势指标,可以自动分析市场并提供有关趋势及其每次变化的信息,并给出进入交易的信号而无需重新绘制! 该指标使用每根蜡烛,分别对其进行分析。指不同的脉冲——向上或向下脉冲。货币、加密货币、金属、股票、指数交易的准确切入点! MT5版本                 指标的完整描述   我们建议将其与 指示器 -   RFI LEVELS 一起使用 主要功能: 准确的输入信号,无需渲染! 如果出现信号,它仍然相关!这是与重提指标的一个重要区别,重提指标可以提供信号然后改变信号,这可能导致存款资金的损失。现在您可以以更高的概率和准确度进入市场。还有一个功能是在箭头出现后为蜡烛着色,直到达到目标(止盈)或出现反转信号。 显示止损/获利区域 为了提高搜索切入点时的视觉清晰度,创建了一个模块,该模块最初显示买入/卖出区域,在该区域中搜索进入市场的最佳点。用于处理止损水平的附加智能逻辑有助于随着时间的推移减小其大小,从而降低进入交易(移动 sl)时的初始风险。 显示较高时间范围内的最小值/最大值(MTF 模式) 添加了一项功能,可以显示较高时间间隔的最小
介绍 ON Trade Waves Patterns Harmonic Elliot Wolfe,这是一款高级指标,旨在使用手动和自动方法检测各种市场模式。以下是它的工作原理: 谐波模式: 该指标可以识别出现在您图表上的谐波模式。这些模式对于练习谐波交易理论的交易者非常重要,正如Scott Carney的书《谐波交易第1卷和第2卷》所描述的那样。无论您是手动绘制它们还是依赖自动检测,ON Trade Waves Patterns都可以胜任。 控制面板: 我们配备了一个用户友好的控制面板,它会保存您的图表和时间帧设置,使您可以轻松切换不同配置。您甚至可以最小化它以最大化图表空间。如果您更喜欢使用其他分析工具,只需单击关闭按钮即可隐藏所有指标数据。 模板保存: 当您自定义设置或添加其他指标,如移动平均线或布林带时,该指标会自动保存您的模板。这意味着您可以随时轻松加载您喜欢的设置。 优化显示: 对于Windows 10用户,我们建议调整您的DPI设置以获得高清设备上的最佳屏幕体验。右键单击MetaTrader图标,选择“兼容性”,然后选择“更改高DPI设置”,将其设置为“系统(增强)”。
Scalper Vault
Oleg Rodin
5 (27)
Scalper Vault 是一个专业的剥头皮系统,为您提供成功剥头皮所需的一切。该指标是一个完整的交易系统,可供外汇和二元期权交易者使用。推荐的时间范围是 M5。 该系统为您提供趋势方向的准确箭头信号。它还为您提供顶部和底部信号以及江恩市场水平。无论您拥有何种交易经验,该系统都易于使用。您只需要遵循简单的规则并每天重复该过程。 建议将此系统用于主要货币对。感谢您的关注! 请注意,该指标在策略测试器中可能无法正常工作。因此,我建议仅在模拟或真实账户的真实交易条件下使用该系统。 指示器提供所有类型的警报,包括推送通知。 购买指标后请与我联系。我将免费与您分享我的个人交易建议和出色的奖励指标! 祝您交易愉快,盈利!
TPA True Price Action indicator reveals the true price action of the market makers through 100% non-repainting signals (except early signals mode) strictly at the close of a candle! TPA shows entries and re-entries, every time the bulls are definitely stronger than the bears and vice versa. Not to confuse with red/green candles. The shift of power gets confirmed at the earliest stage and is ONE exit strategy of several. There are available now two free parts of the TPA User Guide for our custo
Stratos Pali
Michela Russo
5 (1)
Stratos Pali Indicator   is a revolutionary tool designed to enhance your trading strategy by accurately identifying market trends. This sophisticated indicator uses a unique algorithm to generate a complete histogram, which records when the trend is Long or Short. When a trend reversal occurs, an arrow appears, indicating the new direction of the trend. Important Information Revealed Leave a review and contact me via mql5 message to receive My Top 5 set files for Stratos Pali at no cost! D
Currency Strength Wizard
Oleg Rodin
4.93 (44)
货币强度向导是一个非常强大的指标,为您提供成功交易的一体化解决方案。该指标使用多个时间范围内所有货币的数据来计算这个或那个外汇对的力量。此数据以易于使用的货币指数和货币电力线的形式表示,您可以使用它们来查看这种或那种货币的力量。 您所需要的只是将指标附加到您要交易的图表上,该指标将向您显示您交易的货币的真实强度。该指标还向您显示买卖量压力的极值,您可以在顺势交易时利用这些压力。该指标还显示了基于斐波那契的可能目标。该指标可用于各种交易时间范围。该指标支持各种货币对的交易。 该指标为您提供所有类型的警报,包括推送通知。 购买后请联系我。我将与您分享我的交易技巧,并免费为您提供丰厚的红利指标! 祝您交易愉快,获利丰厚!
PRO Renko System
Oleg Rodin
5 (25)
PRO Renko Arrow Based System for trading renko charts.  准确的信号交易任何外汇工具. 另外,我将免费提供系统的附加模块! PRO Renko系统是RENKO图表上高度准确的交易系统。该系统是通用的。 该交易系统可应用于各种交易工具。 该系统有效地中和了所谓的市场噪音,打开了获得准确反转信号的通道。 该指标易于使用,只有一个参数负责产生信号。 您可以很容易地使算法适应您感兴趣的交易工具和renko酒吧的大小。 我很乐意通过提供任何咨询支持来帮助所有客户有效地使用该指标。 祝您交易成功!购买后,立即写信给我! 我将与您分享我的建议和我的renko发电机。 另外,我将免费提供系统的附加模块!
TPSpro RFI Levels
Roman Podpora
4.82 (22)
指示       俄罗斯 -        英语   建议 与指示器一起使用     -       TPSpro 趋势专业版 -   MT4版本       交易中的一个关键要素是做出买卖交易工具决定的区域或水平。尽管主要参与者试图隐藏他们在市场中的存在,但他们不可避免地会留下痕迹。我们的任务是学习如何识别这些痕迹并正确解释它们。 主要功能: 向卖家和买家显示活跃区域! 该指标显示所有正确的初始买入和卖出脉冲水平/区域。激活这些水平/区域后,开始寻找切入点,水平会改变颜色并填充特定阴影。此外,还会显示箭头,以便更直观地了解情况。 显示更高时间范围内的级别/区域(MTF 模式) 添加了使用更高时间间隔显示级别/区域的功能。此外,该指标还具有自动趋势检测功能(   TPSproTREND PRO   )。 用于交易的单独专业的逐步算法。 该算法专为日内交易而设计,既可顺势交易,也可逆势交易。每个活动模板均提供详细说明。 适用于多种时间范围 。 TPSpro RFI 水平指标可用于图表上的任何时间范围,从一分钟(M1)开始一直到每月(MN)。 图形和声音警报。 该指标提供图形和声音指示
Currency Strength Exotics
Bernhard Schweigert
4.87 (30)
目前8折优惠! 对任何新手或专家交易者来说都是最好的解决方案! 这个指标是专门用来显示任何符号的货币强度,如异国货币对、商品、指数或期货。它是同类产品中的第一个,任何符号都可以添加到第9行,以显示黄金、白银、石油、DAX、US30、MXN、TRY、CNH等的真实货币强度。这是一个独特的、高质量的、负担得起的交易工具,因为我们已经纳入了一些专有的功能和一个新的公式。想象一下,你的交易将如何改善,因为你能够准确地确定新趋势或剥头皮机会的触发点? 用户手册:点击这里   https://www.mql5.com/en/blogs/post/708876 它适用于所有时间框架。你将很快能够看到TREND! 根据新的基础算法设计,它使识别和确认潜在交易变得更加容易。这是因为它以图形方式显示了8种主要货币和一种符号的强弱。 该指标显示了8种主要货币(澳元加元瑞士法郎欧元英镑日元新西兰美元)的强弱线,再加上一个符号! 该指标显示了符号的真实价值。例如:对于XAUUSD(黄金):价格以美元报价。如果黄金在上涨,你怎么能知道是黄金的强势还是美元的弱势?只有当黄金走强时,我们才会进行
Trend Pulse
Mohamed Hassan
5 (4)
Please contact me after purchase to immediately get your PDF strategy + documentation for Trend Pulse !  Introducing Trend Pulse , a unique and robust indicator capable of detecting bullish, bearish, and even ranging trends! Trend Pulse uses a special algorithm to filter out market noise with real precision. If the current symbol is moving sideways, Trend Pulse will send you a ranging signal, letting you know that it's not a good time to enter a trade. This excellent system makes Trend Pulse
首先,值得强调的是,这个交易工具是非重绘、非重画和非滞后的指标,非常适合专业交易。 在线课程,用户手册和演示。 智能价格行动概念指标是一个非常强大的工具,既适用于新手,也适用于经验丰富的交易者。它将超过20个有用的指标合并到一个指标中,结合了高级交易思想,如内圈交易员分析和智能资金概念交易策略。该指标侧重于智能资金概念,提供有关大型机构交易方式的见解,帮助预测它们的动向。 它在流动性分析方面尤其擅长,有助于理解机构的交易方式。它擅长预测市场趋势,并仔细分析价格波动。通过将您的交易与机构策略对齐,您可以更准确地预测市场走向。该指标多才多艺,擅长分析市场结构,识别重要的订单区块,并识别各种模式。 它擅长识别BOS和CHoCH等模式,理解动量的转变,并突出显示供需强劲的关键区域。它还擅长发现强大的不平衡,并分析价格创造更高高点或更低低点的模式。如果您使用斐波那契回撤工具,该指标可以满足您的需求。它还可以识别相等的高点和低点,分析不同的时间框架,并通过仪表板显示数据。 对于使用更高级策略的交易者,该指标提供了工具,如公平价值差指标和优惠和折扣区域的识别。它特别关注高时间框架订单
MetaBands M4
Vahidreza Heidar Gholami
5 (2)
MetaBands使用强大且独特的算法绘制通道并检测趋势,以便为交易者提供进出交易的潜在点。它是一个通道指标和强大的趋势指标。它包括不同类型的通道,可以通过使用输入参数简单地合并以创建新通道。MetaBands使用所有类型的警报通知用户市场事件。 功能 支持大多数通道算法 强大的趋势检测算法 能够合并不同类型的通道 多时间帧和多货币(信号矩阵) 所有类型的警报功能(声音、屏幕闪烁、推送通知、电子邮件、弹出窗口、箭头) 它永远不会重绘 趋势检测 MetaBands使用在通道内振荡的蓝色线来检测趋势。当该线遇到通道的上界时,表明开始下跌趋势,当它遇到下界时,表明开始上涨趋势。如果蓝线接近中线,则市场处于整理期。 该指标使用独特的方法来检测趋势。一开始可能看起来有些复杂,但如果您观看视频教程,您就会意识到它是多么强大且易于使用。 入场和出场信号 当趋势变化或价格穿过上下通道时,MetaBands会立即通过不同的方法提醒交易者,这些方法可以在指标设置中启用。 信号矩阵 要监视来自不同时间框架的多个符号并在一个地方查看信号,请单击右上角按钮或按键盘上的M键以打开信号矩阵。该矩阵可以
ICT, SMC, SMART MONEY CONCEPTS, SMART MONEY, Smart Money Concept, Support and Resistance, Trend Analysis, Price Action, Market Structure, Order Blocks, BOS/CHoCH,   Breaker Blocks ,  Momentum Shift,   Supply&Demand Zone/Order Blocks , Strong Imbalance, HH/LL/HL/LH,    Fair Value Gap, FVG,  Premium  &   Discount   Zones, Fibonacci Retracement, OTE, Buy Side Liquidity, Sell Side Liquidity, BSL/SSL Taken, Equal Highs & Lows, MTF Dashboard, Multiple Time Frame, BigBar, HTF OB, HTF Market Structure, 
Gold Channel XAUUSD
Paulo Rocha
5 (2)
Gold Channel is a volatility-based indicator, developed with a specific timing algorithm for the XAUUSD pair, which consists of finding possible corrections in the market. This indicator shows two outer lines, an inner line (retracement line) and an arrow sign, where the theory of the channel is to help identify overbought and oversold conditions in the market. The market price will generally fall between the boundaries of the channel. If prices touch or move outside the channel it is a tra
Market Reversal Alerts
LEE SAMSON
4.19 (113)
成為突破者,隨著價格反轉,市場結構會改變利潤。 訂單突破者指示器可以識別趨勢或價格走勢何時接近枯竭並準備好逆轉。它會提醒您市場結構的變化,通常會在發生逆轉或重大回調時發生。 該指標使用專有計算來確定突破和價格動能。每當在可能的耗盡點附近形成新的高點時,指標就會繪製最後一個生成該高點的順序塊。然後,它將隨價格移動隨價格跟隨定單。然後,當價格轉向相反方向並突破該訂單塊時,它會提醒您,從而創建新的市場結構並開始趨勢或重大回調的可能逆轉。 訂單塊是在創建高/低之前的最後一個相反的彩色蠟燭,並且當價格跌破這些關鍵區域以下時,這表明趨勢可能會發生短期或長期反轉。 特徵 提醒您關鍵耗盡點的市場結構變化 價格接近耗盡水平時自動提取訂單塊 在一個方向繼續移動時,在價格後面跟踪定單,以提醒您最佳的反轉輸入 將顏色更改為純色塊,以顯示何時發生市場結構中斷。 適用於所有交易品種和時間範圍 內置集成的彈出窗口和電子郵件警報 策略和如何與定單破壞者指標進行交易 當斷路器塊發生時,您有兩個選擇。 看左邊!我們正在尋求供應/需求或支撐/阻力位嗎?市場結構轉變(逆轉)通常發生在價格重新測試舊水平或
Automated Trendlines
Georgios Kalomoiropoulos
5 (16)
趋势线是外汇交易中最重要的技术分析工具。不幸的是,大多数交易者没有正确绘制它们。自动趋势线指标是专业交易者的专业工具,可帮助您可视化市场的趋势运动。 有两种类型的趋势线看涨趋势线和看跌趋势线。 在上升趋势中,外汇趋势线是通过价格变动的最低摆动点绘制的。 连接至少两个“最低点”将创建一条趋势线。 在下跌趋势中,趋势线是通过价格走势的最高摆动点绘制的。 连接至少两个“最高点”将创建一条趋势线。 趋势线何时突破? 当看跌蜡烛收于看涨​​趋势线下方并且蜡烛的高点在趋势线上方时,看涨趋势线会被打破。 当看涨蜡烛收于看跌趋势线上方并且蜡烛的低点低于趋势线时,看跌趋势线会被打破。 趋势线何时删除? 当一根完整的蜡烛在看涨趋势线下方形成时,看涨趋势线将被删除。 当完整的蜡烛在看跌趋势线上方形成时,看跌趋势线将被删除。 您可以从输入参数更改看涨和看跌趋势线的颜色和宽度。
Reversal Sniper is designed to find the extreme reversals of the price. Indicator collects data of Cycle Sniper Indicator. NOTE: REVERSAL SNIPER Indicator is made for Cycle Sniper Users as an additional tool.  However, it can be used by the traders who look for finding out strong reversal levels. Indicator works on all timeframes and all instruments. Reversal  Sniper  Checks: Harmonic Patterns RSI Zig Zag and Harmonic Swings Cycle Sniper Indicator's Buy / Sell Signals The complex algo i
作者的更多信息
HFTHackerMT5
Thomas Bradley Butler
5 (2)
由於優化過程的複雜性和用戶的混亂,這已經回到了簡單版本而沒有恢復。 如果您購買了低於 15 的先前版本且具有恢復功能,請勿使用 15。 如果它太複雜用戶就不會使用。 在測試和使用之前優化 EA。僅在優化後才購買。這適合那些知道如何優化並希望憑藉自身優勢獲利的交易者。 您設定您的風險參數。如果您選擇不成功的交易,則可透過停損獲得高勝率。降低長壽風險。 這適用於所有帳戶,是一個風險管理工具,請閱讀所有評論、描述和部落格。 MT4版本: https://www.mql5.com/en/market/product/73834 此智慧交易系統 (EA) 使用每個部位的固定手數自動執行買賣交易。其核心特點是無論帳戶餘額如何,都保持一致的交易規模,確保交易者完全控制每筆交易的風險。這種方法可以實現簡單且可預測的交易策略,無需根據帳戶規模或波動進行調整。透過保持手數大小固定,交易者可以避免動態大小的複雜性,同時堅持他們首選的風險管理策略。 透過購買和使用此 Expert Advisor (EA),您承認您已在策略測試器上徹底測試了 EA,並了解自動交易中涉及的相關風險。您進一步承認,
Matrix Hacker
Thomas Bradley Butler
MT4 Version :   https://www.mql5.com/en/market/product/87060 Matrix Hacker 仅适用于对冲账户并使用随机游走,过去无关紧要。 EA 将在市场中保持稳定并涵盖询价和出价。根据交易者的不同,买卖大小和交易量不同的买盘和卖盘。不建议初学者这样做,因为它仍然需要了解优化而不是过度杠杆化。我建议使用设置来剥削较小的点并保持在范围内。 此 EA 可能会打开 4 笔交易,因此了解这一点可确保输入的大小正确。它使用固定手数,因此需要考虑 4 笔固定手数的交易。在进行实时交易之前先在演示中使用此 EA,并且只有在有信心之前才能使用增量手数。建议每微手 1000 美元。对于日间交易,如果使用 DMA 经纪商和小点差和滑点,则降低 tp。然后,如果在一天结束时整体获利,则退出所有头寸。最后,是否有利润很重要,而不是有多少是正确的。您也可以在不同对之间分配。有很多方法可以对冲以降低风险。一起交易不相关和相关的货币对。 重要的事情是优化输入。优化策略测试器中的上个月选项。保存设置文件并在交易中使用它们。随着市场动态的变化,设置
Black Gold M1
Thomas Bradley Butler
OPTIMIZE BEFORE BACKTEST AND USE Trade crude oil with this EA.  No EA turns hundreds into millions in a year or 2, This is a lie if presented this way.  Black Gold trades Brent Crude on 1 min charts.  It uses RSI, moving averages and directional indicators.  Try it out, load it onto the tester if you have the history and ability to trade Brent crude.    Adjust and optimize to get the most out of the expert advisor
NeuroScalperMT5
Thomas Bradley Butler
MT4 indicator version https://www.mql5.com/en/market/product/72342 I personally use this indicator to scalp.  Accurate for accessing extremes and supports for buy positions primarily for 1 minute time frames.  Other time frames can be used but the levels are different. Its a better oscillator and compare with others to see the difference.          Day trade using neuro network concepts.  This indicator uses elementary forms of neuro networks to generate signals to buy and sell. Use the indicat
Bitcoin White Hat Hacker
Thomas Bradley Butler
Optimize before use in back test or live for better results for you  and don't forget to account for spreads and slippage in optimization. This Expert is for 1 minute charts trading BTC/USD.  Bitcoin on 1 minute use MACD, CCI and RSI for entry and exit logic.  This EA was back tested and traded out of sample.  Each trade has a stop loss and take profit.   BTC compared to the indexes and Gold have huge differences, look at the example of traditional investing vs. Bitcoin.  Yellow line represents
NeuroScalper
Thomas Bradley Butler
5 (1)
更新!箭头被添加到 100 和 200 级别。 该指标可准确访问极端情况,并主要支持 1 分钟时间范围内的买入头寸。可以使用其他时间范围,但级别不同。它是一个更好的振荡器,并与其他振荡器进行比较以查看差异。 使用神经网络概念的日间交易。该指标使用神经网络的基本形式来生成买卖信号。在 1 分钟图表上使用该指标。指示器不会重新绘制。下载并使用 1 分钟图表或其他使用不同级别的图表在测试仪上运行,分析交易以亲自查看。剥头皮市场的许多机会。可用于更高的时间范围,但应根据您的判断更改水平。较高的时间范围具有较高的范围。 使用此模型要考虑的概念和事项: 使用了多个指标,应用了权重,最大值和最小值为 2 个数据点。该指标主要用于交易上升趋势在振荡器的设置(见图)100 和 200 中添加级别,如果使用不同的时间框架,则添加其他级别。
HFTHacker
Thomas Bradley Butler
由於優化過程的複雜性和用戶的混亂,這已經回到了簡單版本而沒有恢復 在測試和使用之前優化 EA。僅在優化後才購買。這適合那些知道如何優化並希望憑藉自身優勢獲利的交易者。 您設定您的風險參數。如果您選擇不成功的交易,則可透過停損獲得高勝率。降低長壽風險。 這適用於所有帳戶,是一個風險管理工具,請閱讀所有評論、描述和 MT5版本: https://www.mql5.com/en/market/product/74421 此智慧交易系統 (EA) 會自動執行買賣交易,同時根據交易者的帳戶餘額調整部位規模。其核心功能是動態調整交易規模,確保隨著帳戶的成長或收縮,風險與可用資本保持成比例。這有助於保持一致的交易策略,而不會在任何特定交易中過度槓桿化或風險過低。我不提供文件。透過購買和使用此 Expert Advisor (EA),您承認您已在策略測試器上徹底測試了 EA,並了解自動交易中涉及的相關風險。您進一步承認,過去的表現並不能保證未來的結果,並且使用此 EA 存在固有風險,包括潛在的投資資本損失。 設定: 輸入 int inp1_CompareCount = 0;
Bitcoin M5
Thomas Bradley Butler
OPTIMIZE EA BEFORE TEST AND USE. Bitcoin M5 is for trading BTC/USD on 5 min charts.  SL and TP should Start with 50000.  OPTIMIZE BEFORE USE The trading strategy uses Bollinger Bands and Envelopes indicators to trade from.  Trading to catch some breakout points of where the price breaches the bands and then exiting when the price crosses the envelopes.  Every trade uses a fixed lot amount and has a SL and TP.  The EA does not use martingale or hedging in the logic.
MarketMakerMT5
Thomas Bradley Butler
自动化供需交易。做一个市场。 这个 EA 的制作和灵感来自于每个人都在销售和模仿的流行供需指标。 EA 继续交易和对冲,做市。也可以在非对冲账户上交易。需要评估风险并使用时间框架、手数、对冲能力。我已经在一个月左右的时间里一次断断续续地交易了多对。 系统概念: EA 交易供需水平。水平发生变化,因此 EA 将继续交易新水平。在手数较低的多对之间进行分配是该系统的一项功能。在保持稳定收益的同时,应避免大幅回撤。 SL 可以使用,但我解释的对冲方面允许这是一种选择。我在多对小手上得到的回撤是 4%,这是没有止损的。较大的地块显示为 6%。因此,较小的尺寸是保守的,而较大的则更具侵略性。这些是保持交易手数低于余额的原因。行业需要发展空间。 特征: 贸易计数 固定手数 音量上限 止损 获利
ForexReversal
Thomas Bradley Butler
4 (1)
耐心是无压力剥头皮的关键。 当您看到它通过 200 移动平均线时交易箭头,并通过扩大或从没有移动平均过滤器的最后一个摆动点形成趋势。 适用于 1 分钟时间框架,捕捉日内动量走势。 使用追踪止损轻松获得 20 个点或为更大的趋势停留更长时间。 查看该指标中真正大笔交易的照片中的示例。 1 分钟的时间框架效果最好。 缩小以查看趋势。 箭头不会重新绘制或重新计算。 附加到 1 分钟的时间框架并研究交易,看看它是否可用于您的策略。 一世 规则: 买蓝色 红色出售 远离横盘整理 交易量大,交易动量 使用止损 耐心是无压力剥头皮的关键。 当您看到它通过 200 移动平均线时交易箭头,并通过扩大或从没有移动平均过滤器的最后一个摆动点形成趋势。 适用于 1 分钟时间框架,捕捉日内动量走势。 使用追踪止损轻松获得 20 个点或为更大的趋势停留更长时间。 查看该指标中真正大笔交易的照片中的示例。 1 分钟的时间框架效果最好。 缩小以查看趋势。 箭头不会重新绘制或重新计算。 附加到 1 分钟的时间框架并研究交易,看看它是否可用于您的策略。 一世 规则: 买蓝色 红色出售 远离横
VolumeDayTrader
Thomas Bradley Butler
僅限股票(差價合約)的日間交易。 交易需要工作。 沒有捷徑或指標可以告訴您所有的進入和退出。 利潤來自心態。 指標是與資金管理和成功心理學結合使用的工具。 查找音量配置文件中的不平衡。 貿易價格量不平衡。 許多不平衡發生在收盤、開盤和新聞中。 查看股票中的買家與賣家。 使用 5 分鐘到 1 小時來查看誰可以控制價格並發現價格不平衡。 更大的股票是 15 分鐘及以上。 將鼠標懸停在顏色音量條上以查看過去條的數量。 當前條形圖的音量寫在右上角。 找出交易量的不平衡,看看價格在一段時間內可能走向何方。 跟隨主導趨勢以獲得最佳結果 如果趨勢發展尋找交易趨勢。 使用追踪止損並留意大量反轉不平衡。 交易 Apple、SPY、GOOLE、TESLA。 所有你最喜歡的股票
GoldBuyBackScalper
Thomas Bradley Butler
4 (1)
该指标仅适用于 XAU/USD,1 分钟图表。 每对都有独特的特征和价格走势。 使用该指标交易 V 形反转。 头皮使用追踪止损购买并避免新闻,因为它们更加极端并且可能导致突然抛售。 在回测中附加到 1 分钟的时间范围并查看反转购买。 指标从不重新绘制或重新计算。 仅在营业时间内交易 该指标仅适用于 XAU/USD,1 分钟图表。 每对都有独特的特征和价格走势。 使用该指标交易 V 形反转。 头皮使用追踪止损购买并避免新闻,因为它们更加极端并且可能导致突然抛售。 在回测中附加到 1 分钟的时间范围并查看反转购买。 指标从不重新绘制或重新计算。 仅在营业时间内交易 该指标仅适用于 XAU/USD,1 分钟图表。 每对都有独特的特征和价格走势。 使用该指标交易 V 形反转。 头皮使用追踪止损购买并避免新闻,因为它们更加极端并且可能导致突然抛售。 在回测中附加到 1 分钟的时间范围并查看反转购买。 指标从不重新绘制或重新计算。 仅在营业时间内交易
TrueSupplyandDemand
Thomas Bradley Butler
This is based on short term strength or weakness and not on moving averages.  Moving averages are used for filter only. Trade supply and demand with arrows. Supply and demand breakouts and strength of the buyers or sellers .  Don't trade buy arrow to sell arrow.  Trade the strength with trendlines or moving averages and use stops.  The arrow can have some strong moves.  Trade on all time frames.  Try it out in the back tester. The pips can be made with this indicator, follow the arrows and mak
ScalpingMaster
Thomas Bradley Butler
Master scalping with this indicator.  Trade on any time frame for scalps on buy or sells.  Follow trends using a 200 moving average and stops and targets.  Use with your own system.  This indicator can give pips if following it correctly.  Stick to rules and pick up pips daily.  Use as entries in a trend, scalp for a few pips or exit on opposite signal.  Best to follow higher time frame trends. Indicator doesn't repaint or recalculate. Rules: Don't trade overnight, only trade during active sessi
DayTradeKing
Thomas Bradley Butler
This indicator is good for small time frames like 1 and 5 minutes and made for day trading. The indicator never repaints or recalculates. The indicator works is for trading swing points in day trading, following bulls or bears.  Its a simple to use, non cluttered indicator with a high success rate.  This indicator works well to capture ranges.  All indicators come with limitations and no indicator or system is always accurate. Use money management for long term trading success.   Place in backte
DTKGold
Thomas Bradley Butler
This is the DayTradeKing for gold on a 1 minute time frame.  It is a different calculation for the range. Use a 200 period moving average as a filter.  Always use stops and avoid news, wait for more conformation.  This looks to capture intraday ranges. Put it in the back tester on 1 minute to see the price action and how it works. Trade with trend Use filter Use stops Alerts are added for pop ups and sound. 
SuperArrowScalper
Thomas Bradley Butler
Trade trends with the Super Scalper Use on all time frames and assets it is  designed for scalping trends. Works good on small time frames for day trading.  The arrows are easy to follow.  This is a simple no repaint/no recalculate arrow indicator to follow trends with.  Use in conjunction with your own system or use moving averages.  Always use stops just below or above the last swing point or your own money management system The indicator comes with push notifications, sound alerts and email
Levels Trading
Thomas Bradley Butler
This indicator is a simple stripped down version of any advanced support and resistance indicator.  All the support and resistance indicators work from a number of bars that have developed over time. Get rid of clutter and confusing levels.  Find levels according to a number of bars. Look at days, session, numbers of hours, periods of consolidation.  Watch levels develop and use as breakout points, or areas of buyers and sellers.  Features and things to consider This indicator is for a frame of
ForexReversalEA
Thomas Bradley Butler
https://www.mql5.com/en/market/product/57345 该 EA 基于外汇反转指标。 如果您更喜欢手动交易系统,请下载指标并试用。 EA 将跟随趋势并相应地开仓。 结果显示具有较低回撤的稳定收益,但在回测器、优化器和时间框架中进行试验,看看什么有效。 显示的所有结果都是假设的。 注意:这不是鞅或网格。 该指标确实具有对冲能力 此 EA 具有以下功能,并根据您的风险进行更改。 EA根据可用保证金添加,根据参数买卖。 通过输入控制风险。 inp 5 是卖 inp 7 是购买 固定止损手数 固定获利   可用保证金百分比 该 EA 基于外汇反转指标。 如果您更喜欢手动交易系统,请下载指标并试用。 EA 将跟随趋势并相应地开仓。 结果显示具有较低回撤的稳定收益,但在回测器、优化器和时间框架中进行试验,看看什么有效。 显示的所有结果都是假设的。 注意:这不是鞅或网格。 该指标确实具有对冲能力 此 EA 具有以下功能,并根据您的风险进行更改。 EA根据可用保证金添加,根据参数买卖。 通过输入控制风险。
MarketMaker
Thomas Bradley Butler
自动化供需交易。做一个市场。 这个 EA 的制作和灵感来自于每个人都在销售和模仿的流行供需指标。 EA 继续交易和对冲,做市。也可以在非对冲账户上交易。需要评估风险并使用时间框架、手数、对冲能力。我已经在一个月左右的时间里一次断断续续地交易了多对。 系统概念: EA 交易供需水平。水平发生变化,因此 EA 将继续交易新水平。在手数较低的多对之间进行分配是系统中的一项功能。在保持稳定收益的同时,应避免大幅回撤。 SL 可以使用,但我解释的对冲方面允许这是一种选择。我在多对小手上得到的回撤是 4%,这是没有止损的。较大的地块显示为 6%。因此,较小的尺寸是保守的,而较大的则更具侵略性。这些是保持交易手数低于余额的原因。行业需要发展空间。 特征: 贸易计数 固定手数 音量上限 止损 获利
Top Trader
Thomas Bradley Butler
Top Trader Indicator This is an arrow reversal indicator. This is with deviations and arrows.  Trade a blue arrow for buy and trade a red arrow for sell.  Change the time period and the deviations of the bands.  This is similar to others but these arrows don't repaint.  Load in back tester and study which periods and deviations work the best.  It works on all time frames.  15 min to 1 hr would give good results for take profits.  Try according to your own risk management.
Quant Bot
Thomas Bradley Butler
Quant Bot 用于欧元/美元一小时时间框架内的趋势交易。 没有设置文件,但如果使用其他对,则可能需要优化。 关于机器人: 它使用基因生成并使用 ATR 进行交易。 前行期用于防止曲线拟合 EA 在每笔交易中都使用止损。 资金管理是按余额百分比放大 回溯期为 2003-2020 年,前进期为 2020-2022 年。(见图)。 Quant Bot 用于欧元/美元一小时时间框架内的趋势交易。 没有设置文件,但如果使用其他对,则可能需要优化。 关于机器人: 它使用基因生成并使用 ATR 进行交易。 前行期用于防止曲线拟合 EA 在每笔交易中都使用止损。 资金管理是按余额百分比放大 回溯期为 2003-2020 年,前进期为 2020-2022 年。(见图)。
Crypto Net
Thomas Bradley Butler
Crypto Net 用于在  BTCUSD。 它使用基因进化来进化策略。 该 EA 交易趋势遵循 ATR 和 Ichimoku 指标。 这是构建并通过了一系列强大的测试,包括 Monte Carlo 和 Walk Forward。 输入: 最低风险的账户百分比。 最大手数 停止交易的时间 没有其他任何改变。 Crypto Net 用于在 BTCUSD。 它使用基因进化来进化策略。 该 EA 交易趋势遵循 ATR 和 Ichimoku 指标。 这是构建并通过了一系列强大的测试,包括 Monte Carlo 和 Walk Forward。 输入: 最低风险的账户百分比。 最大手数 停止交易的时间 没有其他任何改变。 输入: 最低风险的账户百分比。 最大手数 停止交易的时间 没有其他任何改变。 输入: 最低风险的账户百分比。 最大手数 停止交易的时间 没有其他任何改变。
Golden Standard
Thomas Bradley Butler
对于 XAU/美元 这是一个稳定的交易系统,使用随机生成和趋势跟踪交易。 Expert 使用质量数据进行了回测,完成了一个优化期以及 Monte Carlo 模拟,以避免在 XAU/USD 1 小时时间范围内过度拟合。 使用止损和获利。 EA 有多种配置,除了计算要交易的手数之外别无他法。 特征: 使用余额百分比复合利润 对于 XAU/美元 这是一个稳定的交易系统,使用随机生成和趋势跟踪交易。 Expert 使用质量数据进行了回测,完成了一个优化期以及 Monte Carlo 模拟,以避免在 XAU/USD 1 小时时间范围内过度拟合。 使用止损和获利。 EA 有多种配置,除了计算要交易的手数之外别无他法。 特征: 使用余额百分比复合利润 对于 XAU/美元 这是一个稳定的交易系统,使用随机生成和趋势跟踪交易。 Expert 使用质量数据进行了回测,完成了一个优化期以及 Monte Carlo 模拟,以避免在 XAU/USD 1 小时时间范围内过度拟合。 使用止损和获利。 EA 有多种配置,除了计算要交易的手数之外别无他法。
PropTrader
Thomas Bradley Butler
*使用前优化 EA* 欧元/美元优化外汇交易策略 通过专家顾问 (EA) 在一两年内获得巨额财富是一个不切实际的说法。 回测和真实交易重点关注欧元/美元货币对。 关于该策略: 这代表了我们战略的初始迭代,并有进一步发展的潜力。 经过 100% 质量数据的严格测试,没有 MT4 错误。 该策略按照趋势跟踪的逻辑原则运作。 当趋势看涨时,EA 启动并部署追踪止损,反之亦然。 本质上,这是一种简单的趋势跟踪方法。 主要优点和注意事项: 轻松设置:坚持使用默认设置,仅根据您的喜好修改批量大小。 风险管理:该策略不采用鞅或对冲。 风险缓解:每笔交易都配备了追踪止损和止盈水平,由平均真实波动幅度 (ATR) 确定,有助于更好的风险管理。 趋势识别:此方法旨在帮助交易者识别并利用更持久的趋势。 外汇交易风险免责声明: 外汇交易涉及保证金交易外币,风险较高,可能并不适合所有投资者。 过去的表现并不是未来业绩的保证。
Down Under
Thomas Bradley Butler
Down Under 在 1 小时的时间范围内交易澳元/美元对。 该 EA 交易 ATR 和 OHLC。 它在这个时间范围内为这对格式化。 复合使用分钟。 手数和最大。 批量。 余额的百分比是在获胜交易中复合的。 随着余额波动,手数也会波动。 设置: 毫米风险% 毫米批次 最大手数 没有什么可以改变的。 这没有马丁格尔或对冲能力。 唯一需要更改的其他功能是,如果您交易的是澳元/美元的差价合约。 在经纪人平台上按小数点更改。 风险免责声明 期货、期权和货币交易都有很大的潜在回报,但也有很大的潜在风险。 为了投资这些市场,您必须意识到风险并愿意接受它们。 Down Under 在 1 小时的时间范围内交易澳元/美元对。 该 EA 交易 ATR 和 OHLC。 它在这个时间范围内为这对格式化。 复合使用分钟。 手数和最大。 批量。 余额的百分比是在获胜交易中复合的。 随着余额波动,手数也会波动。 设置: 毫米风险% 毫米批次 最大手数 没有什么可以改变的。 这没有马丁格尔或对冲能力。 唯一需要更改的其他功能是,如果您交易的是澳元/
Cable Trader
Thomas Bradley Butler
GBP/USD 1hr. 该 EA 交易动量和会话。 这有一个固定的手数组成部分,并将随着它的发展继续修改 TP。 设置: 批量 没有什么可以改变的。 这没有马丁格尔或对冲能力。 唯一要更改的其他功能是,如果您交易的是英镑/美元的差价合约。 在经纪人平台上按小数点更改。 风险免责声明 期货、期权和货币交易都有很大的潜在回报,但也有很大的潜在风险。 为了投资这些市场,您必须意识到风险并愿意接受它们。 Cable Trade 在 1 小时的时间范围内交易 GBP/USD 对。 现场交易前的演示。 该 EA 交易动量和会话。 这有一个固定的手数组成部分,并将随着它的发展继续修改 TP。 设置: 批量 没有什么可以改变的。 这没有马丁格尔或对冲能力。 唯一要更改的其他功能是,如果您交易的是英镑/美元的差价合约。 在经纪人平台上按小数点更改。 风险免责声明 期货、期权和货币交易都有很大的潜在回报,但也有很大的潜在风险。 为了投资这些市场,您必须意识到风险并愿意接受它们。
Euclidean
Thomas Bradley Butler
欧几里得是我 8 年前提出的一种独特的交易算法。 该 EA 是该系统的一部分。 它作为一个封闭系统工作。 当角度正确以捕捉趋势时,EA 将启动买入。 止损是角度的10%。 就是这么简单。 输入: 手数余额百分比 1 微手 1,000 美元 获利水平 = 默认为 50 点 如何和需要考虑的事项: 止损是内置的,并根据价格以 10% 的角度进行交易。 止盈设置为 50 点,但可以是您想要的金额。 在 1 到 5 分钟的小时间范围内进行交易。 在回测器中对此进行测试的错误为零。 不同的平台和经纪人有不同的数据,因此请检查下载数据以进行测试。 外汇交易风险免责声明 欧几里得是我 8 年前提出的一种独特的交易算法。 该 EA 是该系统的一部分。 它作为一个封闭系统工作。 当角度正确以捕捉趋势时,EA 将启动买入。 止损是角度的10%。 就是这么简单。 输入: 手数余额百分比 交易量上限 = 最大手数 获利水平 = 默认为 50 点 如何和需要考虑的事项: 止损是内置的,并根据价格以 10% 的角度进行交易。 止盈设置为 50 点,但可以是您想要的金额。
Pip Scalper
Thomas Bradley Butler
每个人的指标 Pip Scalper 用于剥头皮趋势。 使用此指标更长时间地保持趋势。 它适用于所有时间框架和资产。 使用此工具获取每日点数。 使用 200 移动平均线过滤交易。 建议使用较小的时间范围。 用于日间交易。 关于和如何使用: Pips Scalper 基于长期趋势交易。 买蓝色 卖出红色 在活跃期间使用 200 移动平均线作为过滤器和交易。 Pip Scalper 用于剥头皮趋势。 使用此指标更长时间地保持趋势。 它适用于所有时间框架和资产。 使用此工具获取每日点数。 使用 200 移动平均线过滤交易。 建议使用较小的时间范围。 用于日间交易。 关于和如何使用: Pips Scalper 基于长期趋势交易。 买蓝色 卖出红色 在活跃期间使用 200 移动平均线作为过滤器和交易。
Evolved Trends
Thomas Bradley Butler
OPTIMIZE BEFORE TEST AND USE TO FIND BEST INPUTS Hey there traders! Want a cutting-edge Expert Advisor for your MT4 platform? Look no further than Evolved Trends! This powerful trading algorithm, created with machine learning technology, focuses on trading GBP/USD on 1 Hour time frames. But hey, feel free to experiment with other assets and time frames for optimization! Just customize the inputs to match your own risk tolerance. With stops based on ATR and the ability to lock in profits and c
筛选:
lywer
179
lywer 2024.03.28 14:36 
 

用户没有留下任何评级信息

回复评论
版本 5.20 2024.03.28
fixed updating issue
版本 5.10 2024.03.28
changed the object lines to reflect the time frames input
版本 5.0 2024.03.27
fixed deinit function
版本 4.0 2024.03.27
Updated to add Fibonacci and different time frame options
版本 3.0 2024.03.26
added user inputs