High Low Close chart with thick wicks
- 指标
- Amin Alisher Shaikh
- 版本: 1.0
- 激活: 5
注意 - 您必须隐藏现有的图表类型,您可以通过更改图表的颜色来做到这一点,如果您不知道如何操作,请查看此视频 - https://youtu.be/-4H6Z5Z4fKo
或联系我:priceaction9@outlook.com
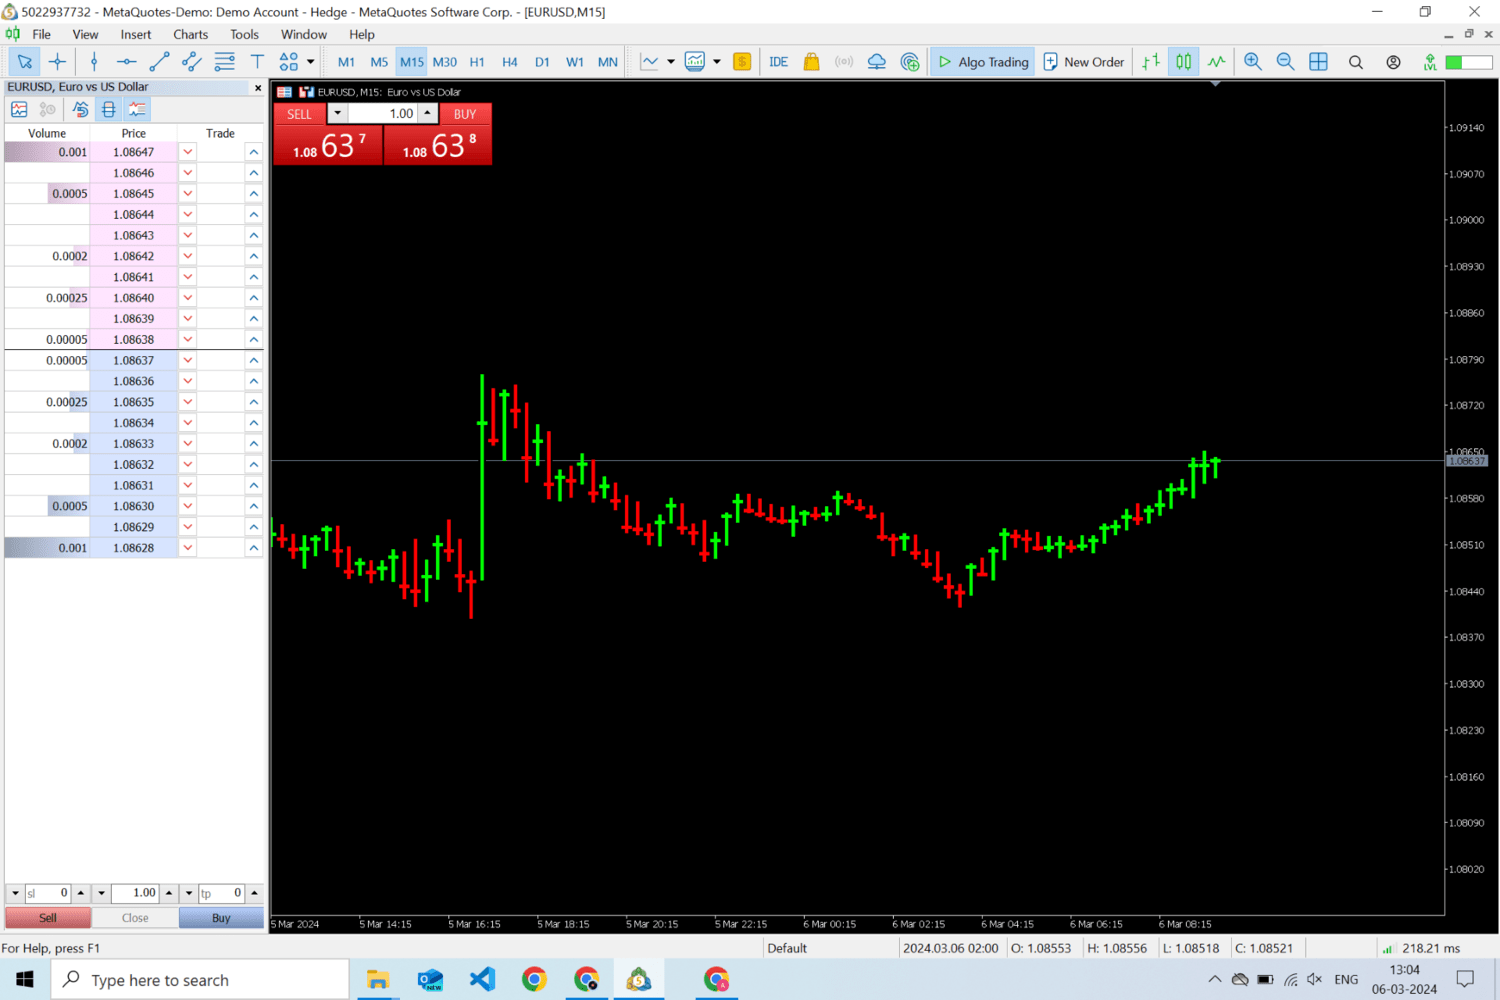
这是一种将代替您的图表显示的图表类型,它仅显示最高价、最低价和收盘价,并且具有粗影线。它可以减少每根蜡烛开盘价带来的噪音,帮助您更好地了解每根蜡烛。
例如,在 1 到 10 的范围内,如果蜡烛开盘价为 5,收盘价为 8,最低价为 1,则它形成 3 点的主体,并且其余点将有影线,因此有时很难制作对它的感觉。
在此图表中,如果发生相同的情况,则收盘点将显示在 8 处,通过查看它,您将立即了解到,它从 1 上涨到 8 正方向,从 10 上涨到 8 负方向,因此您知道它是看涨蜡烛。
如果您有任何疑问,请在这里告诉我priceaction9@outlook.com