Pivot Point Daily Shifted Mt4 Original
- 指标
- Navjot Singh
- 版本: 1.0
- 激活: 5
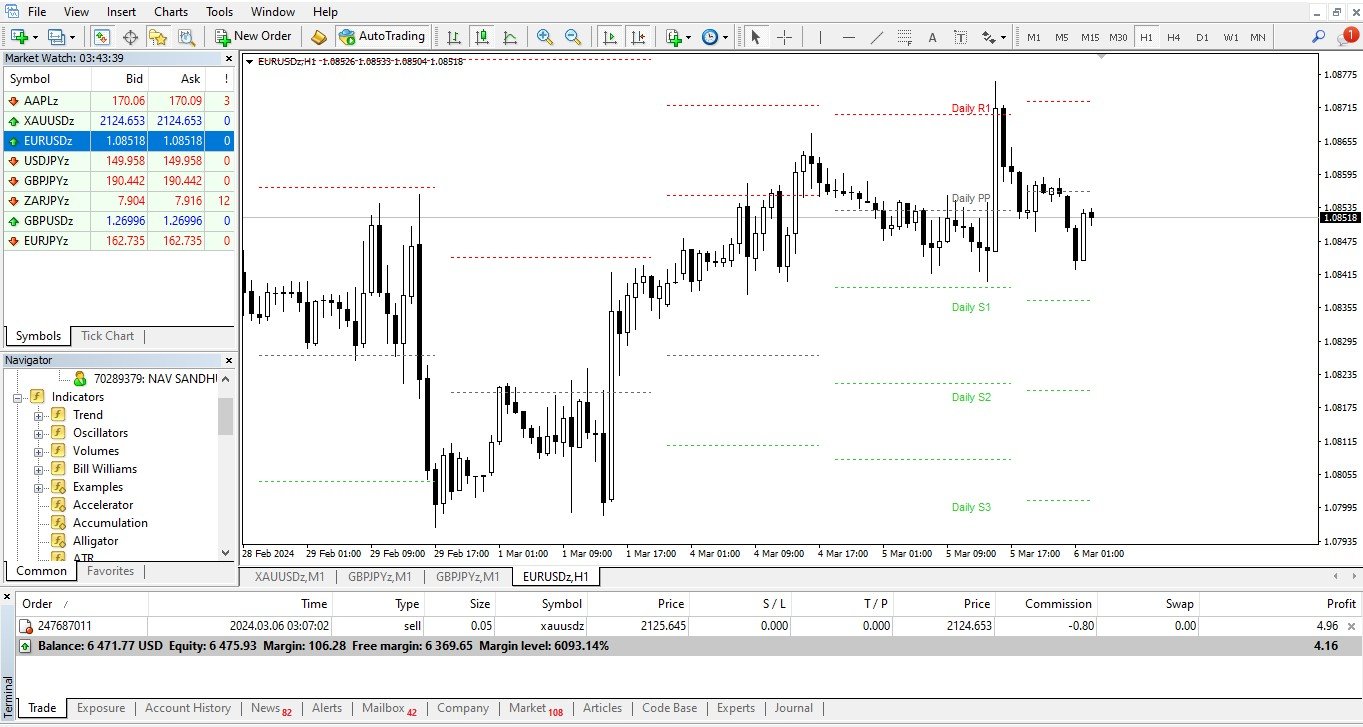
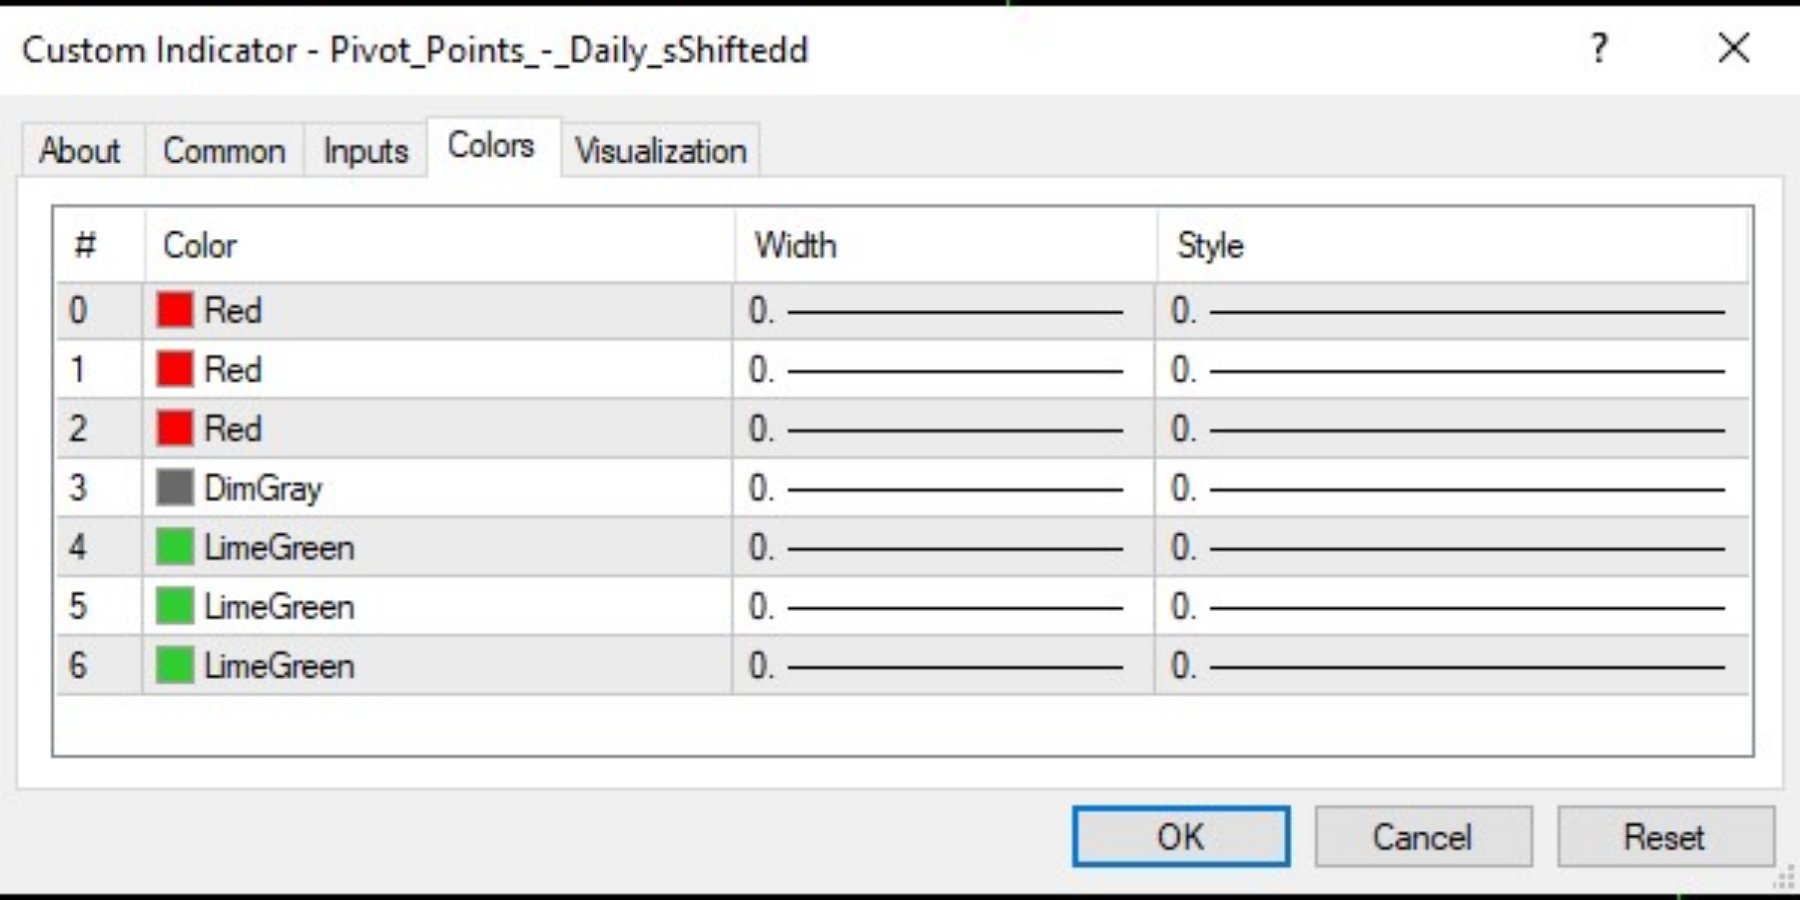
The Indicator show Daily Pivot Points. It is possible to specify the number of days to display. For forex it doesn't consider the sunday session data. It is possibile to modify the color, style and width for every level.It is better to use this indicator with timeframe not higher than Н1. 4 Levels of support and resistance with also Intermediate Levels that is possible to hide.
Pivot trading:
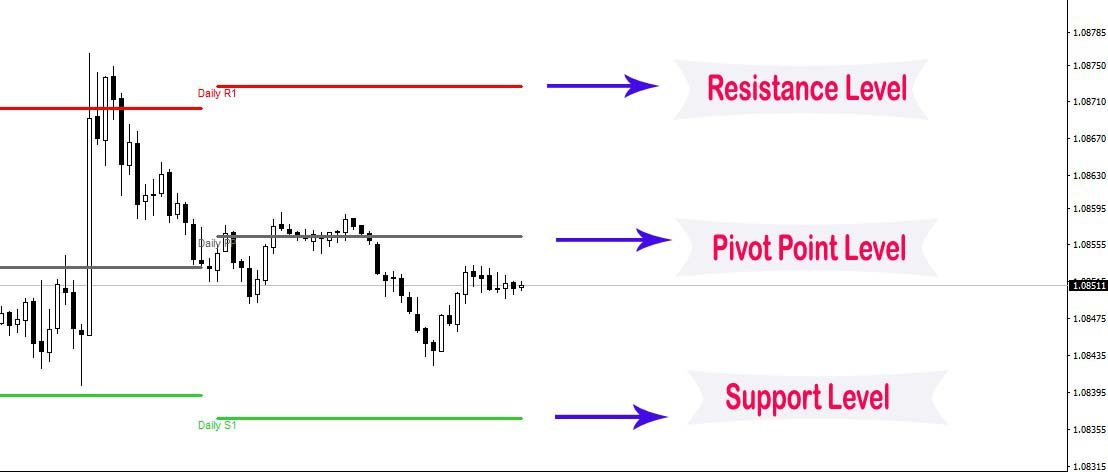
1.pp pivot
2. r1 r2 r3, s1 s2 s3
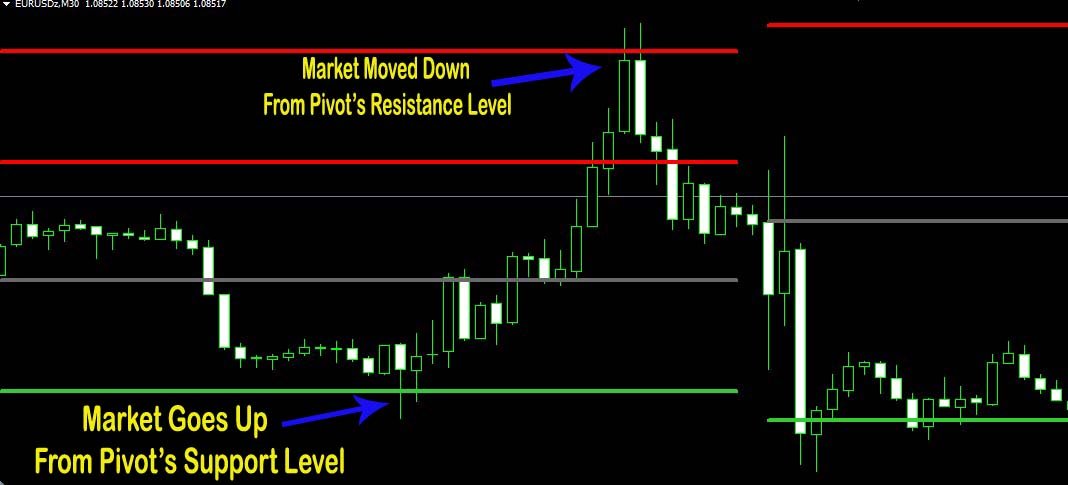
Pivot points have been a trading strategy for a long time, originally used by floor traders. Using this method, you can understand where the market is going in a day through a few simple calculations.
The pivot point in the pivot point method is the turning point of the market direction during the day. A series of points can be obtained by simply calculating the high, low and closing price of the previous day. These points may form key support and resistance lines. The pivot point, support and resistance levels are collectively referred to as the pivot level.
The market you see has an opening price, a high price, a low price, and a closing price every day (some markets open 24 hours, such as the foreign exchange market, which usually uses 5pm EST as the opening and closing time). This information contains all the data you use the pivot method.
The pivot point method is so popular because it can be predicted, not delayed. You can use the data from the previous day to calculate the possible turning point on your trading day (current trading day)
Because there are many traders who trade according to the pivot method, you will find that the market is responsive in these key positions. This gives you a trading opportunity.