BoS CHoCH Indicator
- 指标
- Usiola Oluwadamilol Olagundoye
- 版本: 1.10
- 更新: 25 四月 2024
- 激活: 20
The Expert Advisor for this Indicator can be found here: https://www.mql5.com/en/market/product/115445
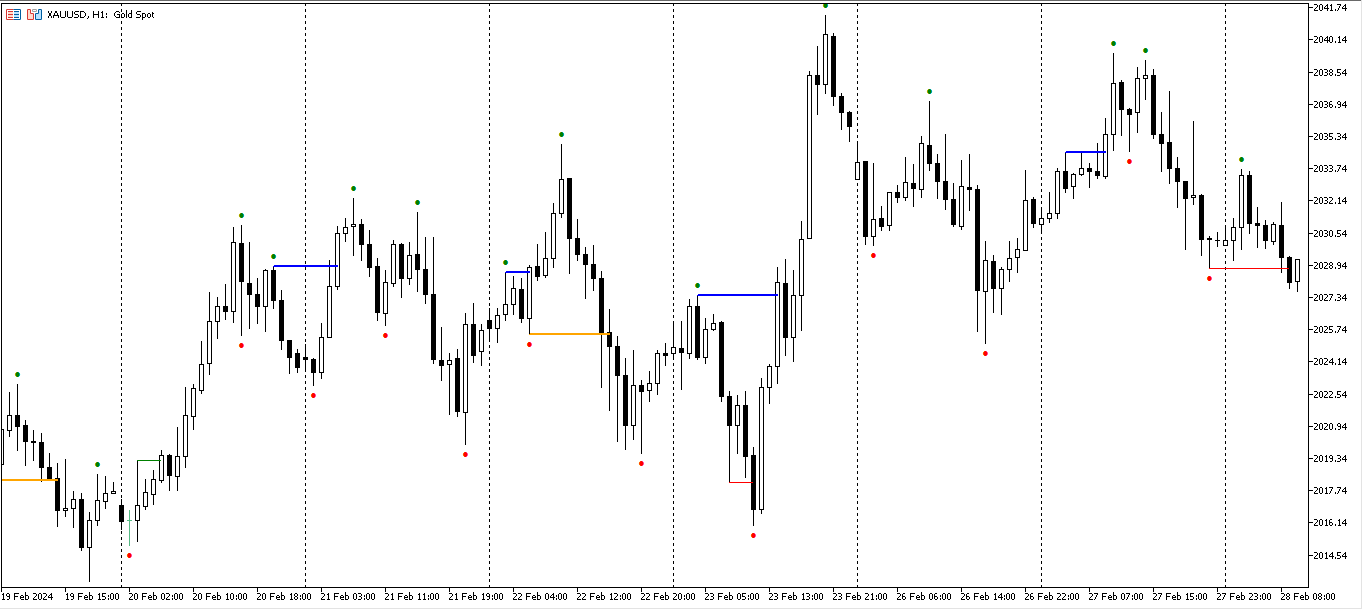
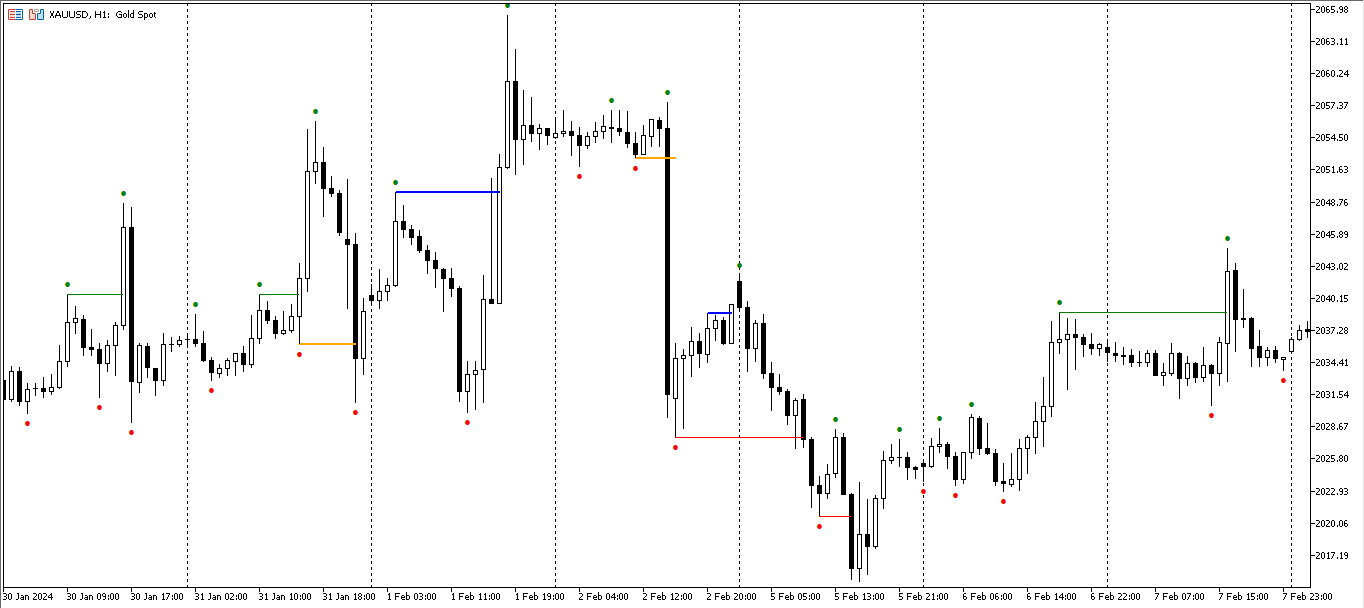
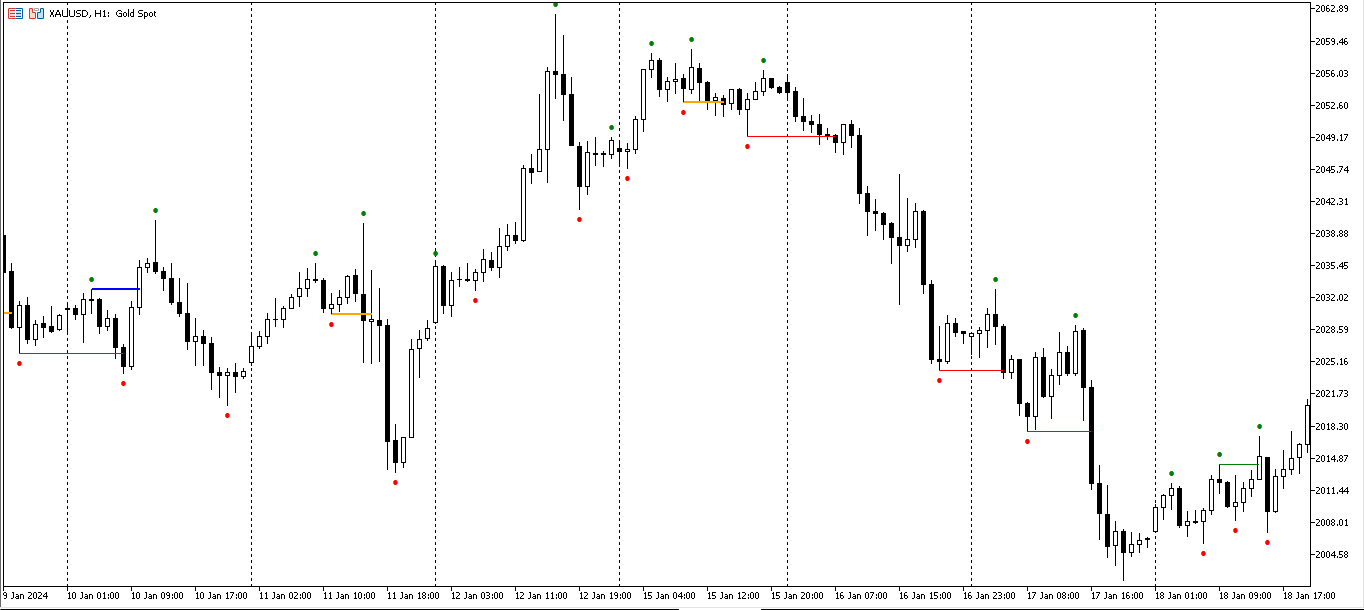
The Break of Structure (BoS) and Change of Character indicator is a powerful tool designed to identify key turning points in price movements on financial charts. By analyzing price action, this indicator highlights instances where the market shifts from a trend to a potential reversal or consolidation phase.
Utilizing sophisticated algorithms, the indicator identifies breakouts where the structure of price movement undergoes significant changes. These breakouts, known as Break of Structure (BoS), often signal the end of a prevailing trend or the emergence of a new one. Additionally, the indicator detects shifts in market sentiment, known as Change of Character, providing traders with valuable insights into potential shifts in market dynamics.
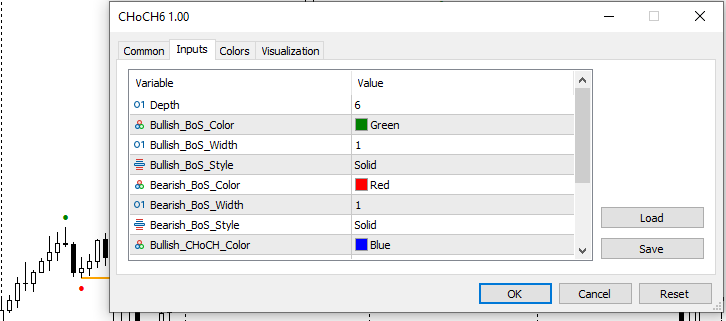
With customizable parameters and clear visual signals, the BoS and Change of Character indicator empowers traders to make informed decisions based on shifts in price behavior. Whether used in conjunction with other technical analysis tools or as a standalone indicator, it serves as a valuable asset for traders seeking to anticipate and capitalize on market reversals and trend changes.