• 概述
  • 评论
  • 评论

Smart Delta Volume

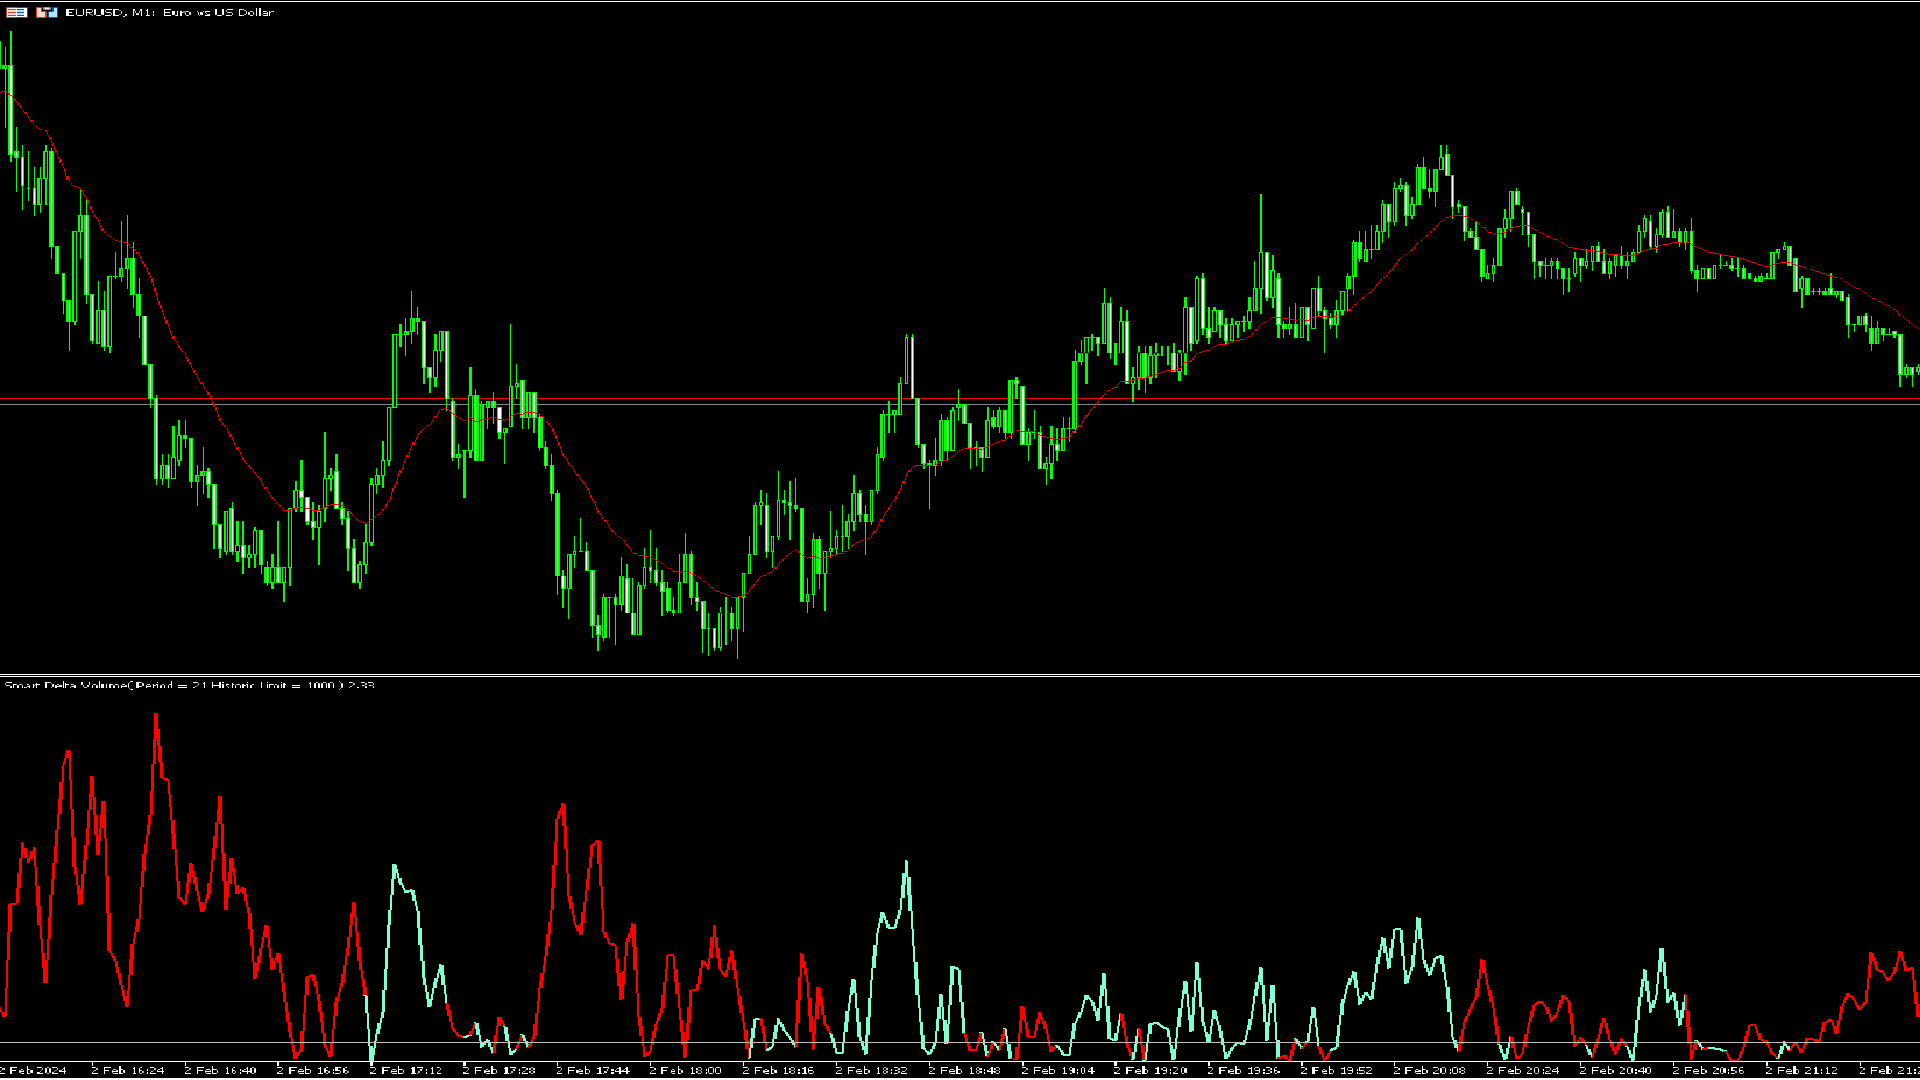
Smart Delta Volume利用根据市场波动性自动调整的动态水平。这一特性确保了更准确、更适应实时市场变化的分析。具备动态调整能力,Smart Delta Volume提供了更全面、更可靠的交易量和价格行为视角。

此外,Smart Delta Volume还配备了一个回撤验证器,当价格超过两个动态水平时触发。这一条件确认了回撤的有效性,并增强了对已识别趋势的信心。对于交易者来说,这种回撤的客观验证至关重要,因为它有助于避免虚假信号,做出更明智、更安全的交易决策。

凭借其准确识别交易机会、适应不断变化的市场条件,以及对趋势和回撤的客观确认,Smart Delta Volume指标在经验丰富的交易员技术分析工具中脱颖而出,成为一种宝贵的工具。
推荐产品
UGenesys Volume MT5
Odaine Ramon Mcmillan
50% Off Today Only! Price Goes Back Up at 11 PM (EST) uGenesys Volume Indicator: Your Key to Mastering Market Volume Analysis What Traders Are Saying: "A must-have indicator...really a game-changer." – wuzzy66 "Amazing indicator...strongly recommend to beginners." – joinbehar Understanding Market Volume:   Volume in the market is a critical indicator of movement and opportunity. The uGenesys Volume Indicator is specially crafted to pinpoint when the market has the most volume, allowing you t
Defense Line
Silvio Marcos Garcia
Indicator that determines very accurately "future" where BUYERS and SELLERS will defend their positions. DOES NOT use moving averages, Fibonacci or any other underlying indicators. SIMPLE AND EFFICIENT !! In these defense regions "DEFENSE LINE" is the best region for decision making to buy / sell. 1- Place the indicator on the chart 2 - Move the Vertical lines to the period to be analyzed 3 - The Defense Line will be drawn automatically 4 - To erase the Defense Line, press the
Horizontal Volumes
Vitalii Zakharuk
Horizontal Volumes Indicator - using a histogram, displays the volume of transactions at a certain price without reference to time. At the same time, the histogram appears directly in the terminal window, and each column of the volume is easily correlated with the quote value of the currency pair. The indicator practically does not require changing the settings, and if desired, any trader can figure them out. The volume of transactions is of great importance in exchange trading, usually an in
Breaker Blocks
Navdeep Singh
Market structures, Market balance, Range breakouts This tools helps to identify areas of market ranges, structures and plots colored boxes on breakout of those areas. User is given the option to receive alerts and notifications on the formation of the blocks. The tool has the ability to become an essential part of a technical trading system or even pure price action trading. Usage:- An essential tool for price action or technical traders.  More information in the blog
Trend Monitor VZ MT5
Sergey Ermolov
5 (1)
MT4版本  |   Valable ZigZag指標   |  FAQ 艾略特波浪理論是對金融市場過程的一種解釋,它基於價格圖表上波浪的視覺模型。 根據這個理論,我們可以確切地知道現在市場上盛行的趨勢是向上還是向下。  Valable ZigZag 指標 顯示了 市場的波浪結構 ,並指示了當前時間框架內當前主要趨勢的方向。 為方便起見,Trend Monitor VZ 指標將在圖表上顯示所有時間範圍的趨勢方向,以及您交易的整個貨幣對列表。 在一張圖表上全面了解所有工具的市場狀況,以做出正確的交易決策! Valable ZigZag 指標 非常穩定 ,不會像經典的 ZigZag 那樣經常改變方向,使交易者感到困惑。 這是通過使用分形來繪製指標的波浪來實現的。 Valable ZigZag 指標首先是一個趨勢指標 。 它設定了交易者應該交易的主要方向,Trend Monitor VZ 指標給出了當前市場正在發生的事情的總體思路。 例如: 如果 EURUSD 貨幣對的所有時間範圍內的指標都顯示向上箭頭,則表明上升趨勢已經確立。 現在入市為時已晚,因為很可能市場已經超過了足夠多的點,並且有
CounterTrend 5
Antony Augustine
The indicator shows buy and sell signals.  The " CounterTrend 5 " is designed to recognize profitable counter trend patterns from your chart. Features: The CounterTrend 5 is a Counter-Trend Trading with Simple Range Exhaustion System. Signals based on the daily trading range. The indicator calculates the trading range for the last few days and compare the price movements on short time intervals and generating short term reversal points.  This is a leading indicator. It works on any instruments.
Price update indicator
Mcblastus Gicharu Ndiba
Price update  indicator  — can issue any type of alert when the price reaches certain levels set by a trader. There are three types of price levels: the first one is used when the price rises above certain level (displayed with the green line on the chart), the second one is used when the price falls below certain level (displayed with the red line on the chart), and the third one is used when the price reaches the certain level exactly (displayed with the yellow line). Three alert types include
The Trap Play MT5
Carl Gustav Johan Ekstrom
5 (1)
Trap Play  refers to a market situation where price initially makes a new high or low, luring traders into believing a strong trend is forming. However, the price quickly reverses and invalidates the breakout, trapping those traders who entered positions based on the initial move. This sudden reversal often results in a rapid exit of positions, leading to significant price movement in the opposite direction.  Trap plays  can occur in various financial markets and timeframes and are characterized
With Fixed Range Volume Profile,The traces left by the big players will not go unnoticed by you. Professional   Volume Profile   Indicator reveals Institutional order flow. This advanced market indicator will teach you to spot the buying and selling. Dont want to say more because its well known by most professionals  trader. This Indicator : -  Quickly Identify the Strongest Institutional S/R Zones. - W orks with all Trading Instruments (Forex, Futures, Indexes, Commodities, Stocks, Cryptocur
(加密货币图表) 它带来与您指定的柱线数量一样多的历史记录,并开始直接显示即时数据。 提供在所有时间范围内工作的机会。 允许您使用多个符号。 这个应用程序是一个后台服务。 它下载市场观察屏幕上以“S”开头的所有交易品种的历史记录并显示报价数据。 自动将币安现货实时交易数据传输至MT5。 运行链接中的脚本以使用该程序。 https://www.mql5.com/en/market/product/69000 此程序需要安装。 https://www.mql5.com/tr/market/product/73887 您应该允许来自工具菜单 >> 选项 >> 智能交易系统的 WebRequest 并添加 URL: https://api.binance.com https://fapi.binance.com
Full Pack Moving Average
Yashar Seyyedin
4 (2)
To download MT4 version please click here . Metatrader users are limited to few moving average types. Therefor I decided to create a package consisting of all MAs I knew. This package suggests 12 different types: { SMA, EMA, DEMA, TEMA, WMA, VWMA, SMMA(RMA), HullMA, LSMA, ALMA, SSMA, TMA } You can configure them via input tab. This is a non-repaint indicator with light load. To implement them I referred to standard  libraries of pine script.
FREE
Volume Delta Panel  is a very powerful indicator that read the supply on Market. It calculates the Delta from movement of the price and the difference of BUY volumes and SELL volumes. The Volumes are added to price and normalized to symbol points.  Its special structure allows you to get all Time Frames values available on the platform MT5. Panel can show 50 instruments simultaneously all customizable according to the offer of the Broker. A good observation of this instrument can suggest great
Dimatis Watchtower
Vincent Teddy Rakotomalala
Description: Dimatis Watchtower is a powerful backtesting tool designed for traders seeking for an efficient way to test and optimize their trading strategies on the MetaTrader 5 platform. With a minimalist interface and advanced features, this tool provides an outstanding solution for evaluating the performance of your strategies in various market conditions. Key Features: Backtesting: Perform precise and reliable backtests of your strategies using historical data from your broker directly on M
To get access to MT4 version please click here . Also you can check this link . This is the exact conversion from TradingView: "UT Bot" by "Yo_adriiiiaan". This is a light-load processing indicator. This is a non-repaint indicator. Buffers are available for processing in EAs. All input fields are available. You can message in private chat for further changes you need. Thanks for downloading
To get access to MT4 version please click   here . This is the exact conversion from TradingView: QQE MT4 Glaz-modified by JustUncleL This is a light-load processing and non-repaint indicator. All input options are available. This is not a multi time frame indicator. Buffers are available for processing in EAs. You can message in private chat for further changes you need.
Onion
Nadiya Mirosh
The Onion Trend Indicator is a revolutionary trend trading and market data filtering solution that combines all the important features of a trend tool in one tool! It is great for any trader, be it Forex or binary options. No settings are required, everything is optimized by time and experience, it works effectively both in flat conditions and in trend conditions. The Onion Trend Indicator is a technical analysis tool for financial markets that reflects current deviations in the price of stoc
The new update makes this indicator a complete tool for studying, analyzing and operating probabilistic patterns. It includes: On-chart Multi-asset percentage monitor. Configurable martingales. Twenty-one pre-configured patterns, including Mhi patterns and C3. An advanced pattern editor to store up to 5 custom patterns. Backtest mode to test results with loss reports. Trend filter. Hit operational filter. Martingale Cycles option. Various types of strategies and alerts. Confluence between patter
Non-lagging VOLATILITY indicator A radical modification of the ATR indicator, which corrected all of its shortcomings (the picture shows the difference with ATR). The indicator shows the swing size of the current market movement. Features: does not have a time window period, i.e. any subjective settings non-delayed, the extremums of the indicator always coincide with the extremum of the price (note the picture) is normalized by means of a color solution, i.e. it has the properties of an oscillat
Candle Good Setup
Kibalo Alain Kabissa
You ask yourself the question every time you open your charts: how to win in trading? Will using a lot of indicators work? well know that I also asked myself the same questions when I first started trading. After testing many indicators, I realized that winning trading is simple and accurate trading. after several months of thinking and optimizing I was able to find my solution: Candle Good Setup Candle Good setup is a trend and entry timing indicator analyzing the market in multi-frame to give
Auto Anchored VWAPs
Francisco Gomes Da Silva
揭示交易见解与自动锚定VWAP: 自动锚定VWAP 是您在交易世界中的指导伙伴。这些指标能够精准地定位市场关键转折点,并使用VWAP线在您的图表上进行标记。这对于采用锚定VWAP策略的交易者来说是一个改变游戏规则的工具。 它如何工作? 识别高点: 如果当前蜡烛的最高价格低于前一蜡烛的最高价格, 并且前一高点高于之前的高点, 我们就识别出了一个峰值。 这个重要的点位于这三根蜡烛的中间位置。 识别低点: 如果当前蜡烛的最低价格高于前一蜡烛的最低价格, 并且前一低点低于之前的低点, 我们就发现了一个底部。 这个底部的中心是我们的关注点。 绘制锚定VWAP: 每个顶部和底部都对应一个VWAP线。但有一个限制:由于指标的计算需求,图表上一次只能显示8条线。 随着更多的线条出现,旧线条让位给新线条。如果一个新的锚定VWAP线关闭,它将再次为旧的锚定VWAP线打开路径。 您有权掌控!根据您的节奏调整“时间框架”设置。请记住,在确认峰值或低谷之前,等待您选择的时间框架的蜡烛关闭。需要三根蜡烛来确认它们,我们会指向中间的那一根。 为了更平稳地交易,保持“当前时间框架”设置。如果您喜欢历史分析,请选择“更
!! FLASH SALE !!   Over 80% off !!     For ONE week only. Now only $47 - normally $297! Buy And Sell Arrows On The Chart When The Trend Is About To Continue. Sends Alerts – On MT5 To Your Phone To Your Email. Does not repaint. Works on any pair, any timeframe.   (Just ajust the settings for your pair and timeframe.) 10 Activations allowed so you are free from limitations See an example of alerts from today (23 May 2020) using this and 2 other indicators  here . MT4 version here.
Trend Forecaster
Alexey Minkov
5 (6)
The Trend Forecaster indicator utilizes a unique proprietary algorithm to determine entry points for a breakout trading strategy. The indicator identifies price clusters, analyzes price movement near levels, and provides a signal when the price breaks through a level. The Trend Forecaster indicator is suitable for all financial assets, including currencies (Forex), metals, stocks, indices, and cryptocurrencies. You can also adjust the indicator to work on any time frames, although it is recommen
Trend is real
Ivan Simonika
Despite the apparent simplicity of the indicator, inside it has complex analytical algorithms with which the system determines the moments of inputs. The indicator gives accurate and timely signals to enter and exit the transaction that appear on the current candle. The main purpose of this indicator is to determine the moments of entry and exit from transactions, therefore, the Trend Revers indicator will display only the trend line and entry points, that is, displays the entry points to the
BinaWin NoTouch
Juan Fernando Urrego Alvarez
BinaWin NoTouch is an indicator that sends an alert signal when the trade is in the right position to wait for the breakdown of a side market. It is specially designed to trade under the “No Touch” strategy of the Binary.Com platform with synthetic indexes N.10, N.25, N.50, N.75 and N.100 Similarly, trading can be done with the conventional CALL and PUT strategy of any Binary Options platform. Requirements to use the indicator: 1. Have an account at Binary.Com 2. Configure the Binary.
FREE
該指標基於人工智慧,透過讀取足跡來識別可能的市場反轉點,並在市場小幅波動發生之前提前發出訊號。 與價格和成交量指標不同的是,價格和成交量指標會產生「後期」入場,即當價格或成交量在方向變化時已經發生確認,因此通常運動已經結束,該指標根據其在圖表中讀取的內容發出信號。足跡,“當運動應該發生時”,因此提供了在運動開始時立即進入市場的可能性。 它不僅產生反轉訊號,而且還產生已經持續的趨勢的延續訊號。 由於人工智慧,該指標讀取市場上每個層級實際執行的合約(而不是帳簿中等待執行的合約,這些合約在執行前透過演算法交易刪除)。 該指標能夠區分以買價和賣價執行的合約(因此本質上識別激進訂單和被動訂單)、它們在市場上執行的頻率和激進程度(因此它檢測大型運營商“推動”的意圖)市場在某個方向上)並識別(由於資料流)“ICEBERG”訂單,即大訂單被分割成小塊以“隱藏”訂單的大小,但始終屬於同一運營商。 它還根據所簽訂的合約認識到耗盡和吸收階段,這會產生價格逆轉。 當這些條件中的一個或多個同時發生時,指標在幾毫秒內處理完這些條件後,會立即產生「多頭或空頭」入場訊號,發出聲音警告並在圖表上沿該方向繪製箭頭。
Order Block Detector
Cao Minh Quang
5 (2)
Automatically detect bullish or bearish order blocks to optimize your trade entries with our powerful indicator. Ideal for traders following ICT (The Inner Circle Trader). Works with any asset type, including cryptocurrencies, stocks, and forex. Displays order blocks on multiple timeframes, from M2 to W1. Alerts you when an order block is detected, migrated, or a higher timeframe order block is created/migrated. Perfect for both scalping and swing trading. Enhanced by strong VSA (Volume Spread A
Basic Volume Profile MT5
Mehran Sepah Mansoor
使用我们的 Metatrader 交易量曲线指标,探索交易量分析的威力!  /   MT4 版本 基本成交量曲线是专为希望优化交易的手动交易者设计的指标。对于任何希望更好地了解市场行为的严肃交易者而言,成交量曲线指标都是必不可少的工具。利用我们的创新解决方案,您可以清晰、简明地直观了解交易量在不同价格间的分布情况。这样,您就可以确定关键的关注区域,如支撑位和阻力位、累积区和分布区以及重要的控制点。与显示特定日期交易量的普通交易量指标不同,Basic Volume Profile 显示的是特定价格的交易量。 我们的指标具有直观和可定制的界面,让您可以根据自己的交易偏好进行调整。 特点 在价格图表上清晰显示成交量概况。 快速识别高低成交量活动区域。 完全自定义颜色和样式,以适应您的交易风格。 支持多时段综合分析。 专门的技术支持,确保体验顺畅。 配置参数 指标设置 Number of histograms:   要显示的成交量条数 Profile position:     是否希望在第一根蜡烛或侧面显示成交量曲线 Color mode:     是否希望将成交量曲线分为
RSIScalperPro
PATRICK WENNING
介绍 RSIScalperPro - 这款基于 RSI 指标的革命性交易指标适用于 MetaTrader 5,专为一分钟图表的剖刺交易而设计。借助 RSIScalperPro,您将拥有一个强大的工具箱,用于精确的入场和出场信号,提升您的交易水平。 RSIScalperPro 使用两种不同的 RSI 指标,为超买和超卖区域提供清晰的信号。您可以根据自己的偏好自定义两个 RSI 的时间周期和限制值,以实现您的交易策略的最佳效果。图表上的明显箭头使您可以轻松识别何时进入或退出交易。 RSIScalperPro 的另一个亮点是三个可自定义的移动平均线,帮助您识别趋势方向并确认强大的交易信号。这使您可以早早发现趋势并参与到盈利交易中。 此外,您可以设置 RSIScalperPro 发出每个新交易信号的听觉警报。这样,即使您不经常坐在计算机屏幕前,也不会错过任何重要的交易机会。 RSIScalperPro 提供用户友好的界面,并且在 MetaTrader 5 中很容易插入和配置。您可以根据个人交易偏好自定义指标,并利用其多样化的功能,提高交易成果。 利用 RSIScalperPro 的优势,提高
This easy to setup indicator shows you the market volumes in a different way, with support and resistance as showed. You can setup: - Backdays volume to show - Heiken Ashi candle view It works for every kind of graph and every kind of period. The program shows the volumes based on the number of candles displayed in the chart: the more candles the more volumes. Enjoy this very useful indicator. Please feel free to message me to report any kind of improvements! :D
Harmonic Pro
Kambiz Shahriarynasab
Only 5 copies of the EA at $30! Next price --> $45 Find charts and signals based on harmonic patterns, which work great in 1-hour timeframes and up. Buy and sell signs based on different harmonic patterns as follows: 0: ABC_D 1: ABCD_E 2: 3Drive 3: 5_0 4: Gartley 5: Bat 6: Crab 7: Butterfly 8: Cypher 9: NenStar 10: Shark 11: AntiBat 12: AntiGartley 13: AntiCrab 14: AntiButterfly 15: AntiCypher 16: AntiNenStar 17: AntiShark How to use: When there is an opportunity to
该产品的买家也购买
Atomic Analyst MT5
Issam Kassas
4.78 (18)
首先值得强调的是,该交易指标是非重绘、非延迟的指标,这使其成为手动和机器人交易的理想选择。 用户手册:设置、输入和策略。 Atomic Analyst是一种PA价格行动指标,利用价格的力量和动量来寻找市场上更好的机会。配备了高级过滤器,可帮助去除噪音和假信号,并提高交易潜力。使用多层复杂的指标,Atomic Analyst扫描图表,并将复杂的数学计算转化为任何初学者都能理解并用来做出一致交易决策的简单信号和颜色。 “Atomic Analyst”是专为新手和经验丰富的交易者量身定制的综合交易解决方案。它将高级指标和一流功能融合为一体的交易策略,使其成为所有类型交易者的多功能选择。 日内交易和剥头皮策略:专为快速准确的日内交易和短期交易而设计。 日内和摆动交易策略:可用作追求价格大幅波动的日内和摆动交易者的可靠工具。 多货币和市场:凭借其可靠的精度,在不同的工具和市场上运作。 多个时间框架:可在多个时间框架上使用,性能良好。 稳定性:所有指标均不重绘、不重绘和不滞后,确保可靠的信号。 信号清晰度:提供箭头信号,用于清晰的入场和出场点。 实时警报:通过交易入场、SL和TP警报通知交
首先,值得强调的是,这个交易系统是一个非重绘、非重画和非滞后的指标,这使得它非常适合手动和机器人交易。 在线课程,手册和下载预设。 “智能趋势交易系统 MT5”是专为新手和经验丰富的交易者量身定制的综合交易解决方案。它结合了超过 10 个优质指标,具有 7 多个强大的交易策略,使其成为适用于各种市场条件的多功能选择。 趋势跟随策略:提供精确的入场和止损管理,以有效地跟随趋势。 反转策略:识别潜在的趋势反转,使交易者能够利用区域市场的机会。 剃头策略:专为快速准确的日内交易和短期交易而设计。 稳定性:所有指标都不会重绘、不会重画和不会滞后,确保可靠的信号。 定制:支持自定义策略,以满足个人交易偏好。超过 7 种策略和组合可帮助您找到最佳策略。 信号清晰度:提供箭头信号,以指示清晰的入场和退出点。 实时警报:通过交易进出警报使交易者保持了解。 深入分析:提供更高时间框架的趋势分析和实时交易监控。 自适应颜色编码:利用蜡烛颜色编码来显示成交量、趋势和反转蜡烛信号。通过蜡烛颜色分析市场方向。 “智能趋势交易系统 MT5”赋予交易者必要的工具,以便在各种市场条件下做出明智和战略性的交易决策。无论
Quantum Trend Sniper
Bogdan Ion Puscasu
4.92 (48)
介绍   量子趋势狙击指标 ,突破性的 MQL5 指标,正在改变您识别和交易趋势反转的方式!由拥有超过13年交易经验的资深交易员团队开发,     量子趋势狙击指标   旨在通过其创新的方式以极高的准确度识别趋势反转,将您的交易之旅推向新的高度。 ***购买量子趋势狙击指标,即可免费获得量子突破指标!*** 当量子突破指标识别出趋势反转时,它会向您发出警报和信号箭头,并建议您三个止盈水平。 它既适合新手交易者,也适合专业交易者。 量子 EA 通道:       点击这里 MT4版本:       点击这里 建议: 时间范围: 所有时间范围。为了获得最佳结果,我们建议在 M15、M30 和 H1 时间范围内使用它。 货币对:欧元兑美元、英镑兑美元、澳元兑美元、欧元兑英镑、, EURAUD,  XAUUSD 账户类型:ECN、Raw 或 Razor,点差极低 经纪时间:任意 经纪商:IC Markets、Pepperstone with Raw 和 Razor 的点差最低 建议止损:50 点 建议止盈水平:20 点、50 点和
Entry Points Pro for MT5
Yury Orlov
4.55 (160)
这款指标用于 MT5,可提供准确的入场交易信号,且无重绘。 它可应用在任何金融资产:外汇、加密货币、贵金属、股票、指数。 它将提供极其精准的评估,并告诉您何时开仓和平仓的最佳时机。 观看 视频 (6:22),其中包含一个仅处理单一信号的示例,该信号即可值回指标购价! 大多数交易者在 Entry Points Pro 指标的帮助下,在第一个交易周内即改善了他们的交易结果。 订阅我们的 Telegram 群 ! Entry Points Pro 指标的益处。 入场信号无重绘 如果信号出现,并得到确认,则它不会再消失;不像是重绘指标,它会导致重大的财产损失,因为它们可以在显示信号后再将其删除。 无差错开仓 指标算法可令您找到入场交易(买入或卖出资产)的理想时机,从而提高每位交易者的成功率。 Entry Points Pro 可操作任何资产 它允许您在 MT5 平台上交易任何经纪商的加密货币、股票、贵金属、指数、大宗商品和货币。 提供任何方向的信号 Entry Points Pro 指标提供针对任意价格走势的入场交易信号 - 上涨、下跌或横盘(横向)。
首先,值得强调的是,这个交易工具是非重绘、非重画和非滞后的指标,非常适合专业交易。 在线课程,用户手册和演示。 智能价格行动概念指标是一个非常强大的工具,既适用于新手,也适用于经验丰富的交易者。它将超过20个有用的指标合并到一个指标中,结合了高级交易思想,如内圈交易员分析和智能资金概念交易策略。该指标侧重于智能资金概念,提供有关大型机构交易方式的见解,帮助预测它们的动向。 它在流动性分析方面尤其擅长,有助于理解机构的交易方式。它擅长预测市场趋势,并仔细分析价格波动。通过将您的交易与机构策略对齐,您可以更准确地预测市场走向。该指标多才多艺,擅长分析市场结构,识别重要的订单区块,并识别各种模式。 它擅长识别BOS和CHoCH等模式,理解动量的转变,并突出显示供需强劲的关键区域。它还擅长发现强大的不平衡,并分析价格创造更高高点或更低低点的模式。如果您使用斐波那契回撤工具,该指标可以满足您的需求。它还可以识别相等的高点和低点,分析不同的时间框架,并通过仪表板显示数据。 对于使用更高级策略的交易者,该指标提供了工具,如公平价值差指标和优惠和折扣区域的识别。它特别关注高时间框架订单
FX Power MT5 NG
Daniel Stein
5 (6)
通过 mql5 和 Telegram 上 的晨间简报获取每日市场更新,包括详细信息和屏幕截图 ! FX Power MT5 NG 是我们长期以来非常受欢迎的货币强度计算器 FX Power 的下一代产品。 这款下一代强度计算器能提供什么?您所喜爱的原版 FX Power 的所有功能 附加功能 黄金/XAU 强度分析 更精确的计算结果 可单独配置的分析周期 可自定义计算限制,以获得更好的性能 为希望查看更多信息的用户提供特殊的多实例设置 无尽的图形设置,可在每个图表中设置您最喜欢的颜色 无数的通知选项,让您再也不会错过任何重要信息 采用 Windows 11 和 macOS 风格的全新圆角设计 神奇的移动指标面板 FX Power 主要功能 所有主要货币的完整强势历史 所有时间框架内的货币强弱历史 所有经纪商和图表的计算结果完全相同 100% 可靠的实时计算 -> 无重绘 可通过下拉列表选择分析时段 通过自定义模式单独配置分析时段 可在一个图表中使用多个实例 可移动 FX Power 显示屏(通过拖放) 适用于高分辨率 QHD、UHD 和 4K 显示器 自动终端配置 针对平板电脑
AT Forex Indicator MT5
Marzena Maria Szmit
5 (4)
The AT Forex Indicator MT5 is a sophisticated trading tool designed to provide traders with a comprehensive analysis of multiple currency pairs. This powerful indicator simplifies the complex nature of the forex market, making it accessible for both novice and experienced traders. AT Forex Indicator uses advanced algorithms to detect trends, patterns and is an essential tool for traders aiming to enhance their forex trading performance. With its robust features, ease of use, and reliable signal
FX Volume MT5
Daniel Stein
4.94 (17)
通过 mql5 和 Telegram 上 的 " 晨间简报 "获取每日市场更新,包括详细信息和屏幕截图 ! 外汇交易量(FX Volume)是第一个也是唯一一个从经纪商角度真正洞察市场情绪的交易量指标。 直接在您的图表上看到这些信息是真正改变游戏规则和突破性的交易解决方案。 受益于独特的市场数据洞察,如 比率(Ratios )显示货币多头和空头头寸的比率(百分比 比率变化 显示所选时间段内的多头比率及其百分比变化 总交易量 显示货币的总交易量(多头和空头),以手为单位 多头 交易量显示货币所有多头头寸的交易量 空头 交易量显示所有货币空头头寸的交易量 净多头 显示净多头交易量,即所有多头头寸减去所有空头头寸(以手为单位)。 净多头百分比 显示货币净多头交易量的变化 请阅读我们的基本教程 -> "如何使用外汇交易量进行交易 " 获取更多信息,如常见问题、交易技巧和教程视频,请访问我们的 外汇交易量公共信息频道 请 安装并运行 SI Connect 以建立与我们数据中心的持续连接 背景信息 我们都知道,外汇是一个分散的市场。这就是为什么我们必须打破常规思维,开发一个独
该仪表盘显示所选符号的最新可用谐波形态,因此您可以节省时间并提高效率 /  MT4 版本 。 免费指标:  Basic Harmonic Pattern 指标列 Symbol:   显示所选符号 Trend:     看涨或看跌 Pattern:    形态类型(Gartley、蝴蝶、蝙蝠、螃蟹、鲨鱼、Cypher 或 ABCD) Entry:     入口价格 SL: 止损价 TP1: 第一止盈价 TP2: 第二次获利价格 TP3: 第三次获利价格 Current price:    当前价格 Age (in bars):   最后绘制的模式的年龄 主要输入 Symbols :   从 "28 种主要货币对 "或 "选定符号 "中选择。 Selected Symbols :   希望监控的符号,用逗号分隔("EURUSD,GBPUSD,XAUUSD")。如果您的经纪商为货币对设置了后缀或前缀,您必须在以下两个参数中添加(货币对前缀或货币对后缀)。 Max Iteration:   调整模式的最大迭代次数(如果该值越小,则模式越少,性能越快;如果该值越大,则模式越多,性能
TPSpro RFI Levels MT5
Roman Podpora
5 (8)
Reversal First Impulse levels (RFI)      INSTRUCTIONS        RUS       -       ENG              R ecommended to use with an indicator   -   TPSpro  TREND PRO -  Version MT4                 A key element in trading is zones or levels from which decisions to buy or sell a trading instrument are made. Despite attempts by major players to conceal their presence in the market, they inevitably leave traces. Our task was to learn how to identify these traces and interpret them correctly. Main functi
Trend Screener Pro MT5
STE S.S.COMPANY
4.88 (66)
使用趋势筛选指标释放趋势交易的力量:由模糊逻辑和多货币系统提供支持的终极趋势交易解决方案! 使用趋势筛选器(由模糊逻辑提供支持的革命性趋势指标)提升您的趋势交易。 它是一个强大的趋势跟踪指标,结合了超过 13 种高级工具和功能以及 3 种交易策略,使其成为使您的 Metatrader 成为趋势分析器的多功能选择。 限时优惠:趋势筛选指标终身仅需 50 美元。 ( 原价 125$ ) (优惠延长) 体验趋势筛选器 100% 无需重新绘制的准确性,确保您的交易决策不受过去价格变化的影响。 释放多时间框架和多货币功能的多功能性,使您能够以无与伦比的信心在外汇、商品、加密货币和指数领域进行交易。 利用 Trend Screener 的综合策略套件增强您的交易: - 趋势跟踪策略和趋势延续策略 :趋势筛选器的趋势跟踪策略提供清晰的趋势延续信号,让您有效捕捉趋势走势并管理风险。 - 反转策略和早期入场点策略 :趋势筛选器的反转策略可检测市场方向的潜在变化,使您能够预测趋势反转并利用疲弱的市场趋势。通过早期入场点,您可以在潜在的趋势变化之前定位自己 获取可观的利润。 - 倒卖策略: 趋势筛选器的倒卖
介绍     Quantum Breakout PRO   ,突破性的 MQL5 指标,正在改变您交易突破区域的方式!由拥有超过13年交易经验的资深交易员团队开发,     量子突破 PRO     旨在通过其创新和动态的突破区域策略将您的交易之旅推向新的高度。 量子突破指标将为您提供带有 5 个利润目标区域的突破区域的信号箭头,以及基于突破框的止损建议。 它既适合新手交易者,也适合专业交易者。 量子 EA 通道:       点击这里 重要的!购买后请私信我领取安装手册。 建议: 时间范围:M15 货币对:GBPJPY、EURJPY、USDJPY、NZDUSD、XAUUSD 账户类型:ECN、Raw 或 Razor,点差极低 经纪商时间:GMT +3 经纪商:IC Markets、Pepperstone with Raw 和 Razor 的点差最低 规格: 不重漆! 最多 5 个建议利润目标区域 建议止损水平 可定制的盒子。您可以设置自己的 Box Time Start 和 Box Time End。 接触 如果您有任何疑问或需要帮
Trend Sensor MT5
Yuriy Lyachshenko
该指标显示最合适的进入和退出点。它还显示所有信号的统计数据,以便更好地分析交易。 在这个指标的帮助下,你将能够更好地了解市场。 一旦趋势的力量开始减弱(这将显示在面板上),趋势线将引向水平位置 - 这是退出交易的信号。或者你可以在达到平均/中值利润水平时退出。 该指标是我自2010年以来的交易经验的结晶。 MT4的指标版本 特点 这个指标不会重新绘制。印在历史图表上的东西也将被实时打印出来。 它可以用于交易任何资产:加密货币、股票、金属、指数、商品和货币。 在所有的时间框架上都可以工作。 进入的信号出现在新蜡烛的开端。 退出交易的信号是暂定的,因为通常你可以用更大的利润关闭交易。 在左上方有一个详细的交易统计面板,它可以被最小化。 在M1到W1的时间框架上,一次显示趋势的方向和它的力量。 有一个轻量级的代码,所以它不需要加载,也不会降低终端的速度。 使用一个特殊的公式计算移动平均线,它决定了趋势的方向。 为了不错过交易的信号,你可以在警报窗口和推送中收到通知。 适用于所有级别的用户,从初学者到专家。 统计小组 取自信号历史的天数。 提供统计的信号总数。 盈利和亏损信号
PZ Day Trading MT5
PZ TRADING SLU
2.83 (6)
该指标仅使用价格行为分析和donchian渠道以锯齿形检测价格反转。它是专门为短期交易而设计的,根本不需要重新粉刷或补漆。对于精明的交易者来说,这是一个绝佳的工具,旨在增加他们的运作时间。 [ 安装指南 | 更新指南 | 故障排除 | 常见问题 | 所有产品 ] 极易交易 它在每个时间段都提供价值 实施自我分析统计 它实现了电子邮件/声音/视觉警报 基于可变长度的突破和拥挤区域,该指标仅使用价格行为来选择交易并对市场快速做出反应。 显示过去信号的潜在利润 该指标分析其自身的质量和性能 突围的损失突出显示并解决 该指标是不可重涂和不可重涂的 该指标将帮助盘中交易者不要错过单个价格反转。但是,并非所有价格反转都是一样的,也不是具有相同的可行质量。决定要突破哪些突破而忽略哪些取决于交易者的良好判断。 如何解释统计数据 该指标研究其自身信号的质量,并在图表上绘制相关信息。将分析每笔交易,并在图表的左上角显示总体历史结果,这使您可以针对任何给定的工具和时间范围自行优化指标参数。每个乐器和时间表都有其自己的最佳设置,您可以自己找到它们。 最大优惠交易:对于任何给定的交易,MFE都是
PZ Trend Trading MT5
PZ TRADING SLU
3.67 (3)
许多盈利交易者不仅知道如何识别市场趋势,而且也能把握趋势建立后的交易机会。 Pz 趋势交易 指标设计用来在趋势行情中尽可能的赚取利润。 已建立的趋势提供了一揽子交易机会,但大多数趋势交易指标完全忽视了它们,让交易者在趋势行情时完全不知道该如何做!一般趋势指标只通知有关的趋势变化,但根本不足以得到卓越的回报. Pz 趋势交易 指标比一般趋势指标显示多达 20 倍的交易 , 因为它注重所谓的市场时机。它不仅显示当前的市场趋势,也有回调,内柱线的突破和调整。它令您在趋势回调之后介入,安全的柱线内突破金字塔加仓,以及发现潜在的反转,和已知的调整。 趋势改变 一个趋势改变在市场方向变化时发生。趋势变化在图表上用带数字的彩色圆圈显示。蓝色 (1) 信号为上涨开始, 而红色 (1) 信号为下跌开始。趋势变化并非评估当前价格动作的结果, 它意味着交易设置是不定时地。如果您正确使用本指标, 在趋势变化时, 您将将已经入场 (参看下面的调整)。 回调 但凡趋势在运动中,行情上下抖动,盈利者收割利润,且其它参与者入场。趋势回调代表好的买入机会,通常是由主力获利离场导致。如果行情在回调后回归上行, 指
该仪表盘可根据您对所选符号的交易策略,以剥头皮和长期模式在图表上发现并显示供需区。此外,仪表盘的扫描模式可帮助您一目了然地检查所有需要的符号,不错过任何合适的仓位/ MT4 版本 免费指标: Basic Supply Demand 功能 允许您查看多个货币对的交易机会,为您提供所有货币对的清晰简明视图,并根据其与供需区的接近程度进行排序 可定制设置,从颜色到检测参数,满足您的特定需求 主要输入 Indicator mode : 选择指标模式或具有新功能的面板模式 Symbols : 从 "28 种主要货币对 "或 "选定符号 "中进行选择 Selected Symbols : 您希望监控的符号,用逗号分隔("EURUSD,GBPUSD,XAUUSD")。如果您的经纪商对货币对有后缀或前缀,您必须在以下两个参数中添加(货币对前缀或货币对后缀) Trading Style : 选择剥头皮或长期模式 Allowed Deviation : 该参数允许修改需求或供应区域的精确度(数值越小,精确度越高) Zone   thickness : 通过该参数可以修改需求和供应
ICT, SMC, SMART MONEY CONCEPTS, SMART MONEY, Smart Money Concept, Support and Resistance, Trend Analysis, Price Action, Market Structure, Order Blocks, BOS/CHoCH,   Breaker Blocks ,  Momentum Shift,   Supply&Demand Zone/Order Blocks , Strong Imbalance,   HH/LL/HL/LH,    Fair Value Gap, FVG,  Premium  &   Discount   Zones, Fibonacci Retracement, OTE, Buy Side Liquidity, Sell Side Liquidity, BSL/SSL Taken, Equal Highs & Lows, MTF Dashboard, Multiple Time Frame, BigBar, HTF OB, HTF Market Structure
Blahtech Supply Demand MT5
Blahtech Limited
4.54 (13)
Was: $299  Now: $99   Supply Demand uses previous price action to identify potential imbalances between buyers and sellers. The key is to identify the better odds zones, not just the untouched ones. Blahtech Supply Demand indicator delivers functionality previously unavailable on any trading platform. This 4-in-1 indicator not only highlights the higher probability zones using a multi-criteria strength engine, but also combines it with multi-timeframe trend analysis, previously confirmed swings
Matrix Arrow Indicator MT5
Juvenille Emperor Limited
5 (14)
矩阵箭头指标 MT5   是一种独特的 10 合 1 趋势,遵循   100% 非重绘多时间框架指标 ,可用于所有符号/工具: 外汇 、 商品 、 加密货币 、 指数 、 股票 。 Matrix Arrow Indicator MT5 将在其早期阶段确定当前趋势,从多达 10 个标准指标中收集信息和数据,它们是: 平均定向运动指数 (ADX) 商品渠道指数 (CCI) 经典 Heiken Ashi 蜡烛 移动平均线 移动平均收敛散度 (MACD) 相对活力指数 (RVI) 相对强弱指数 (RSI) 抛物线SAR 随机振荡器 威廉姆斯的百分比范围 当所有指标给出有效的买入或卖出信号时,相应的箭头将打印在图表上,在下一根蜡烛/柱线开盘时,指示强劲的上升趋势/下降趋势。用户可以选择使用哪些指标,并可以单独调整每个指标的参数。 Matrix Arrow Indicator MT5 仅从选定的指标中收集信息,并仅根据其数据打印箭头。   Matrix Arrow Indicator MT5   还可以为所有新信号发送终端、推送通知或电子邮件警报。无论您是黄牛、日内交易者还是波段交易者, Mat
Auto Order Block with break of structure based on ICT and Smart Money Concepts (SMC) Futures Break of Structure ( BoS )             Order block ( OB )            Higher time frame Order block / Point of Interest ( POI )    shown on current chart           Fair value Gap ( FVG ) / Imbalance   -  MTF      ( Multi Time Frame )    HH/LL/HL/LH  -  MTF      ( Multi Time Frame )  Choch  MTF      ( Multi Time Frame )  Volume Imbalance     ,  MTF          vIMB Gap’s Power of 3 Equal High
MTF Supply Demand Zones MT5
Georgios Kalomoiropoulos
下一代自动化供需区。适用于任何图表的创新算法。所有区域都是根据市场的价格行为动态创建的。 两种类型的警报 --> 1) 当价格触及区域时 2) 当新区域形成时 你不会再得到一个无用的指标。您将获得一个完整的交易策略和经过验证的结果。     新的功能:     价格触及供需区时发出警报     创建新的供应/需求区时发出警报     推送通知警报     以点为单位的区域宽度标签     关于 MTF 的又一个时间表。因此,现在您将能够看到高于当前 3 个时间帧,而不是高于当前 2 个时间帧     启用/禁用警报/区域/MTF 功能的按钮 您获得的优势:     消除交易中的情绪。     客观化您的交易条目。     通过高概率设置提高您的利润。     节省绘图区域的时间。     像专业人士一样交易金融市场。     任何市场的即时多时间框架分析。 你在图表上看到了什么?     蓝色和红色矩形是当前时间范围的供需区。     虚线
Blahtech Market Profile MT5
Blahtech Limited
5 (9)
Was: $249  Now: $99   Market Profile defines a number of day types that can help the trader to determine market behaviour. A key feature is the Value Area, representing the range of price action where 70% of trading took place. Understanding the Value Area can give traders valuable insight into market direction and establish the higher odds trade. It is an excellent addition to any system you may be using. Inspired by Jim Dalton’s book “Mind Over Markets”, this indicator is designed to suit the
Volume by Price MT5
Brian Collard
3.6 (5)
The Volumebyprice.com Indicator for MetaTrader 5 features Volume Profile and Market Profile TPO (Time Price Opportunity). Volume and TPO histogram bar and line charts. Volume Footprint charts. TPO letter and block marker collapsed and split structure charts. Static, dynamic and flexible range segmentation and compositing methods with relative and absolute visualizations. Session hours filtering and segment concatenation with Market Watch and custom user specifications. Graphical layering, posit
Legacy of Gann for MT5
Pavel Zamoshnikov
5 (6)
The indicator very accurately determines the levels of the possible end of the trend and profit fixing. The method of determining levels is based on the ideas of W.D.Gann, using an algorithm developed by his follower Kirill Borovsky. Extremely high reliability of reaching levels (according to K. Borovsky  - 80-90%) Indispensable for any trading strategy – every trader needs to determine the exit point from the market! Precisely determines targets on any timeframes and any instruments (forex, met
[ MT4 Version ] Only the next 10 units at current price! Final price: $299 Are you tired of spending months on demo or live accounts to test your trading strategies? The Backtesting Simulator is the ultimate tool designed to elevate your backtesting experience to new heights. Utilizing Metatrader historical symbol information, it offers an unparalleled simulation of real market conditions. Take control of your testing speed, test ideas quickly or at a slower pace, and witness remarkable improve
PZ Harmonacci Patterns MT5
PZ TRADING SLU
3.25 (4)
可以说,这是您可以为MetaTrader平台找到的最完整的谐波价格形成自动识别指标。它检测19种不同的模式,像您一样认真对待斐波那契投影,显示潜在的反转区域(PRZ),并找到合适的止损和获利水平。 [ 安装指南 | 更新指南 | 故障排除 | 常见问题 | 所有产品 ] 它检测19种不同的谐波价格形态 它绘制了主要,衍生和互补的斐波那契投影(PRZ) 它评估过去的价格走势并显示每个过去的形态 该指标分析其自身的质量和性能 它显示合适的止损和获利水平 它使用突破来表明合适的交易 它在图表上绘制所有样式比率 它实现了电子邮件/声音/视觉警报 受斯科特·M·卡尼(Scott M. Carney)的书的启发,该指标旨在满足最纯粹和最熟练的交易者的需求。但是,它采取了一种使交易更容易的方式:在向交易发出信号之前,它会等待Donchian朝正确方向突破,从而使交易信号非常可靠。 斐波那契投影与向量无关 它实现了电子邮件/声音/推送警报 它绘制了ABCD投影 重要提示: 为了符合 Scott M. Carney先生 的商标申诉,某些图案名称已重命名为不言自明的替代方式, Scot
TPA True Price Action indicator reveals the true price action of the market makers through 100% non-repainting signals strictly at the close of a candle! TPA shows entries and re-entries, every time the bulls are definitely stronger than the bears and vice versa. Not to confuse with red/green candles. The shift of power gets confirmed at the earliest stage and is ONE exit strategy of several. There are available now two free parts of the TPA User Guide for our customers. The first "The Basics"
XQ Indicator MetaTrader 5
Marzena Maria Szmit
5 (1)
Step into the realm of Forex trading with confidence and precision using XQ, a cutting-edge Forex indicator designed to elevate your trading game to unprecedented heights. Whether you're a seasoned trader or just stepping into the world of currency exchange, XQ Forex Indicator empowers you with the insights and signals needed to make informed trading decisions. The signal conditions are a combination of three indicators, and XQ Forex Indicator only display  medium and long-term trends . The ind
Advanced Supply Demand MT5
Bernhard Schweigert
4.53 (15)
任何新手或专业交易者的最佳解决方案! 该指标是一款独特、高质量、且价格合理的交易工具,因为我们已经整合了许多专有功能和新公式。 依据此更新,您将能够显示双重时间帧区域。 您不仅可以显示一个较高的时间帧,还可以同时显示图表时间帧,加上更高的时间帧:显示嵌套时区。 供需双方所有交易者都会喜欢它。 :) 重要信息披露 高级供需的最大潜力,请访问 https://www.mql5.com/zh/blogs/post/720245   想象您的交易如何得以改善,是因为您能够精准定位入场或目标位吗? 构建于新的底层算法,它可以更轻松地识别出买卖双方之间的潜在失衡。 这是因为它以图形方式展示供需最强劲区域,及其过去的表现(显示旧区域)。 这些功能旨在帮助您更轻松地发现最佳入场区域和价位。 现在您可以针对您的交易品种和时间帧来优化和编辑区域强度! 高级供需指标适用于所有产品和时间帧。 它是一个新的公式,非常新的功能是两个区域强度函数可由用户输入进行调整! 这在交易中是一大优势。 当您学习如何使用专有功能,例如带有价格游离最小 X 因子的区域强度时,您能够判断该区域强劲与否。 供需区域用作警报触发器
作者的更多信息
Master OBV FX
Thalles Nascimento De Carvalho
5 (1)
The MasterOBV indicator is a powerful technical analysis tool that utilizes volume, positive correlation, and a Moving Average (MA) to enhance trend identification in financial markets. By incorporating assets with positive correlation through the indicator menu, MasterOBV provides a refined approach to assessing the strength and direction of trends. The inclusion of the Moving Average adds additional smoothing to price movements, aiding in a more accurate tracking of the underlying trend over
FREE
AI Channel
Thalles Nascimento De Carvalho
4 (4)
Welcome to the presentation of the AI Channel indicator, a powerful tool that uses artificial intelligence for price channel analysis in the financial market. In this session, we will explore how this revolutionary indicator can assist investors and traders in making more informed and strategic decisions. Let's get started! I. What is the AI Channel indicator? AI Channel is an indicator developed based on advanced artificial intelligence algorithms. It utilizes historical price data of financial
FREE
Long Short
Thalles Nascimento De Carvalho
4.67 (3)
Long & Short Indicator, tracks the movements of assets that have positive or negative correlation allowing to explore displacement in advance. - High Hit Rate With Real Time Information. - More Safe Entries in Operations. - Facilitates Short and Long Term Reading. - Option to trigger alert for the Levels. Information for Ea Buffer Symbol 1ª = 0 ;  Buffer Symbol 2ª = 2 ; * Free version only EURUSD! 
FREE
Swing Point Volume
Thalles Nascimento De Carvalho
Swing Point Volume, the indicator that signals weakness and strength at the tops and bottoms. This indicador can be for used the Wyckoff Method. Information provided; - Swing on customized ticks. - Volume and points in each balance sheet. - Percentage of Displacement. - Sound alert option on top and bottom breaks. - Volume in ticks and Real Volume. - Volume HL (extreme) or (opening and closing) - Customized volume shapes.
Atr Projection
Thalles Nascimento De Carvalho
ATR Projection指标在技术分析中脱颖而出,旨在提供有关金融市场潜在价格移动极限的准确见解。其灵活的方法允许用户直观地定制分析指标,以适应每个交易资产的特定需求。 可定制的运行方式: 默认情况下,ATR Projection考虑最近100根蜡烛的平均值的30%。这种灵活性使用户能够根据其偏好和每个资产的独特特征调整指标,提供更个性化的分析。 选择30%和100根蜡烛背后的逻辑: 对百分比和蜡烛数量的慎重选择旨在捕捉最近过去的相关动向,提供更精确的预测。这种战略性方法突显了价格有显著概率移动的区域,为交易员提供更明智的视角。 ATR Projection的优势: 1. 可定制的技术准确性:用户可以根据每个交易资产的特定条件自由定制指标。 2. 专注于高概率:通过仅关注最近100根蜡烛的平均值的30%,ATR Projection将注意力集中在可能性较高的移动上,优化了明智的决策制定。 3. 适应交易资产:该指标的灵活性允许适应不同的资产,提供根据每种金融工具的独特特征定制的分析。 此外,值得注意的是,ATR Projecti
Box Weis Wave
Thalles Nascimento De Carvalho
5 (1)
如果您是一位活跃的交易员,正在寻找一种有效的方法来解读金融市场的波动,那么您一定会喜欢了解Weis Wave Box。这款令人难以置信的指标旨在提供清晰准确的成交量波动可视化分析,同时标出相应的转折点。凭借其五种可自定义的波动形态和其他独特功能,Weis Wave Box成为经验丰富的交易员和新手交易员不可或缺的工具。 Weis Wave Box的一个显著特点是其能够在自定义刻度上创建成交量波动。这使您可以根据自己的交易偏好进行调整,获得精确而相关的策略结果。此外,该指标还具有可调节的历史记录限制,使您能够关注所需的时间段并分析特定趋势。 Weis Wave Box的另一个重要优势在于其提供刻度量和实际量的信息。理解这两种类型的量之间的区别对于准确的市场分析至关重要。该指标以清晰直观的方式呈现这些信息,使您能够做出明智而策略性的决策。 Weis Wave Box的另一个亮点是其对波动形态的灵活性。它提供了包括totalVol、length、width、barDVol和lengthDVol在内的五个不同选项,您可以根据自己的喜好和特定目标自定义分析。这种灵活性是Weis
Long Short Pro
Thalles Nascimento De Carvalho
有效使用长期和短期指标,并利用不同资产之间的相关性,需要按照一些基本步骤进行操作。 1. 理解指标的基础:熟悉长期和短期指标的基本度量和计算方式。了解它如何将货币对、指数或加密货币进行关联,并确定这些资产之间的正相关或负相关关系。 2. 分析资产相关性:利用长期和短期指标监控您感兴趣的资产之间的相关性。观察货币对、指数或加密货币之间的关系,并确定正相关或负相关的趋势。 3. 发现正向差异:寻找正向差异,即一个资产的表现优于与其相关的另一个资产。这可能表明存在交易机会,因为较强的资产可能会继续升值,而较弱的资产可能表现较弱。 4. 利用负向差异:类似地,观察负向差异,即一个资产的表现低于与其相关的资产。这可能表明存在交易机会,因为较弱的资产可能会继续贬值,而较强的资产可能表现较强。 5. 根据差异进行交易:根据长期和短期指标所发现的正向或负向差异,进行交易决策。例如,如果存在正向差异,您可以考虑在较强的资产上开设多头头寸,并在较弱的资产上开设空头头寸。如果存在负向差异,您可以考虑在较弱的资产上开设空头头寸,并在较强的资产上开设多头头寸。 6. 管理风险
Reversal Vol Propagation
Thalles Nascimento De Carvalho
Are you tired of missing out on trading opportunities by not being able to identify price reversals in time? Do you want to maximize your profits and make informed trading decisions? Introducing the Reversal Vol Propagation Indicator, the revolutionary tool that uses neural networks and volume data to predict potential price reversals. Based on a powerful combination of advanced algorithms and cutting-edge technology, the Reversal Vol Propagation meticulously analyzes volume patterns and past pr
Didi Index Volume
Thalles Nascimento De Carvalho
介绍一下Didi指数成交量(Didi Index Volume),这是由巴西交易员Odir Aguiar开发的一种技术分析指标,以其先进而强大的方法在金融市场中发现机会而脱颖而出。Didi指数成交量在各种平台上提供,已成为追求精确见解和有价值信息的交易员们的重要工具。 该指标将著名的Didi指数与智能使用的交易量结合起来。这种组合可以更深入地分析价格行为和交易量之间的相互作用,提供了独特的资产运动视角。 通过复杂的算法和加权平均计算,Didi指数成交量可以根据交易量提前预测价格变动。这一特点对于识别新兴趋势、市场反转和适时的入场和出场点非常重要。 使用Didi指数成交量,您可以获得客观可靠的信息,帮助避免草率决策,提高准确解读市场的能力。该指标具有直观且可自定义的界面,适应个人偏好,提供高度个性化的交易体验。 立即尝试Didi指数成交量,发现为什么如此多的交易员信任这个工具,在金融市场中获得竞争优势。扩展您的可能性,推动您的交易业绩,这是一款为最苛刻的交易员需求而设计的智能解决方案。 使用提示: - 始终关注MA Slow(红色)的趋势。当MA Sl
Smart Binary Volume
Thalles Nascimento De Carvalho
智能二元交易量指标是一种多功能工具,结合了交易量分析和机器学习。它可以应用于各种市场和策略,包括超短线交易和其他短期交易方式。利用先进的机器学习算法,该指标能够识别复杂的模式,提供更准确的买入和卖出信号。 Buffer to Create EA. Buffer Line Gold = 0. Buffer Line Red = 2 Buffer   AI  =  3 AI Buffer  >=  0  ("SIGNAL BUY") AI Buffer  <=  0  ("SIGNAL SELL") 使用提示: 1. 注意当线条相反时:请注意Smart Binary Volume指标显示线条相反运动的情况。这种情况可能表示进入的信号。 2. 看涨信号:当蓝线高于0.30,而红线位于-0.30以下时,要密切关注。这种配置可能暗示着一个上涨趋势,表明可能有购买机会。 3. 看跌信号:当红线高于0.30,而黄线位于-0.30以下时,这可能预示着一个下跌趋势,表明有卖出机会。 4. 使用机器学习信号验证您的入市点:利用指标面板上机器学习生成的信号来验证您进入市
TimeChannel
Thalles Nascimento De Carvalho
"Timechannel"似乎是一款强大而多功能的技术分析工具,专为希望深入了解多个时间段内价格波动并做出更准确决策的交易员而设计。您提到的主要功能和好处都非常引人注目,对于渴望在金融市场上最大化潜力的严肃交易员可能非常有价值。以下是一些关键要点: 1. **高级多时间段分析**:同时分析不同时间段内的价格波动的能力对于获取全面的市场洞察至关重要。这有助于识别长期趋势、短期机会和理想的入场/出场点。 2. **可定制的价格通道**:用户可以调整指标的参数,根据其偏好和交易策略自定义价格通道。这包括设置通道宽度、颜色和样式。 3. **自动趋势检测**:Timechannel配备了先进的算法,可以自动检测不同时间段内的趋势。这使交易员能够轻松识别上升趋势、下降趋势和盘整。 工作原理: 1. **资产选择**:交易员选择他们想要使用Timechannel进行分析的资产。 2. **时间框架配置**:配置多时间段分析的所需时间框架。这可以包括每日、每小时和分钟图表等。 3. **参数定制**:交易员可以根据自己的偏好自定义指标参数,如通道宽度、颜色和
DeltaBook
Thalles Nascimento De Carvalho
Delta Book指标是一种强大的市场分析工具,结合了成交量差异(Volume Delta)和订单簿(order book)信息,以侦测股票、期货和加密货币等金融市场的价格波动。需要注意的是,要充分发挥Delta Book的潜力,需要获得实时成交量数据和订单簿信息。 Delta Book的主要特点是其先进的市场分析策略,使交易员和投资者能够根据有关市场参与者行为的详细信息来识别趋势和交易机会。以下是一些有关描述Delta Book指标的提示和重要方面: 成交量差异:成交量差异是特定时间段内购买(需求)和出售(供应)的成交量之间的差异。这一指标定量衡量了买家和卖家之间的不平衡,有助于识别市场买卖压力的变化。 订单簿:订单簿是市场上所有买卖订单的实时记录。它显示了交易员愿意购买和出售资产的价格,以及他们愿意以这些价格交易的资产数量。Delta Book使用订单簿信息来分析市场参与者的行为。 价格流动:Delta Book有助于识别价格流动,即资产价格如何受成交量差异和订单簿的变化影响。这对于理解买入和卖出订单如何影响价格波动至关重要。 趋势和逆转:基于成交量差异和订单簿信息,Delta
Big Player Range
Thalles Nascimento De Carvalho
5 (2)
欢迎使用"BigPlayerRange"指标,这是一款技术分析工具,旨在识别市场中金融机构关注的重要区域。该指标提供了对大型市场参与者表现出相当活跃和关注的价格范围的精确分析。 主要特点: 1. 机构兴趣区域映射: "BigPlayerRange" 准确地突出显示金融机构表现出强烈活动的图表区域。这些点具有战略重要性,提供了对可能市场走势的见解。 2. 投影作为退出参考:除了识别关注区域,该指标还使用投影作为两个不同阶段可能退出的参考。这些投影帮助投资者基于未来可能的价格方向规划策略。 3. 返回到识别范围时的回撤概率: "BigPlayerRange" 的一个独特功能是当价格返回到关注范围时计算回撤概率。这有助于评估潜在的趋势反转。 如何使用 "BigPlayerRange": - 辨识关注区域:使用该指标辨识金融机构活动较多的区域。这些点可能对于预测重大波动至关重要。 - 投影作为退出参考:在计划市场退出时,使用投影作为参考。这些投影提供在关闭仓位时可能价格方向的见解。 - 评估回撤概率:在价格返回到已识别范围时注意回撤的概率。这有助
Master OBV
Thalles Nascimento De Carvalho
The MasterOBV indicator is a powerful technical analysis tool that utilizes volume, positive correlation, and a Moving Average (MA) to enhance trend identification in financial markets. By incorporating assets with positive correlation through the indicator menu, MasterOBV provides a refined approach to assessing the strength and direction of trends. The inclusion of the Moving Average adds additional smoothing to price movements, aiding in a more accurate tracking of the underlying trend over
筛选:
无评论
回复评论