MACD Bands
- 指标
- Mahdi Ebrahimzadeh
- 版本: 1.10
- 更新: 7 一月 2024
- 激活: 5
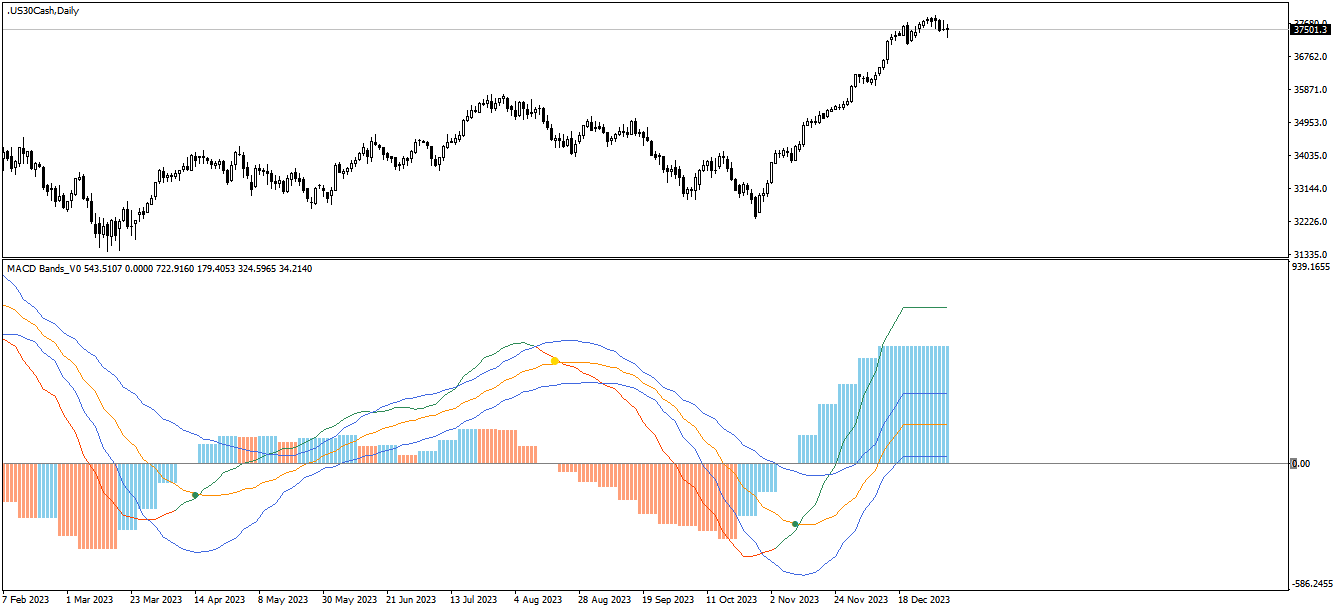
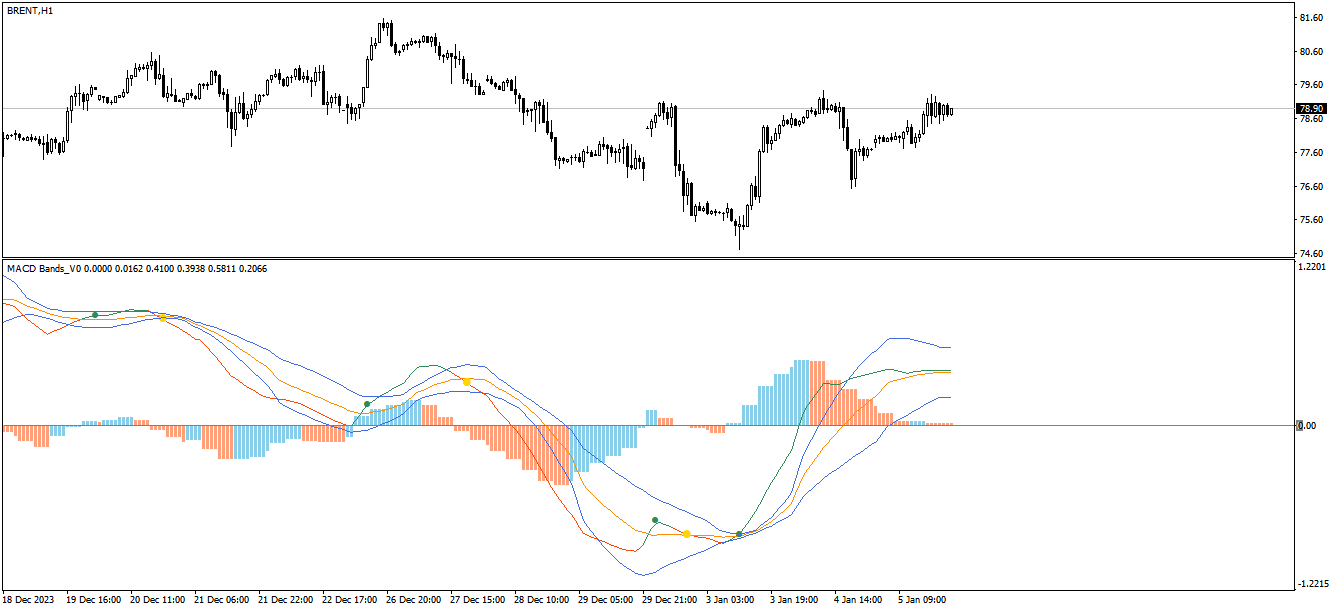
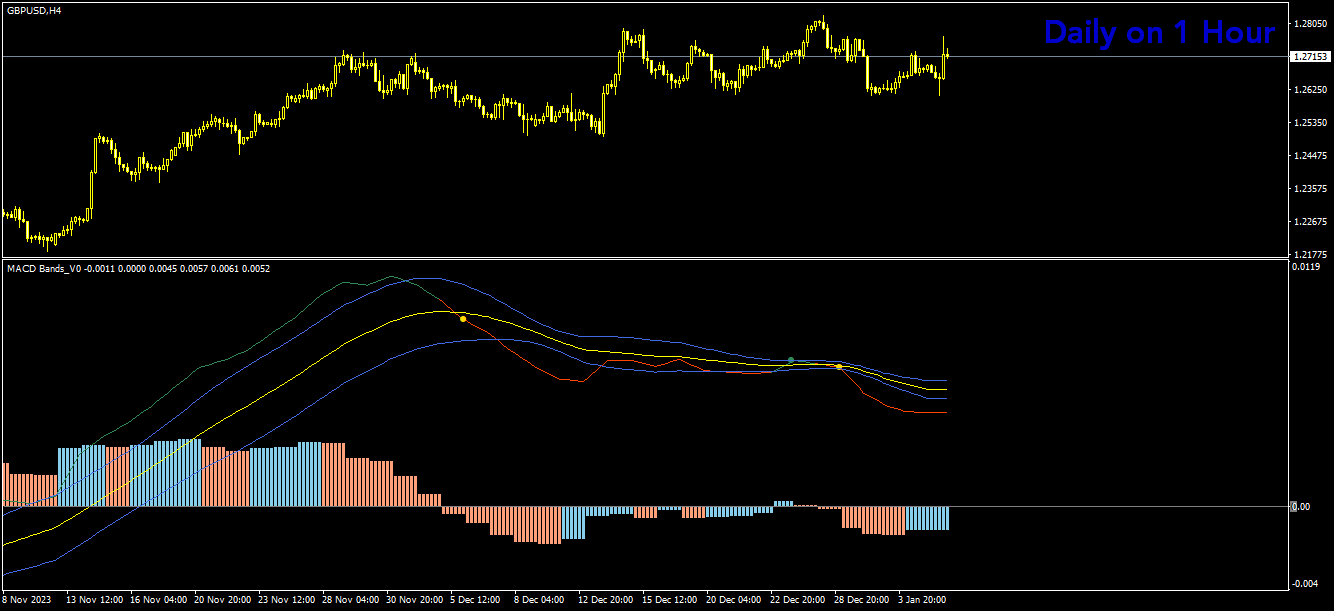
产品从另一个平台转换而来,由 TradeMaster Lite 原创。该指标基本上使用 MACD 概念,但通过不同类型的平均技术来增强其能力。它在趋势和反转识别方面非常强大。
以下是原作者提供的一些详细信息:
我们提供的是一个可定制的 MACD 指标,具有以下功能:
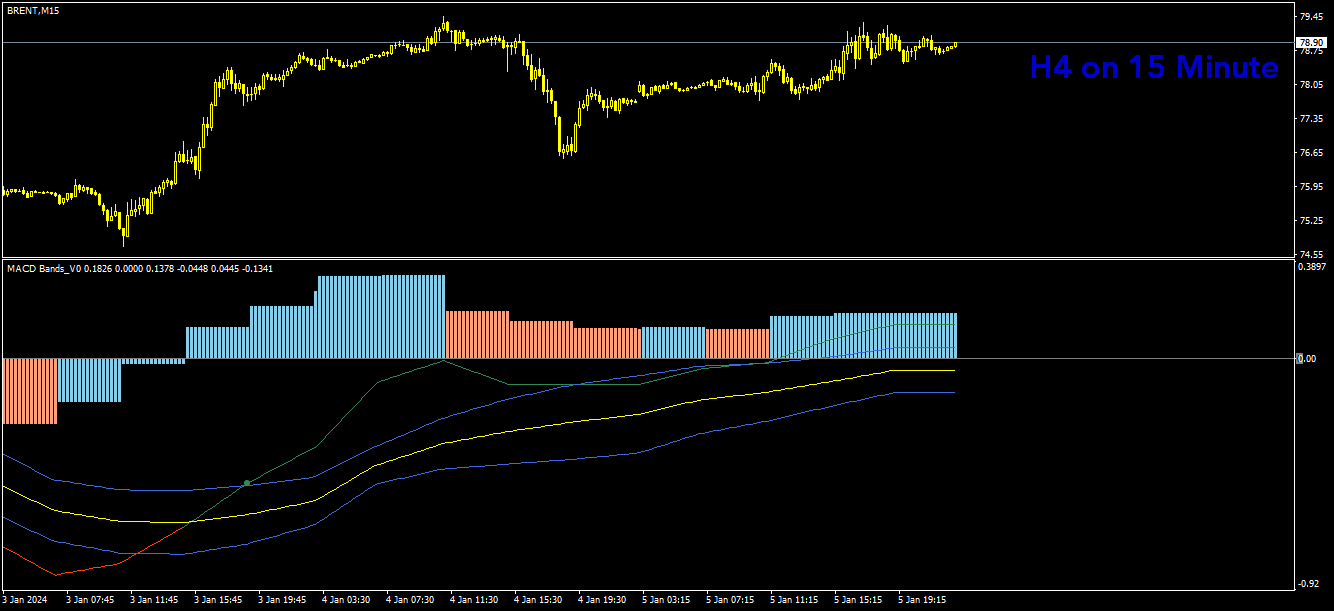
多时间框架
可发现异常波动的偏离带
9 种移动平均线类型
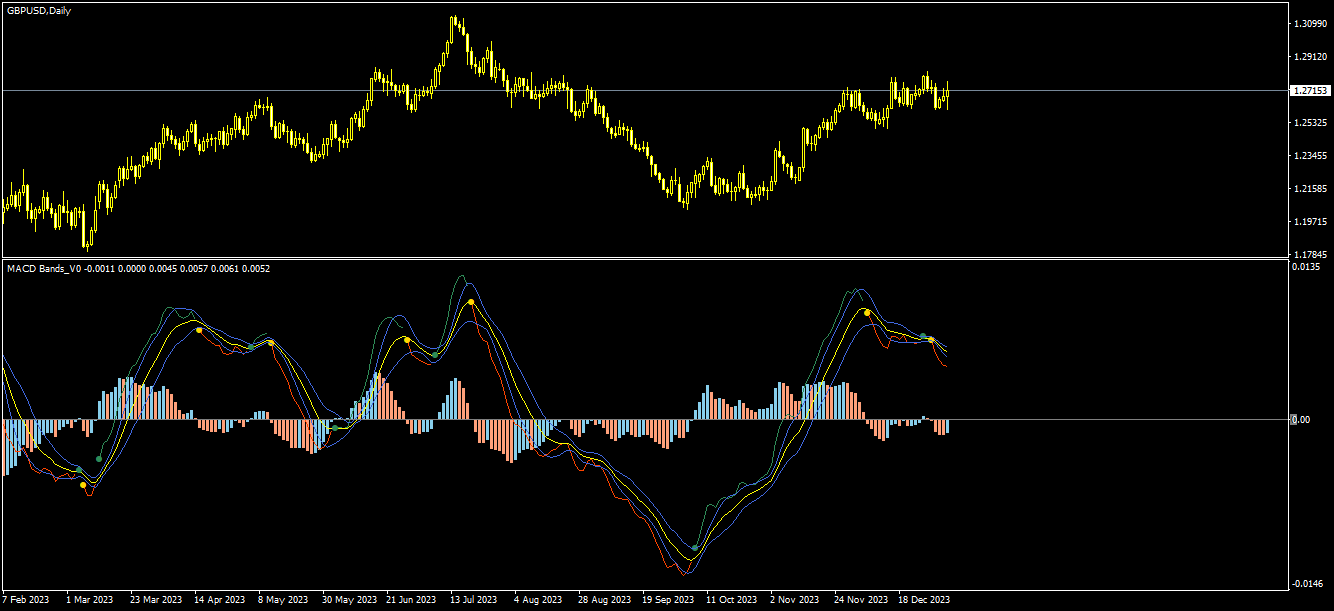
条件着色和线交叉
用于发现异常波动的偏离带:
围绕信号线绘制的偏离带有助于识别异常波动期。当 MACD 线在偏离带之外交叉时,表明市场正变得更加波动,并可能朝着该方向形成强劲趋势。
👉脚本中可使用 9 种移动平均线类型。每种类型的移动平均线都提供了独特的视角,可在不同情况下用于识别市场趋势。
SMA(简单移动平均线): 它按所选数值范围内的周期数计算该范围内数值的平均值。
SMMA(平滑移动平均线): 它考虑了所有可用数据,并对各值赋予相同权重。
EMA(指数移动平均线): 它对最近的数据点赋予更大的权重和意义。
DEMA(双指数移动平均线): 这是一种移动速度更快的平均值,使用专有计算方法来减少数据点的滞后性。
TEMA(三重指数移动平均线): 它比 DEMA 移动平均线更快,可帮助交易者更迅速地对趋势变化做出反应。
LSMA(最小二乘法移动平均线): 该移动平均线采用最小二乘回归法来确定趋势的未来方向。
HMA(赫尔移动平均线): 这种移动平均线旨在减少滞后性,提高平滑度,为短期市场走势提供更快的信号。
VWMA(成交量加权移动平均线): 它赋予高成交量蜡烛图更大的权重,在高成交量期间更准确地反映真实的平均值。
WMA(加权移动平均线): 它赋予最新数据更多权重,但不如 EMA 重。
条件着色:
该功能根据 MACD 线的方向为其着色,并填充 MACD 线和偏离带边缘之间的区域,以突出潜在的波动性和动量的强度。这有助于识别市场何时趋势强劲,何时处于中性或波动状态。
👉MACD 线 - 信号线交叉:
这是一种经典的 MACD 交易信号,发生在 MACD 线在信号线上方或下方交叉时。交叉可用于识别潜在的趋势反转。这可能是看涨或看跌信号,取决于交叉的方向。
一般建议
用其他指标确认信号:
与所有技术指标一样,用其他分析工具(如支撑位和阻力位)以及 RSI、MACD 和成交量等指标确认潜在信号也很重要。这有助于提高交易成功的概率。
使用适当的风险管理:
在使用该指标或任何其他指标时,适当的风险管理至关重要。考虑执行止损水平和深思熟虑的仓位大小。
与其他技术指标相结合:
该指标可与其他技术指标一起有效使用,以创建全面的交易策略并提供额外的确认。
切记:
在做出任何交易决策之前,彻底的研究和回溯测试都是必不可少的。此外,扎实了解指标及其行为也至关重要。此外,结合基本面分析和考虑市场情绪也是交易方法中需要考虑的重要因素。
局限性:
这是一个滞后指标。请注意,该指标使用的是移动平均线,而移动平均线是滞后指标。
TradeMaster Lite软件包中的指标旨在简化和提高效率,同时保留其原始目的和价值。某些设置、功能或视觉效果可能比预期的简单。