Pct Multi Probability Indicator Mt5
- 指标
- Fabio Albano
- 版本: 6.0
- 激活: 20
The new update makes this indicator a complete tool for studying, analyzing and operating probabilistic patterns.
It includes:
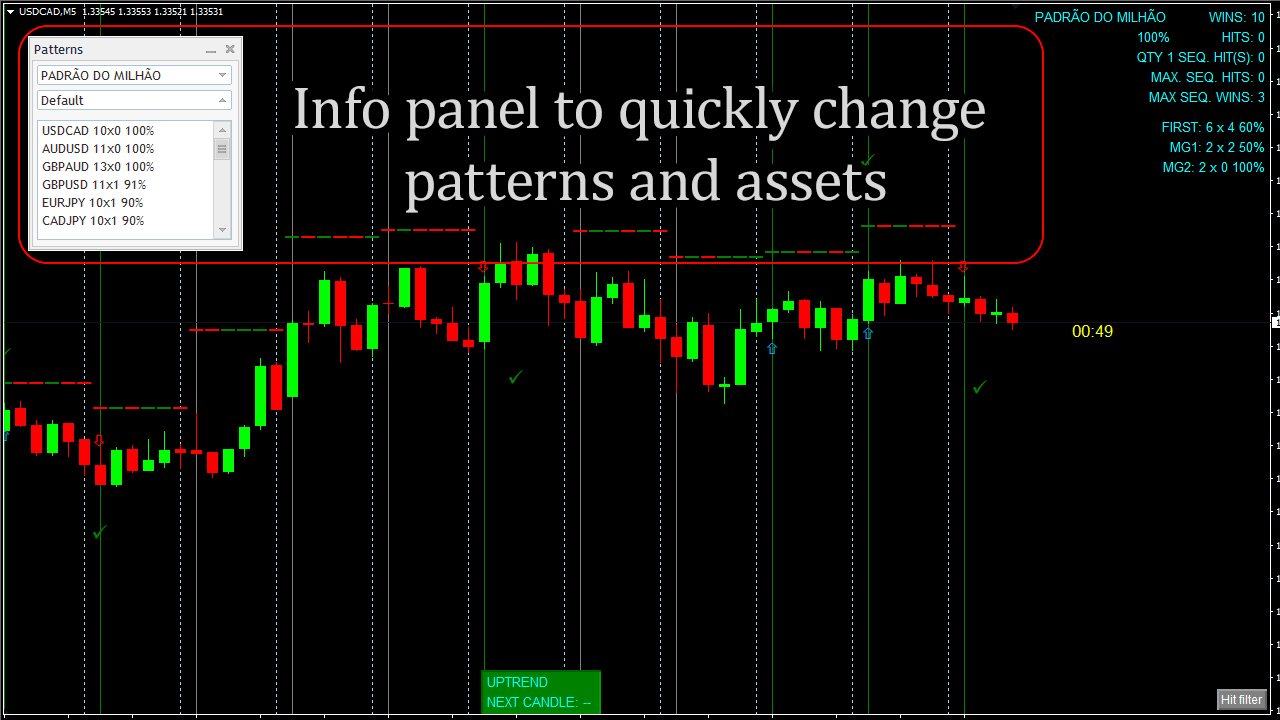
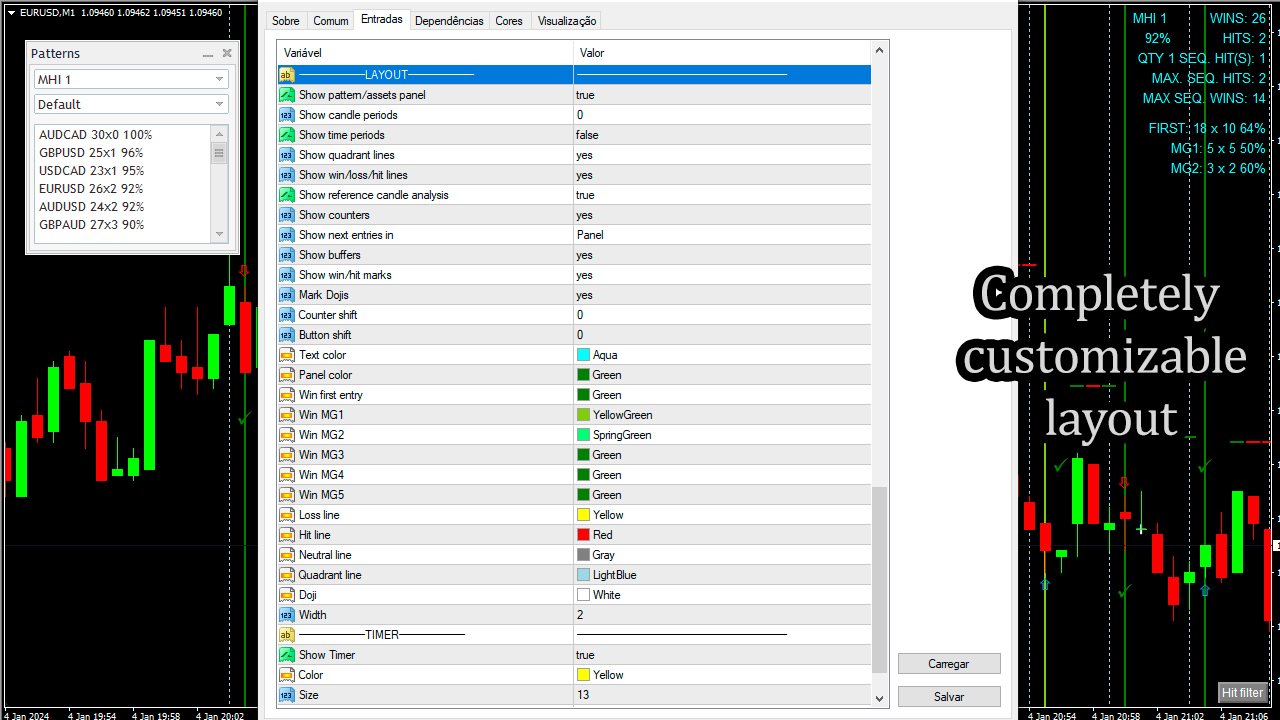
- On-chart Multi-asset percentage monitor.
- Configurable martingales.
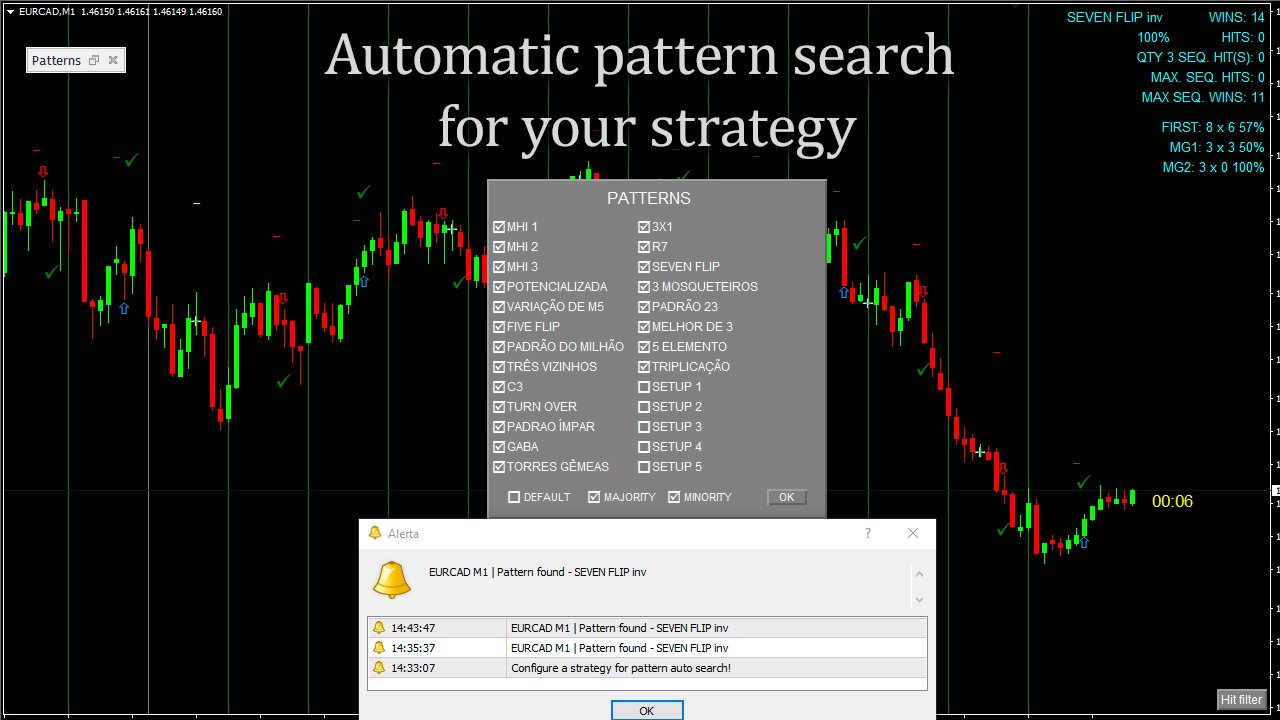
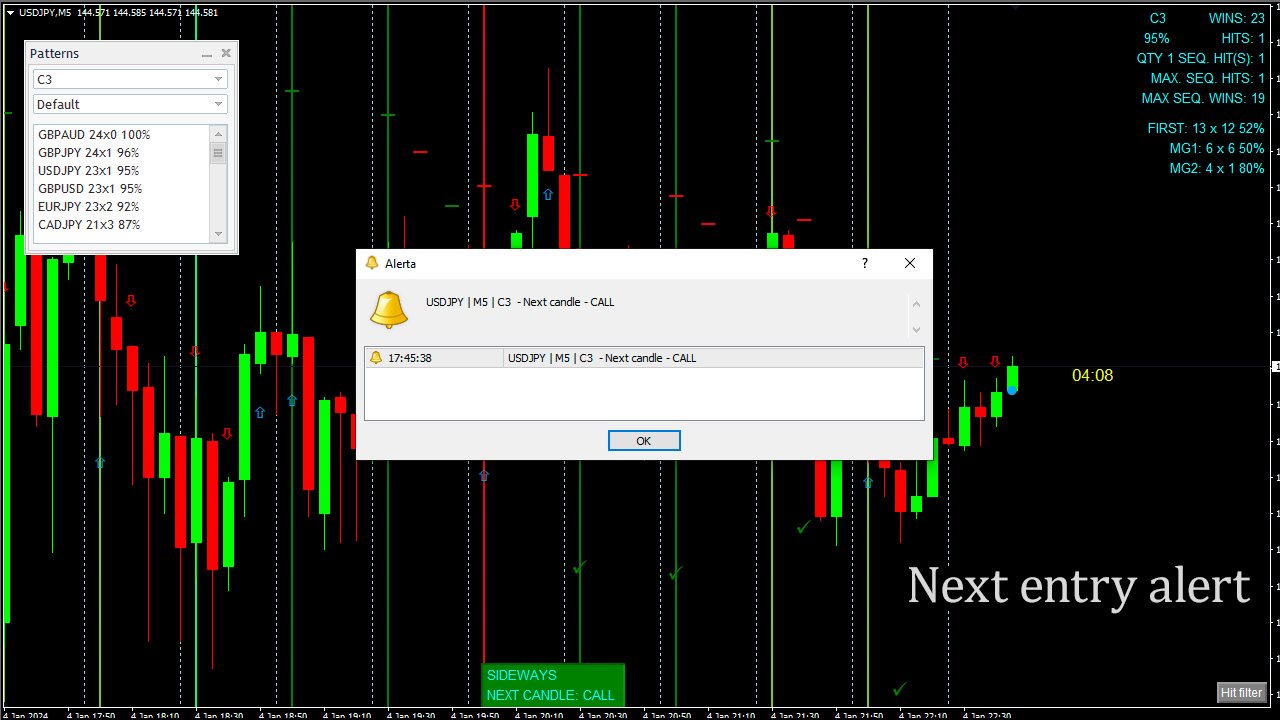
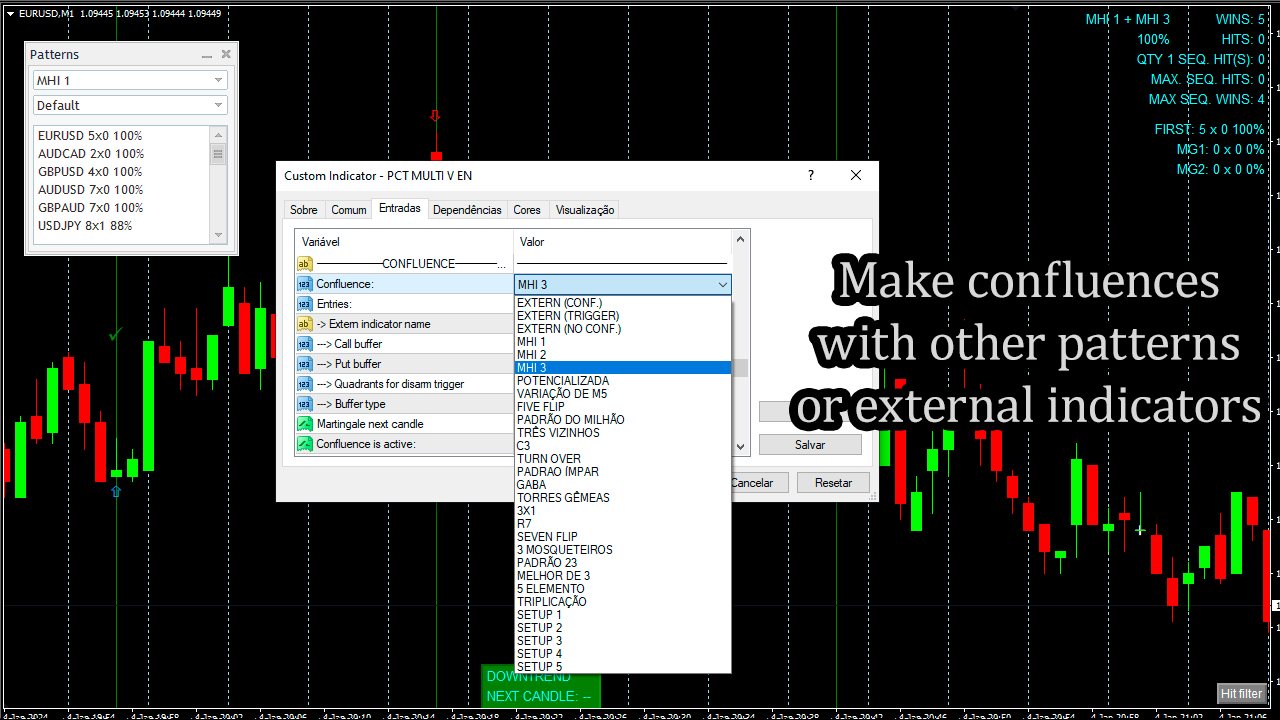
- Twenty-one pre-configured patterns, including Mhi patterns and C3.
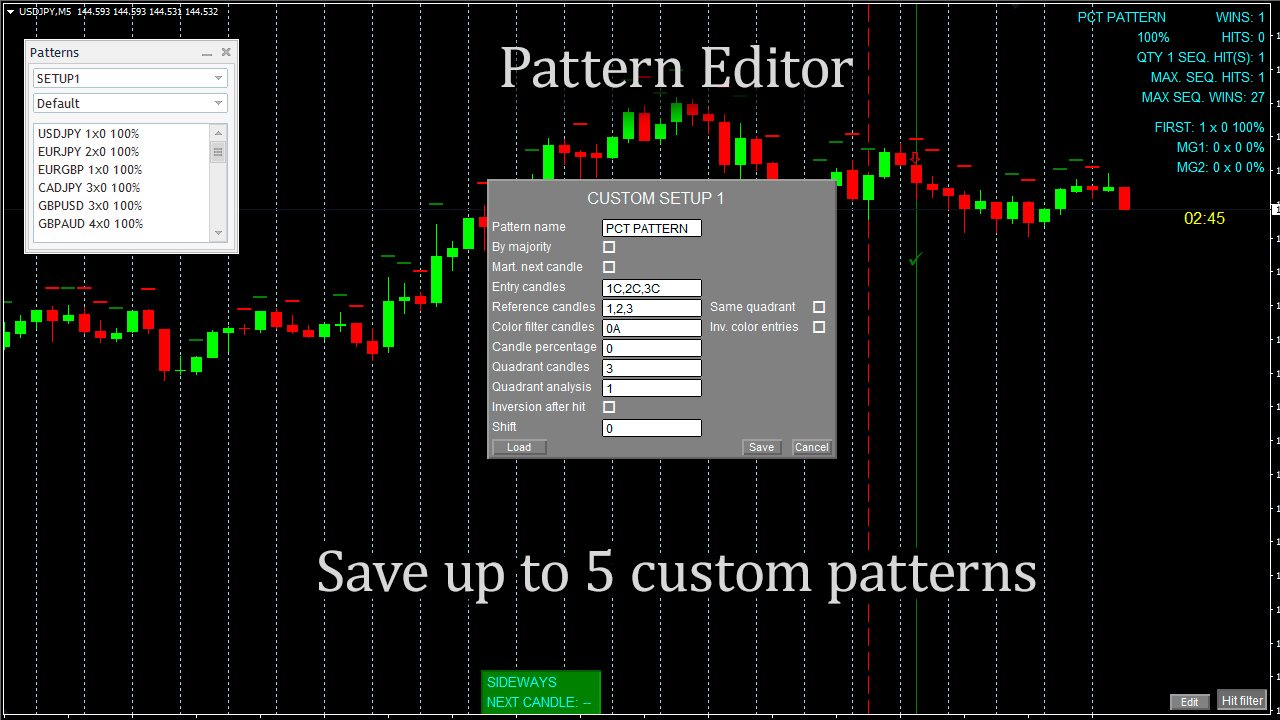
- An advanced pattern editor to store up to 5 custom patterns.
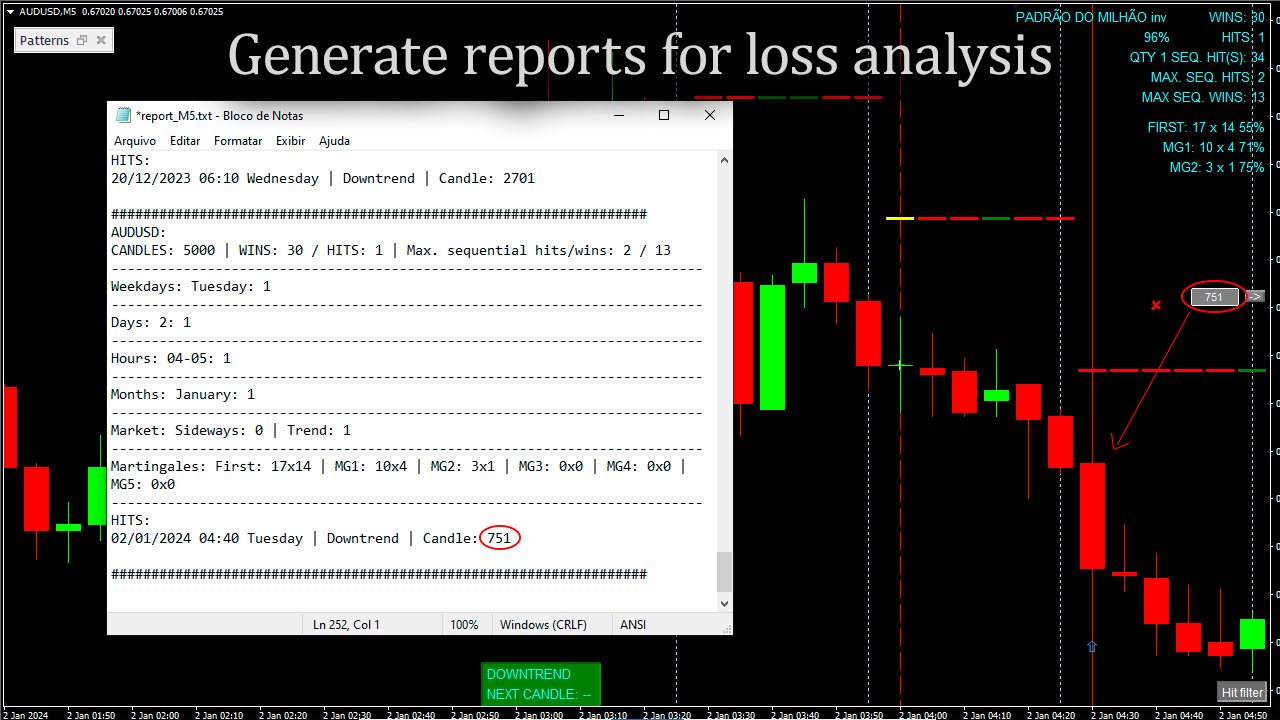
- Backtest mode to test results with loss reports.
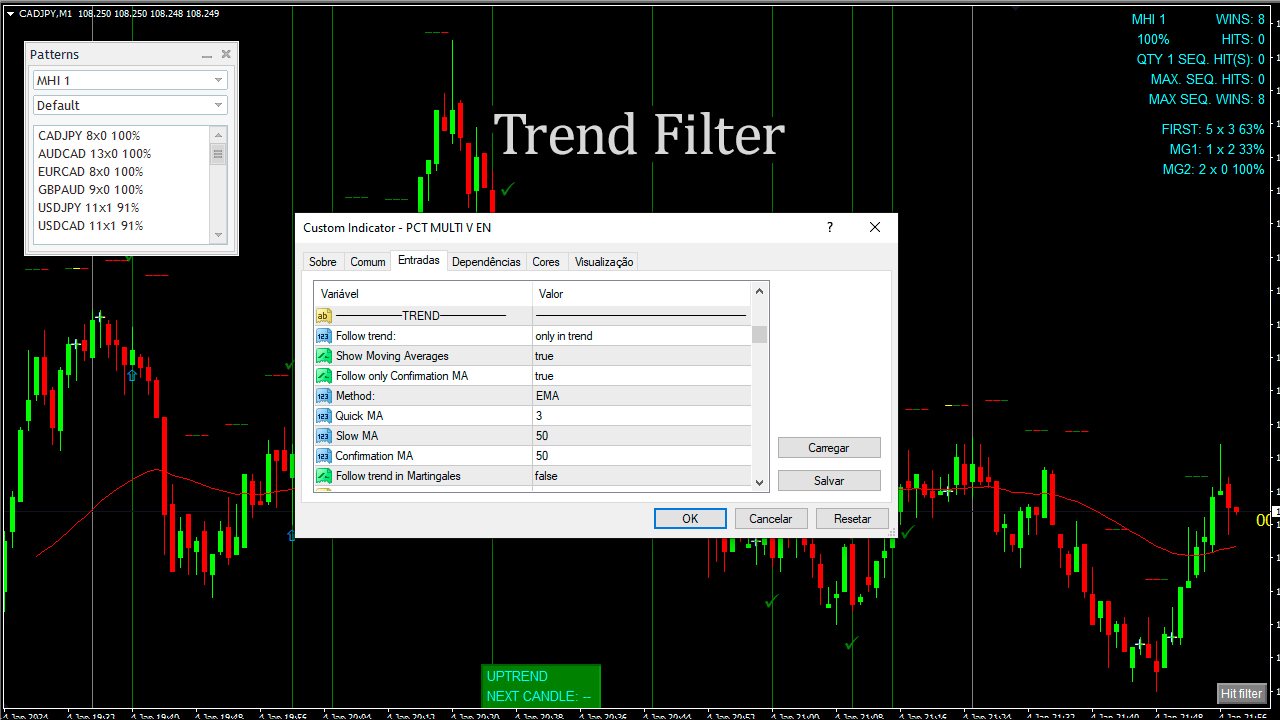
- Trend filter.
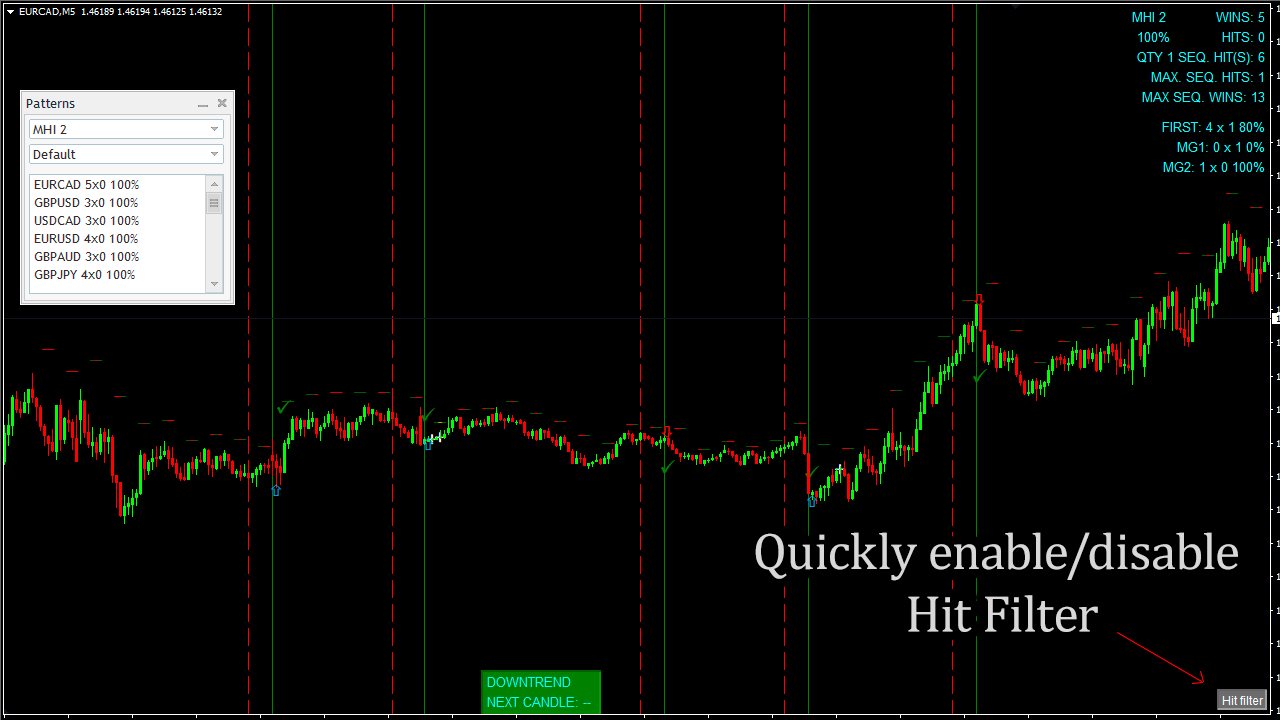
- Hit operational filter.
- Martingale Cycles option.
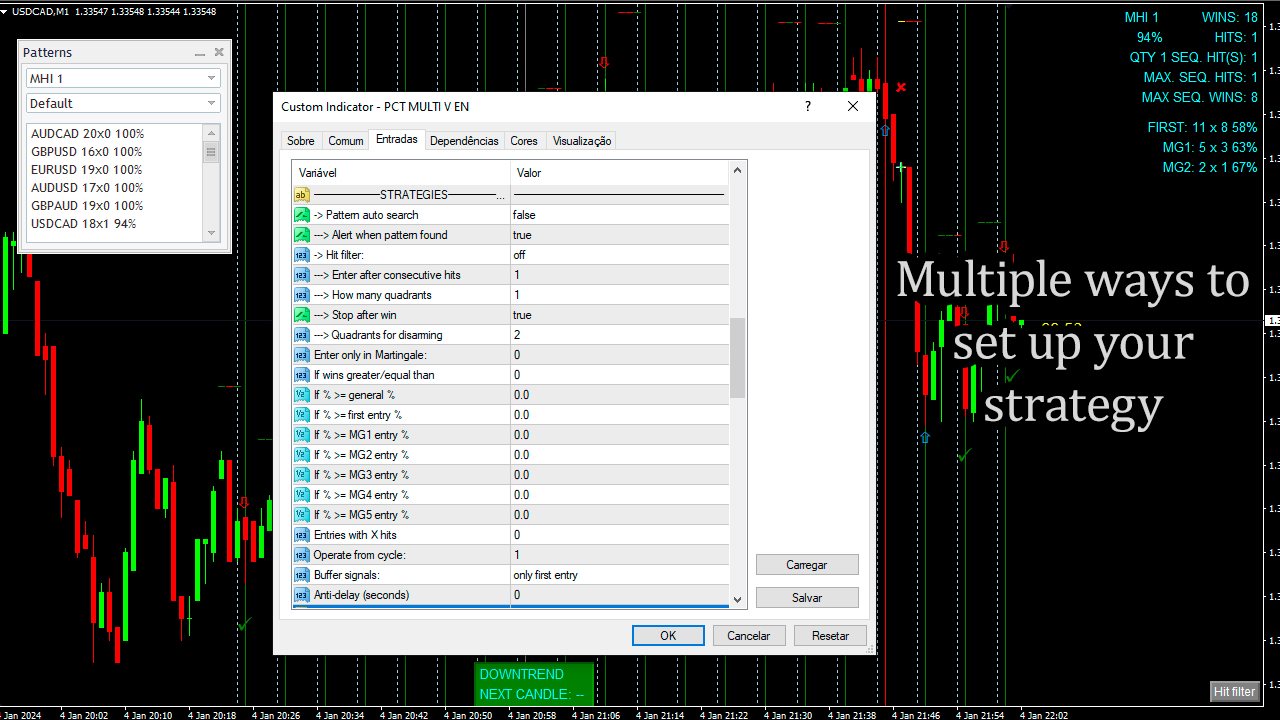
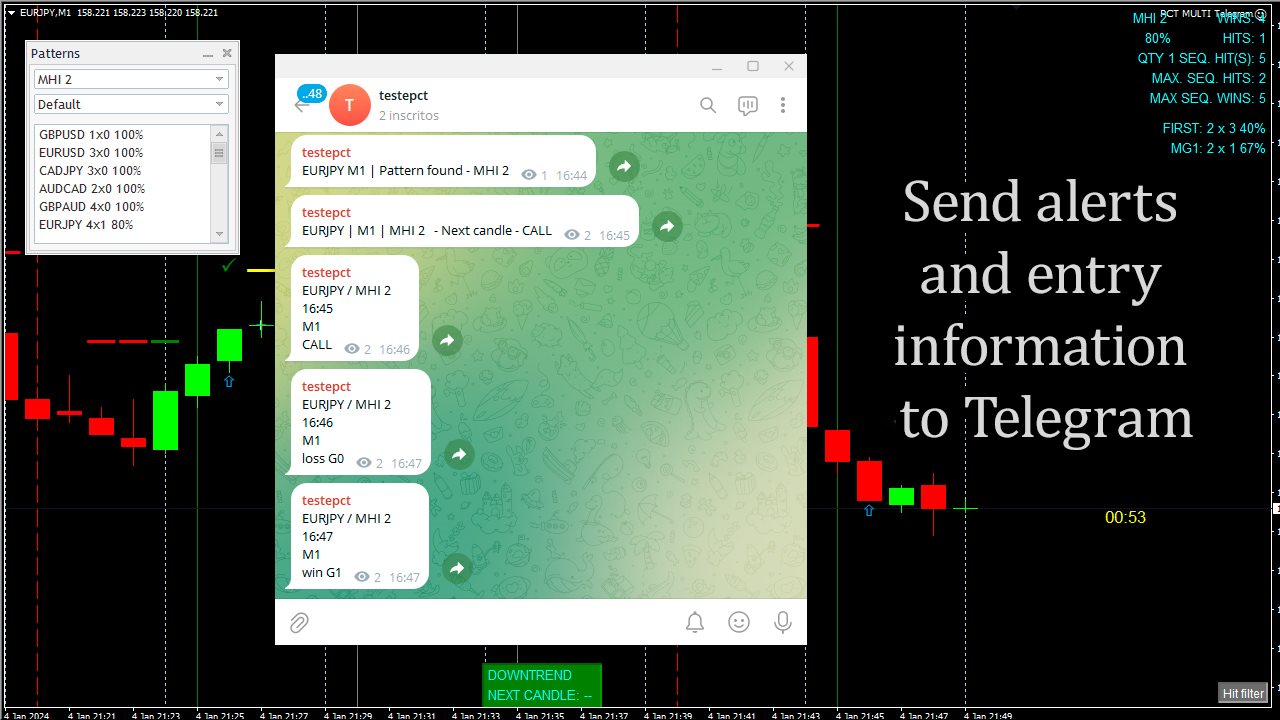
- Various types of strategies and alerts.
- Confluence between patterns or external indicator.
- Works in M1, M5, M15 and H1.
Obs: Multi assets function does't work with Demo Version in Strategy Tester .
To use with Telegram:
https://www.mql5.com/en/market/product/111087
To use with automation bots:
https://www.mql5.com/en/market/product/111086