ICT Market Structure
- 指标
- Yong Jie Su
- 版本: 1.0
- 激活: 10
如你在寻找一款能契合ICT交易理念的可靠指标工具,ICT Market Structure将会为您提供了一份更直观体现ICT理念的市场结构报告,帮助你成为快人一步的领先投资者
这款一体化指标专注于ICT概念(SMC概念),ICT Market Structure能帮您更容易找出机构交易的时间点并跟随其交易脚步。通过理解和利用这种策略,交易者可以获得有关市场走势的宝贵见解,并能根据价格找到更实际的进场出场时机。
以下是一些功能的简要介绍:
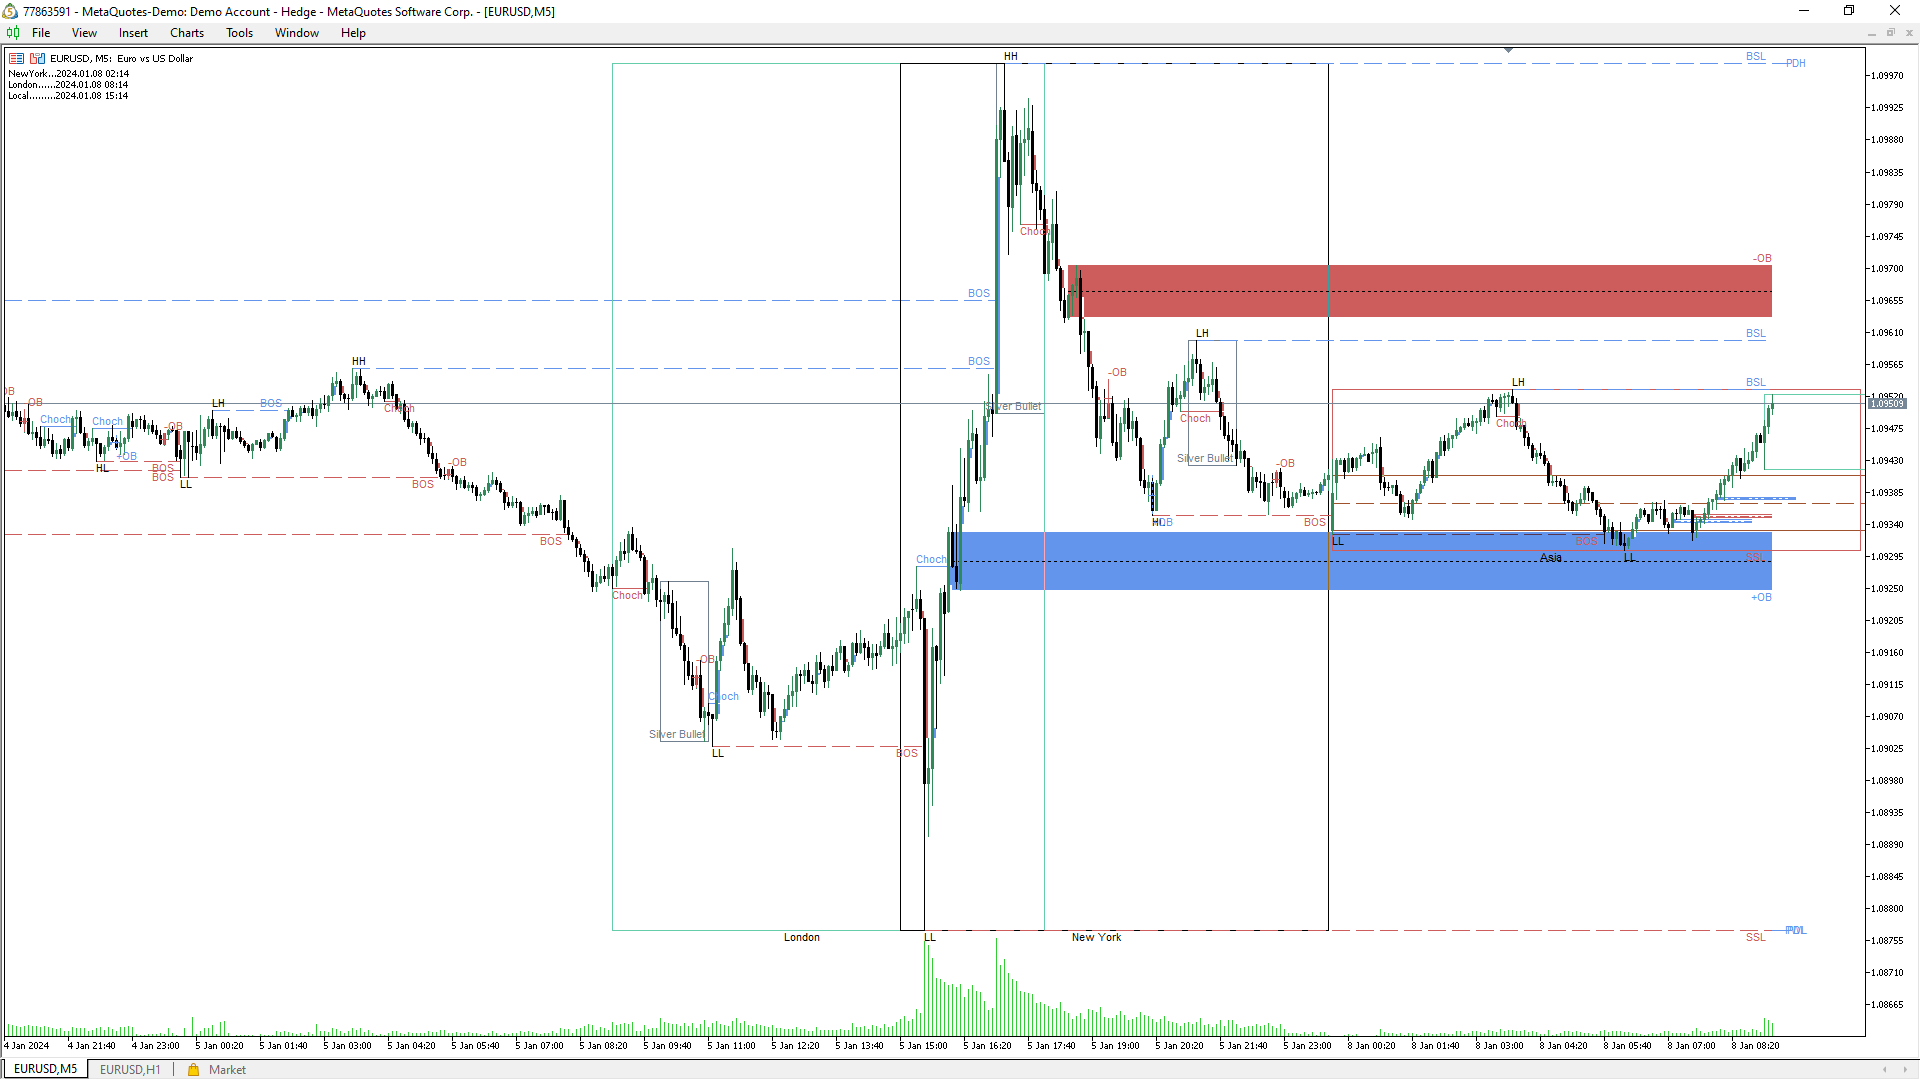
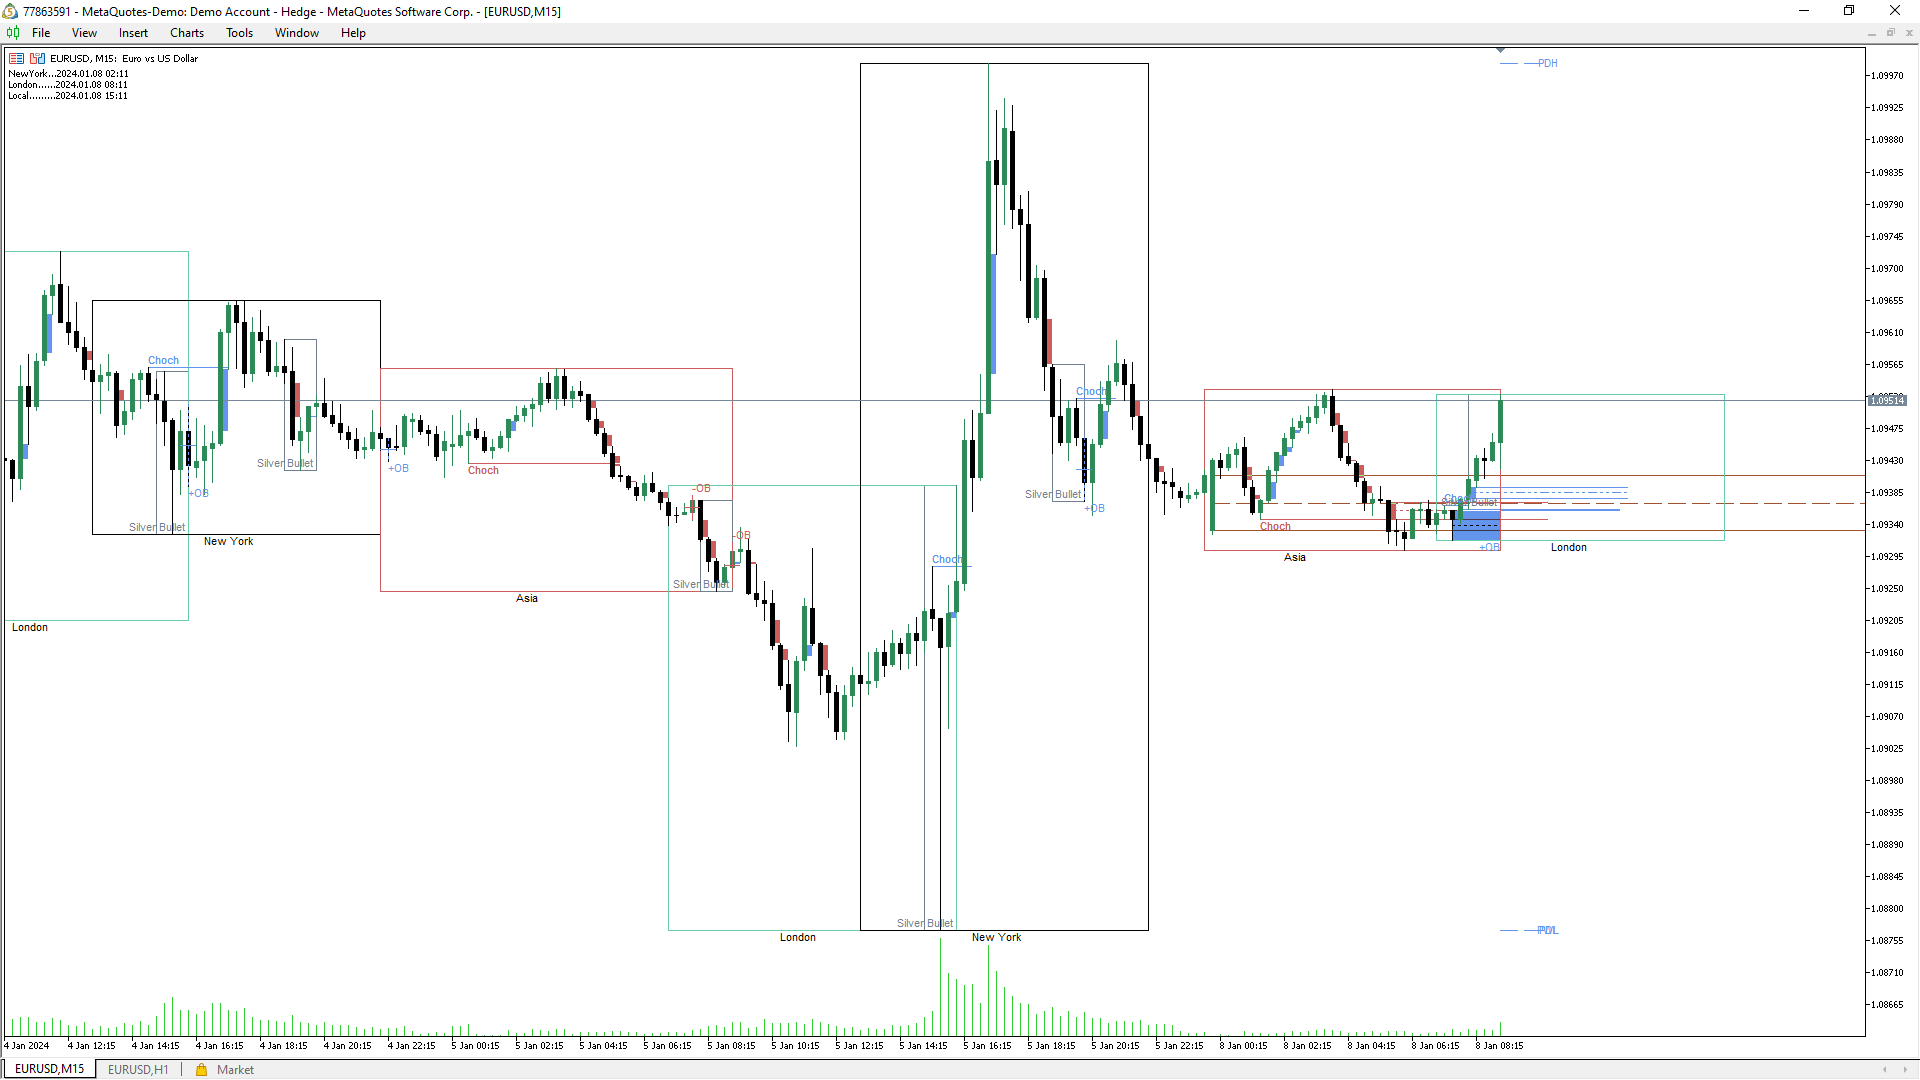
- 不重绘、不重画、不滞后的指标
- 显示带有成交量指标的订单块(看涨和看跌) 并提供形成警报
- 实时市场结构和摆动结构高低点(HH, HL, LL, LH) 并提供形成警报
- 结构突破(BOS), 市场结构转变 (CHoCH)/ 动量转变(MS)
- 破位订单块标签并提供形成警报
- 公允价值缺口(看涨和看跌FVG)检测 并提供形成警报
- 显示银弹时间
- 显示以下地区交易时间段:伦敦(London)、纽约(New York)、亚洲(Asia)
- 可以自定义所有文本和区块的颜色
相关话题标签:
ICT交易,SMC交易,聪明钱,智能洞察,机构视角,流动性分析,机构交易,市场预测,价格波动,趋势分析,价格行为,市场结构,支撑阻力,供需,强烈失衡,溢价和折扣,斐波那契回调,多时间框架,高时间框架,流动性缺口,时区,市场时段,技术分析,流动性池,市场操纵,市场情绪,价格分析,市场洞察,市场参与者,市场心理学,订单流,市场解读,市场预测,交易模式,交易策略
More than happy with this ICT Package, it’s definitely it’s worth and given me such a better view and understanding with my strategies, all I can say is 10/10