Liquidity Pro
- 指标
- Tariq Mahmood
- 版本: 5.0
- 更新: 6 一月 2025
- 激活: 5
Liquidity Pro
The Liquidity Pro highlights liquidity and supply & demand zones in any financial instrument, including currency pairs, cryptocurrencies, commodities and indices. The Liquidity Pro highlights "Supply & Demand" zones, down to the present minute, providing optimal trade entries and exits, when conducting chart analysis or initiating trades.
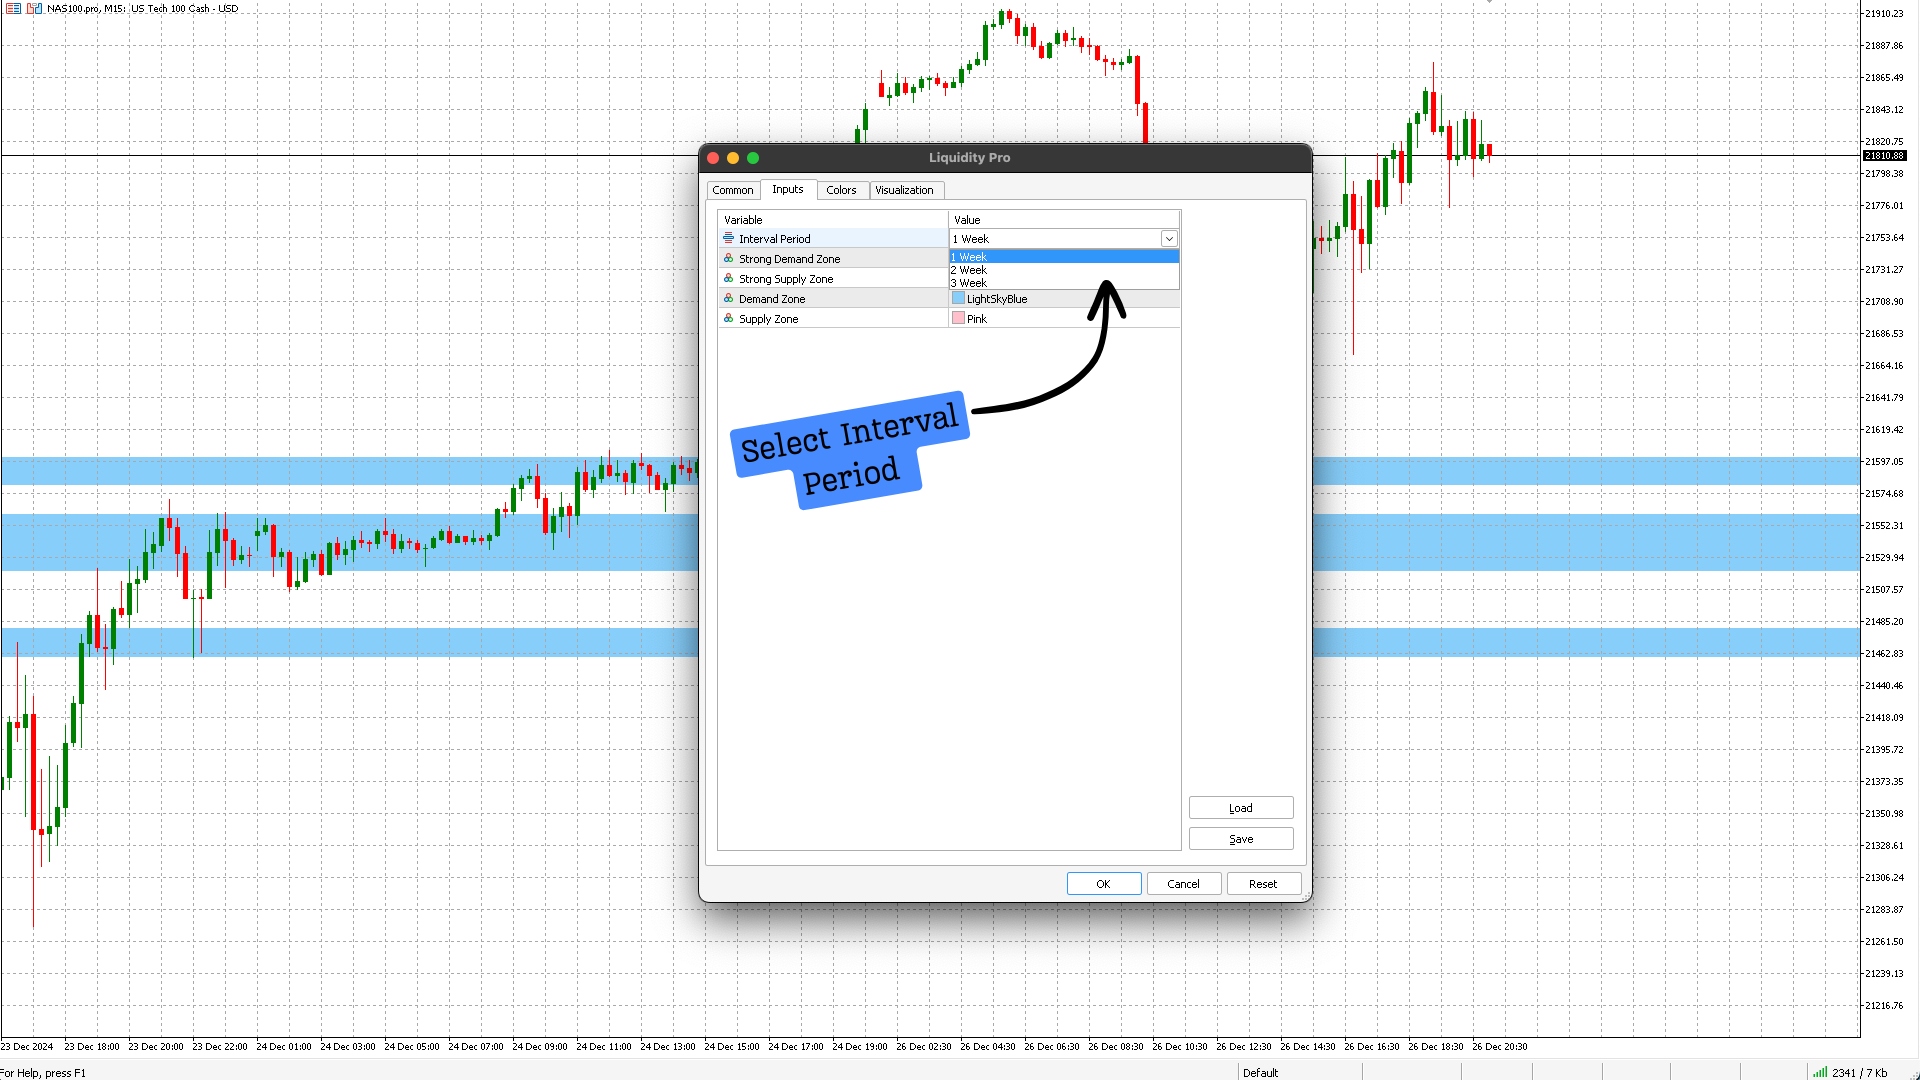
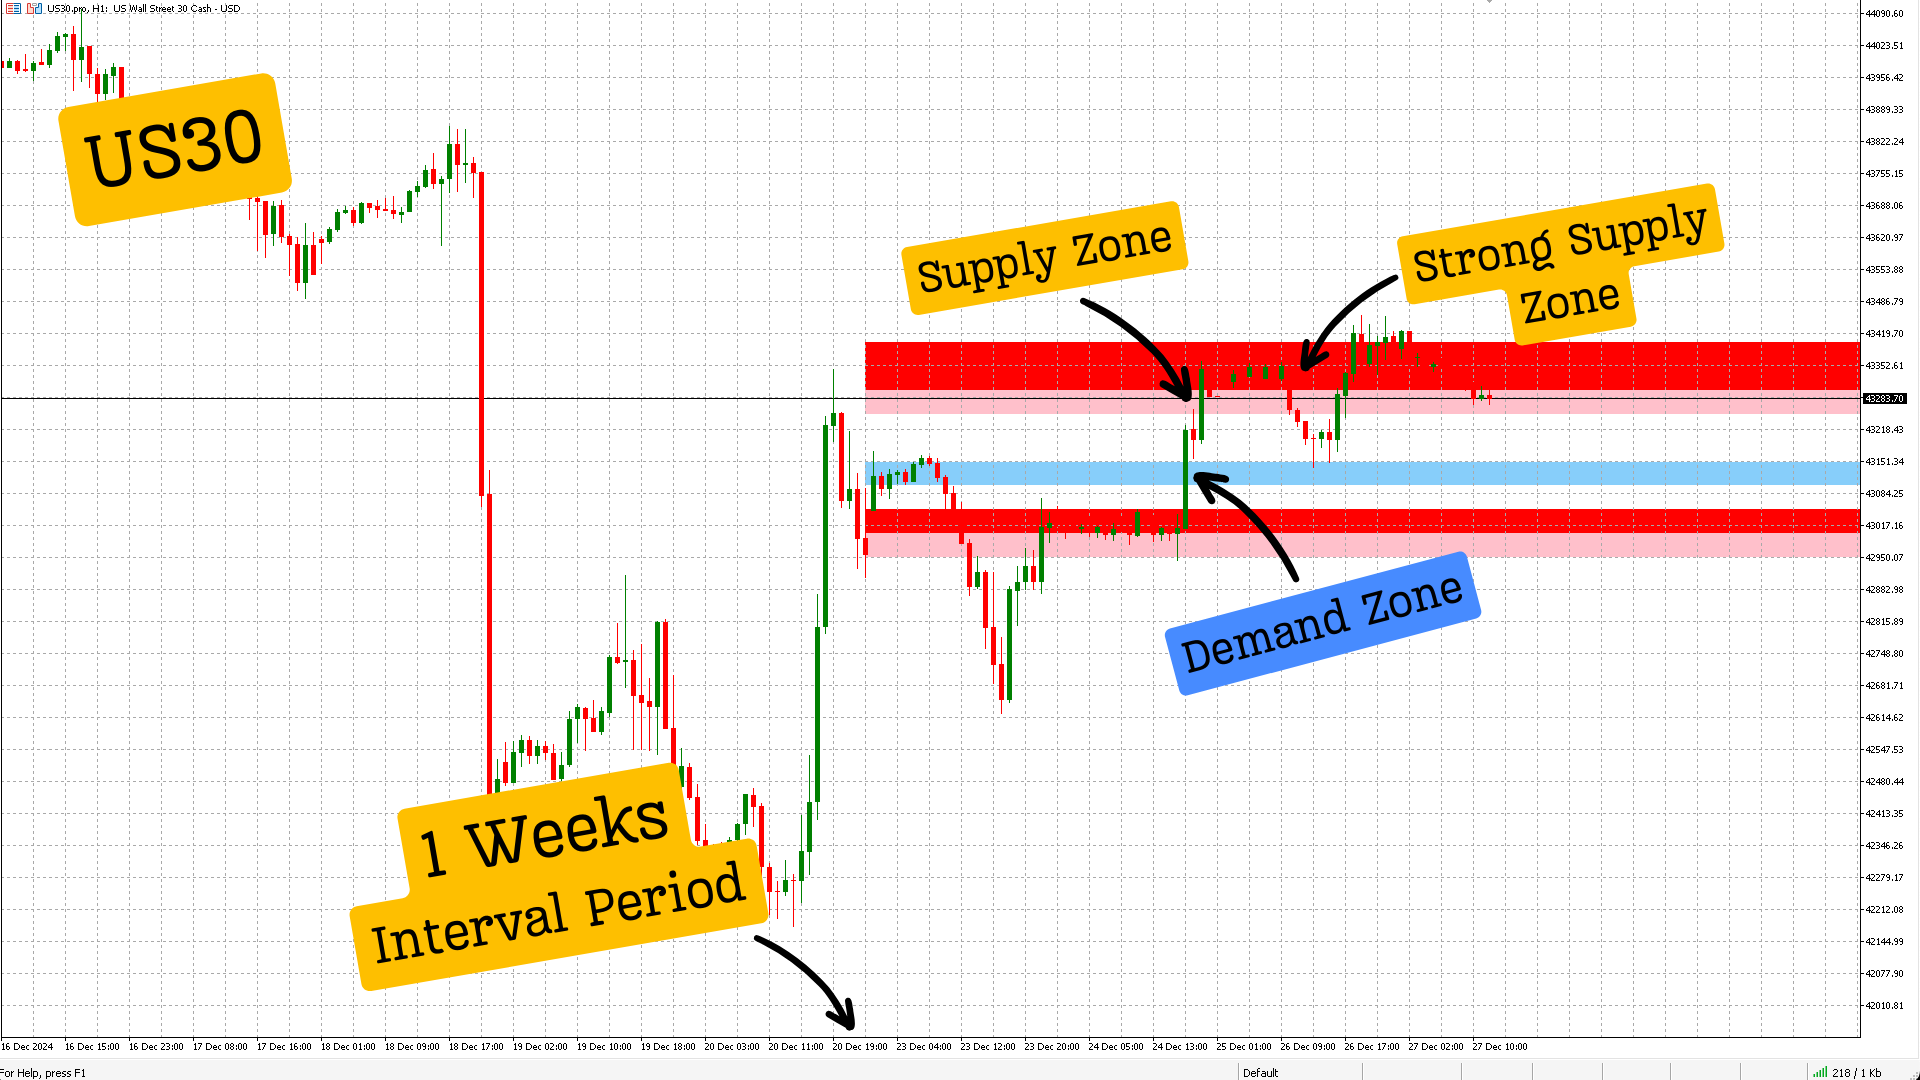
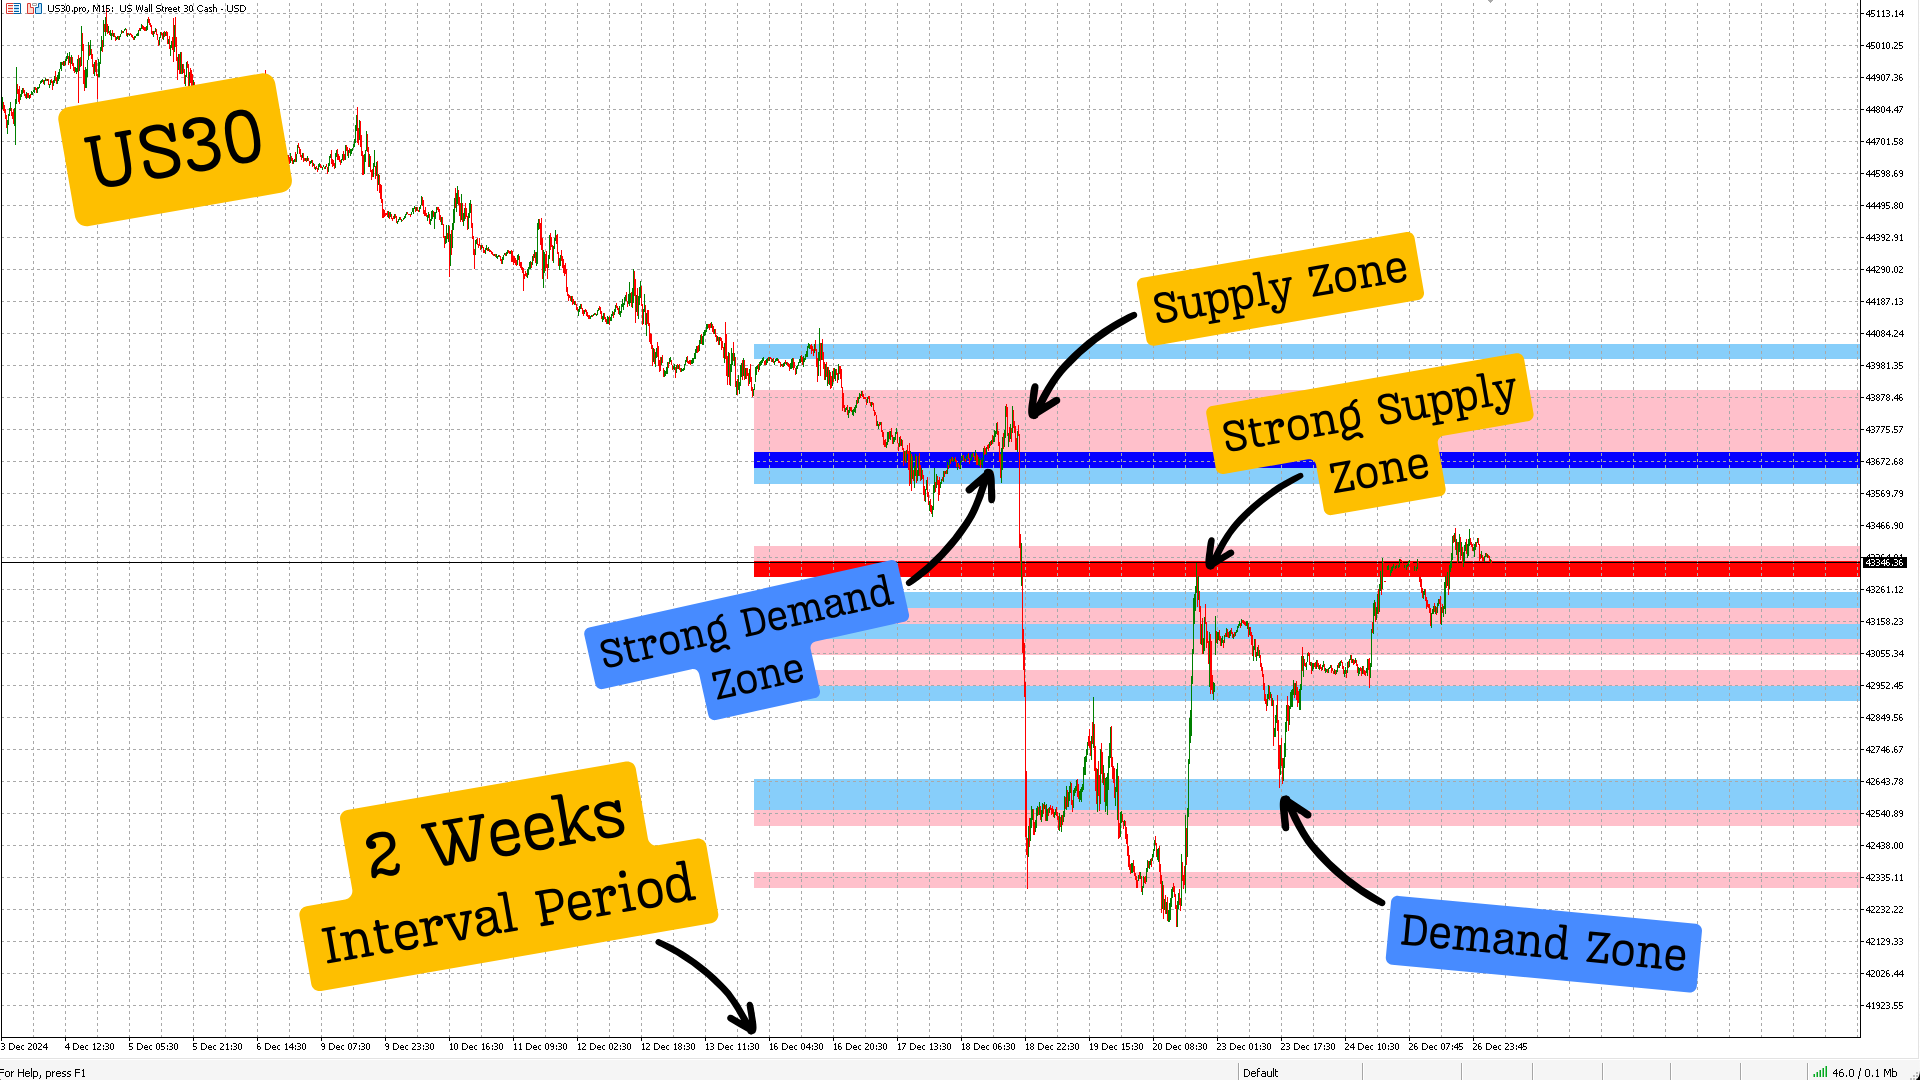
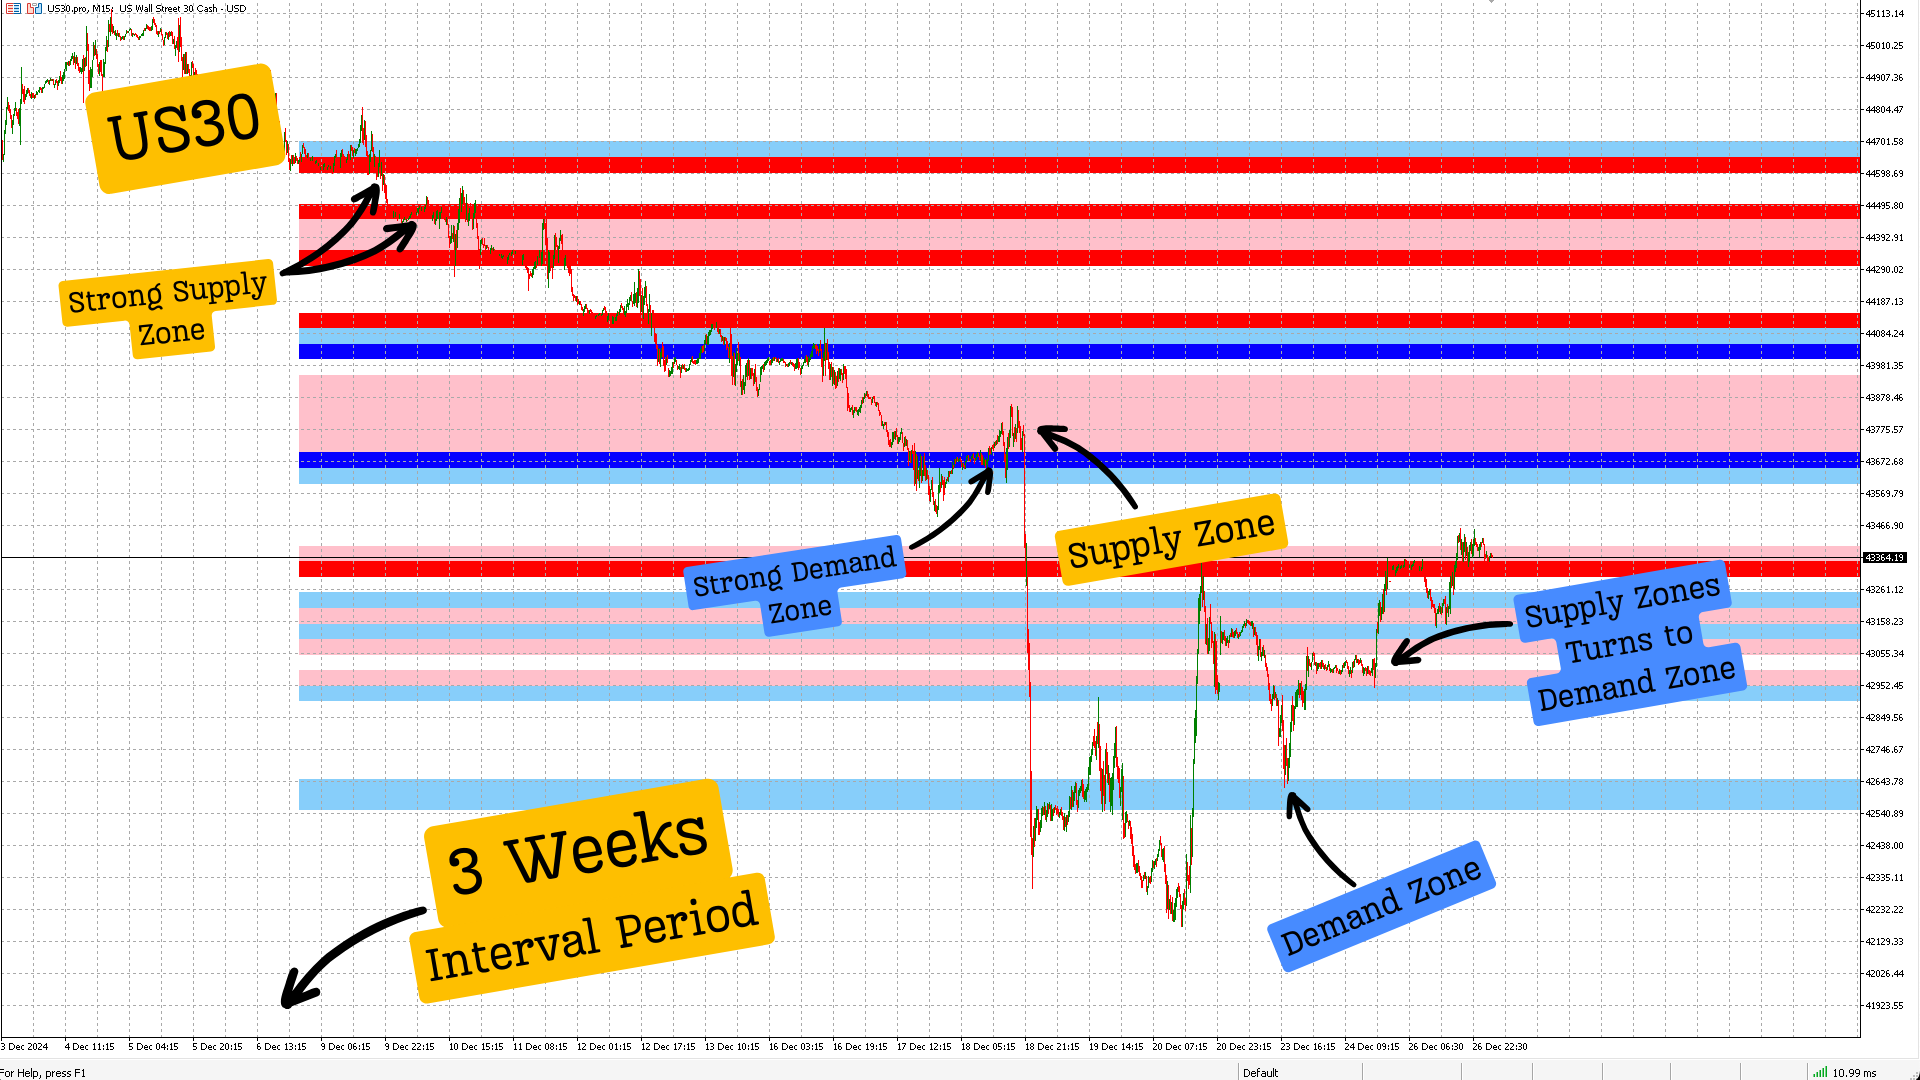
The Liquidity Pro algorithm automatically detects your trading pair, enabling you to instantly view liquidity, supply, and demand zones. The interval period feature allows you to view liquidity, supply and demand zones for up to 3 weeks, enabling traders to analyze the current week, previous week and the week before that. Currently, the indicator is compatible only with the popular trading pairs listed below, with additional pairs added based on user feedback and suggestions.
The Liquidity Pro allows you to observe where price consolidates, retraces, resists, or settles within support areas. It highlights areas where market participants are likely to react to price movements, providing real-time insights into market dynamics. Additionally the Liquidity Pro offers a visual representation, as the price approaches potential liquidity zones and "Supply & Demand" zones, enabling users to make quick and informed decisions.
One standout feature of this indicator is its ability to detect both bullish and bearish momentum. It visually indicates wether the momentum is bullish or bearish at the conclusion of the last tick, regardless of the chosen time frame. Further more you can view the "Liquidity" and "Supply & Demand" zones for the current week, current week and previous week or the last 3 weeks, however it is recommended to use the default settings regardless of trading pair.
Please refer to our attached YouTube video for valuable insights into the functionality and detailed breakdown of how the "Liquidity Pro" algorithm is a game changer, assisting traders view charts with clarity.
NOTICE: Before adding the demo indicator to your chart, please follow the steps outlined in the video to ensure the algorithm gathers the necessary data points from all time frames. If you have any questions, feel free to write to us in the comment section, and we’ll respond promptly.
What is Liquidity?
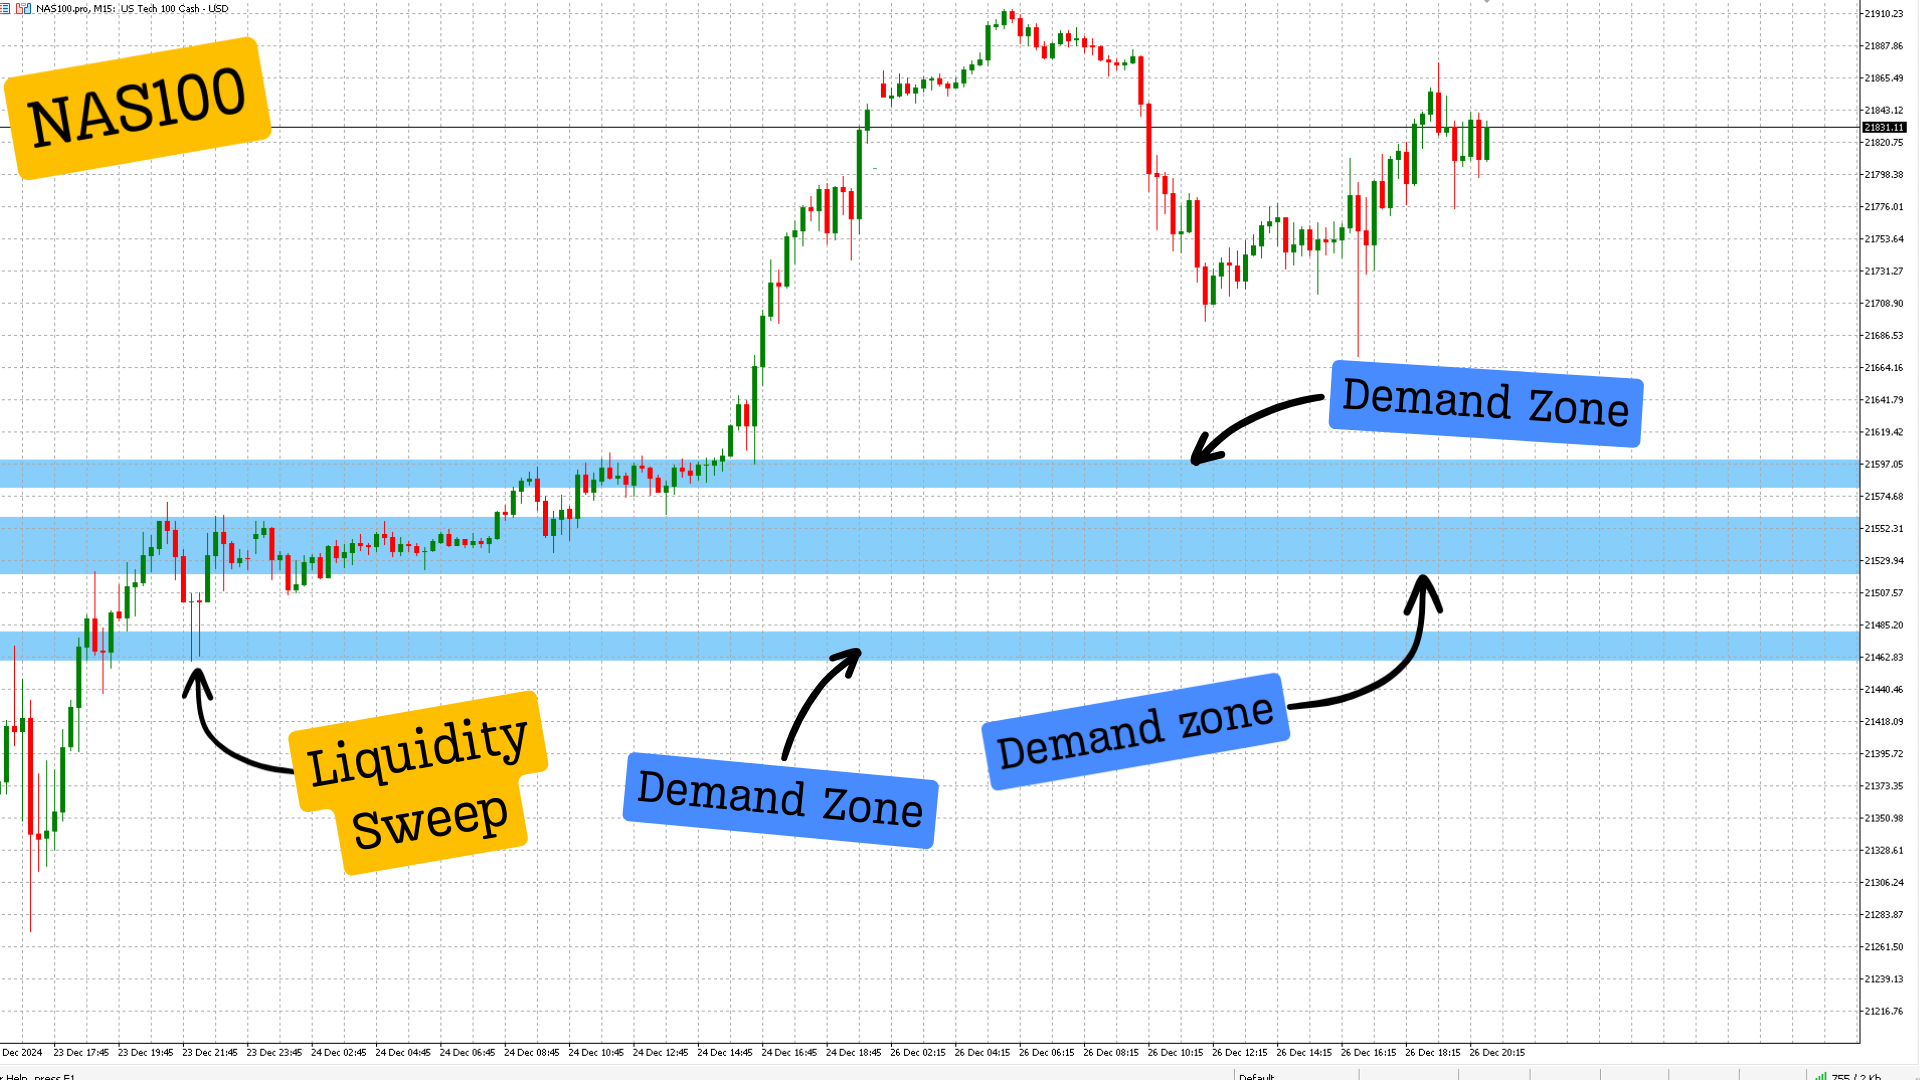
Liquidity refers to when traders are actively buying or selling at a particular price level, causing the price to remain relatively stable over a certain period. High liquidity indicates a substantial presence of both buyers and sellers actively participating in currency trading, resulting in narrow bid-ask spreads and stable market prices. On the contrary, low liquidity may lead to broader spreads and heightened price volatility due to a reduced number of market participants.
Liquidity Pro highlights liquidity zones as smaller rectangular zones, irrespective of colour, confined to a narrower price range. Liquidity is often found near support and resistance levels or areas where traders have placed stop-loss or pending orders, Indicating where large volumes of trades may occur, attracting institutional traders or market makers.
Liquidity can exist within supply and demand zones, as these zones attract orders, but not all liquidity areas are necessarily supply or demand zones.
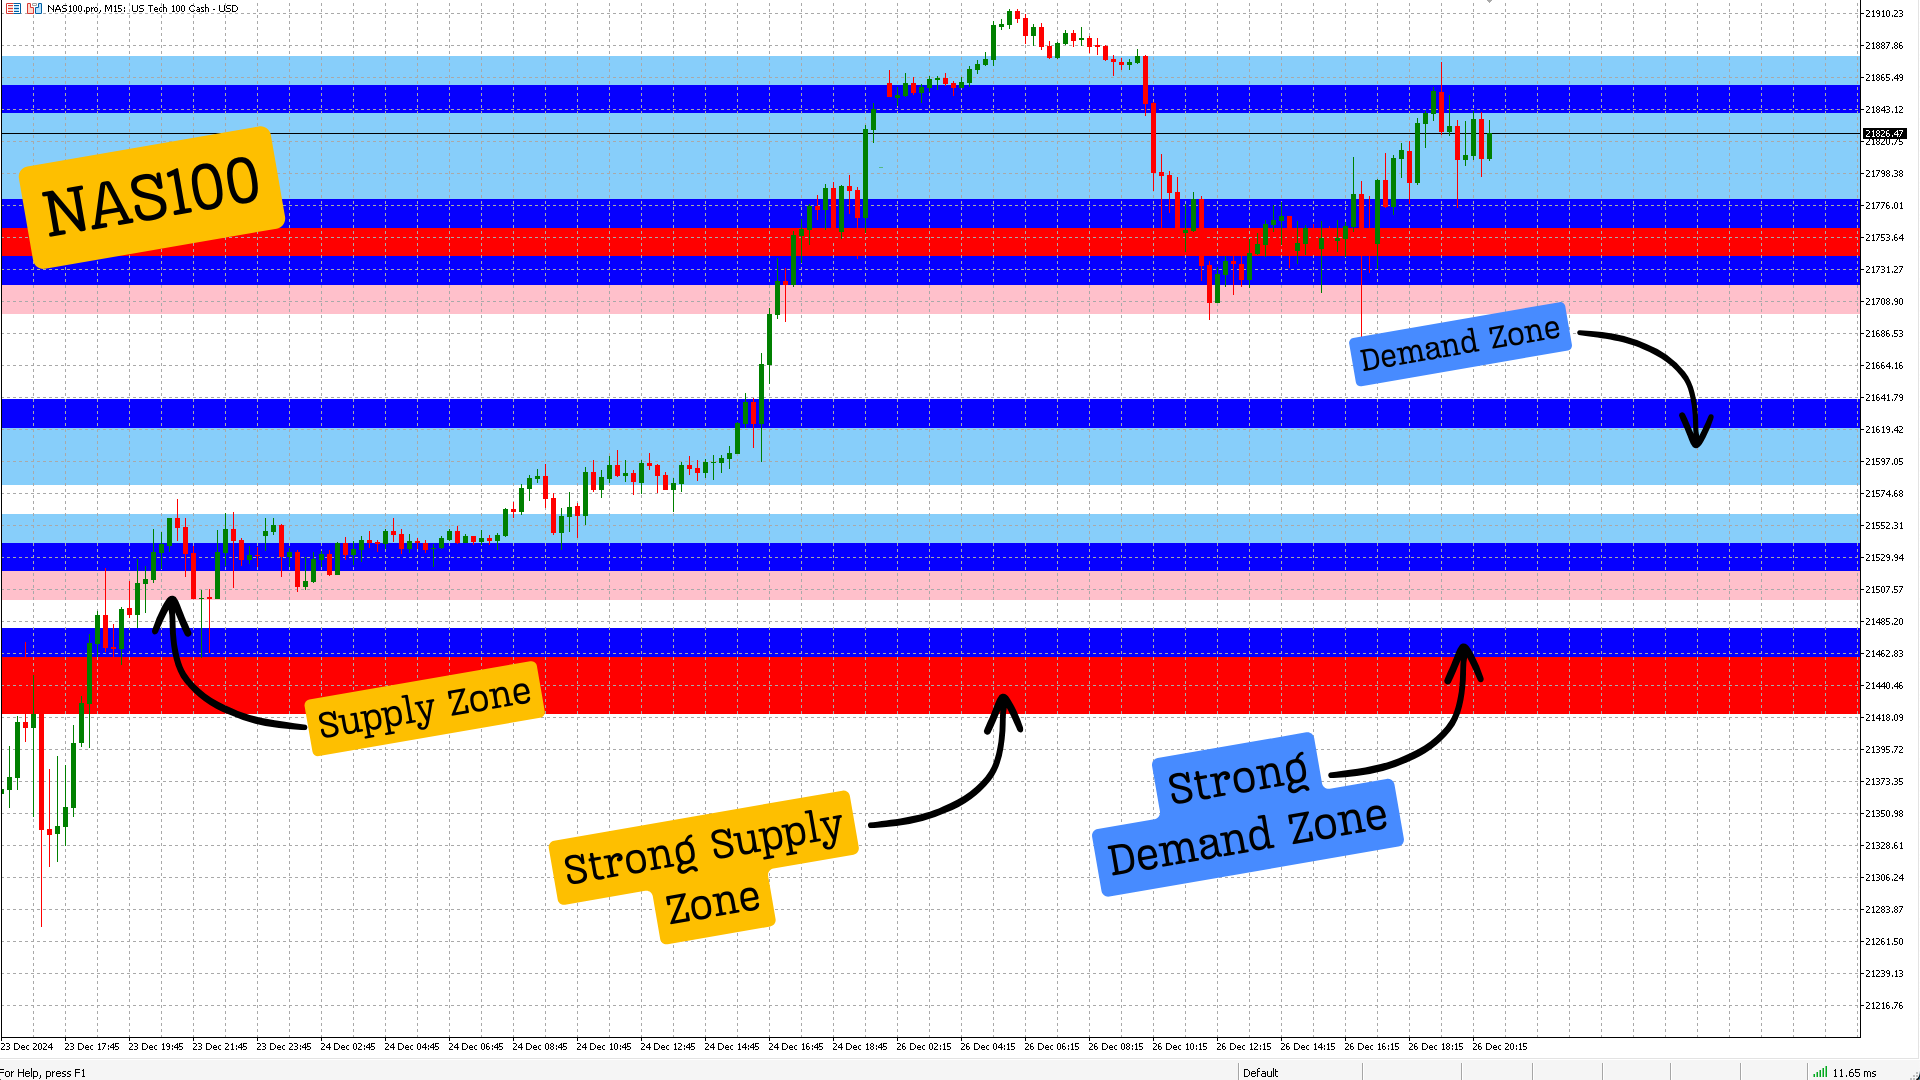
What are "Supply & Demand" zones?
Specific areas on a chart where selling (supply) or buying (demand) pressure is dominant, causing price reversals or sharp price movements away from a zone, indicating a prior imbalance in buy and sell orders.
Supply Zones (Red-Coloured Areas) These are areas where selling pressure is historically strong, causing price to reverse or consolidate downwards.
Strong Zones Zones (Red): Represents areas of high selling pressure, where price has consistently reversed or been rejected previously.
Supply Zones (Pink): Indicates less dominant selling pressure or potential areas where price may pause but not necessarily reverse strongly.
Demand Zones (Blue-Coloured Areas) These are areas where buying pressure is significant, leading to price reversals or upwards moves.
Strong Demand Zones (Blue): Represents areas of high buying pressure, where price has historically bounced with significant momentum.
Demand Zones (Light Blue): Suggests areas of lower buying pressure or possible price pauses rather than a stronger bounce.
Key Features
- Once loaded, the Liquidity Pro algorithm automatically identifies the trading pair and begins highlighting liquidity and supply & demand zones.
- Review liquidity and supply & demand zones for the current week, current week & previous week or the previous 3 weeks.
- Track liquidity and supply & demand zones down to the present second, through our superior algorithm.
- Liquidity areas are depicted as smaller rectangular zones, limited to a narrower price range.
- Displays distribution of prices across different levels to identify areas of concentrated trading activity.
- The algorithm updates liquidity zones and supply and demand zones in real time, tick by tick, with no data lag
- Dynamic coloured rectangular zones indicate supply or demand zone.
- Quickly visualize bullish or bearish momentum, through coloured rectangular zones.
- Offers an intuitive interface for easy interpretation and analysis of incoming data.
- Visual representation of price movement such as spikes, divergences or trends.
- Can be used in conjunction with other technical indicators for comprehensive market analysis.
- Allows users to examine historical areas of liquidity and supply & demand zones.
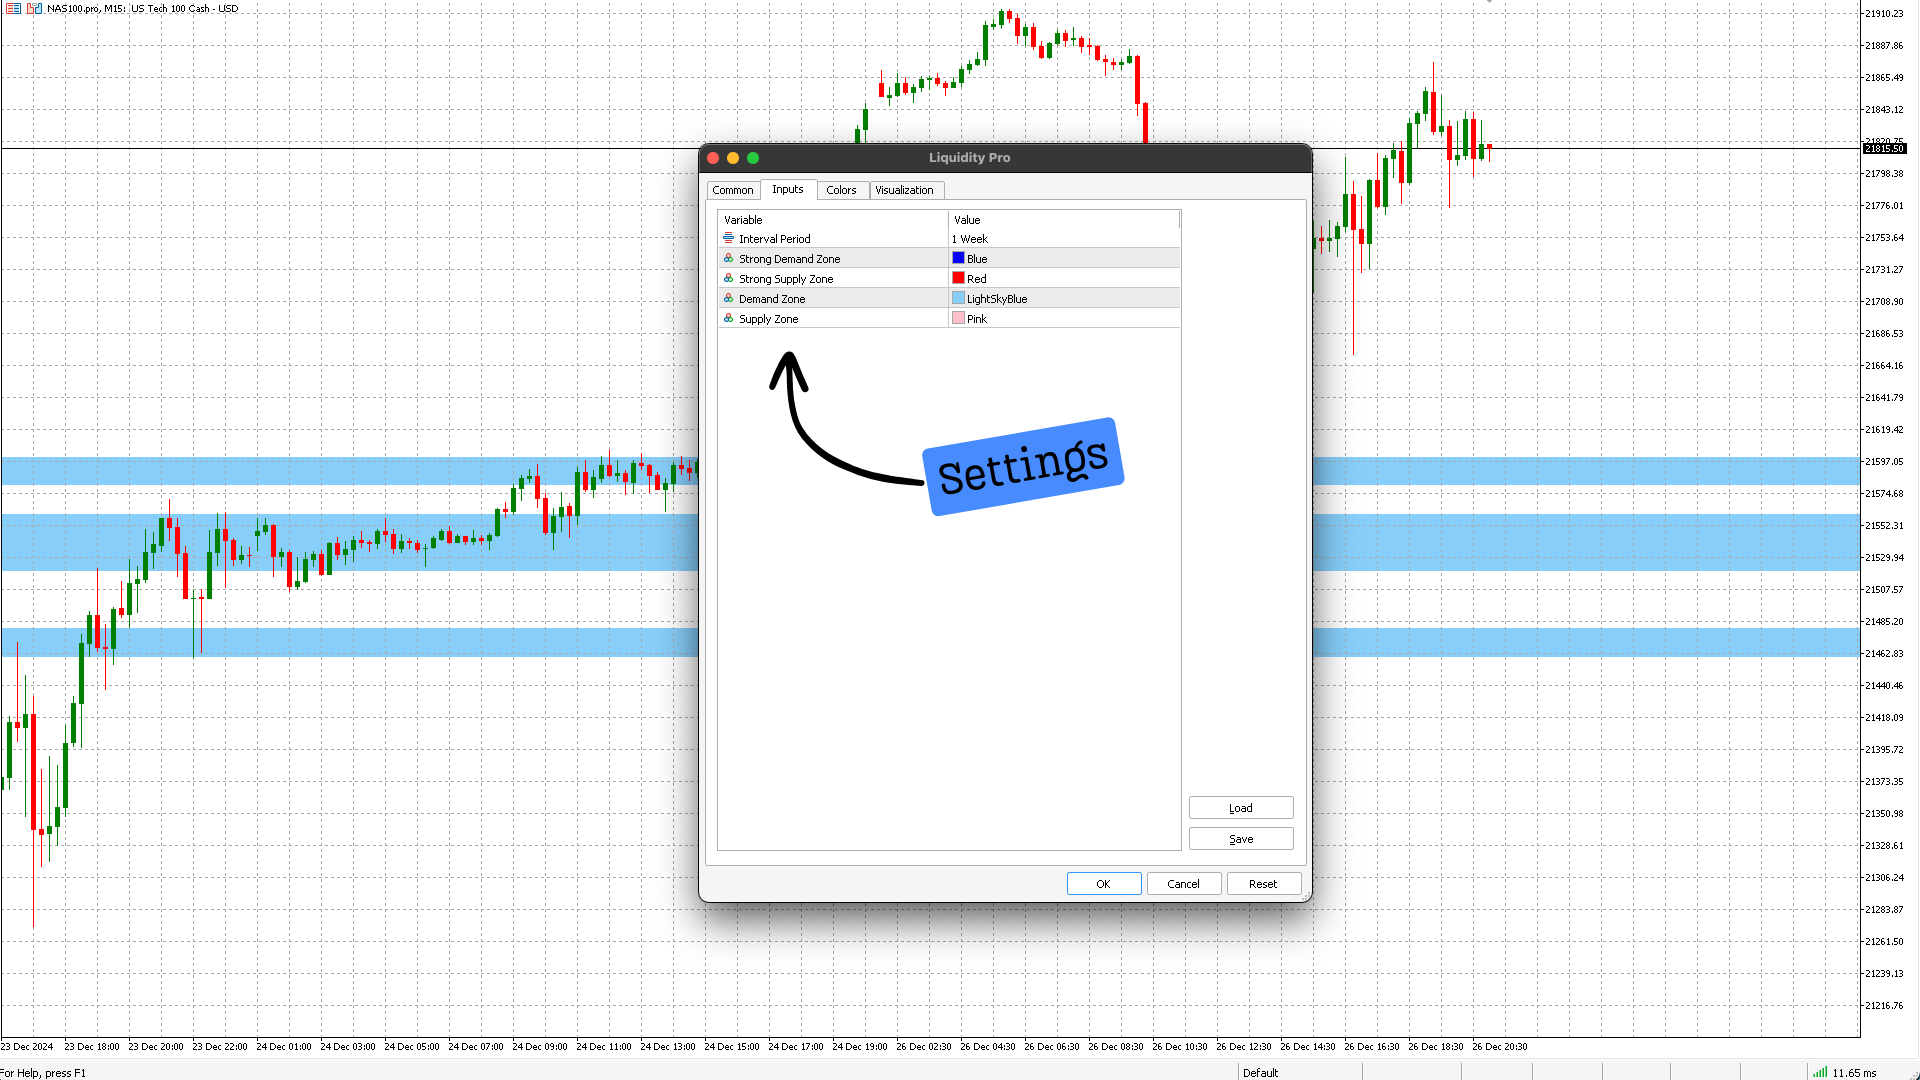
- Allows users to personalize settings such as zone colours.
Pricing
Our MT5 version of "Liquidity Pro" is priced at $66.00 per month, reflecting over two years of development, rigorous backtesting, and diligent bug fixing to ensure optimal functionality. Our confidence in the precision and accuracy of our indicators is such that we regularly showcase them in real-time market conditions through daily content on our social media channels.
Our belief in trading simplicity, adhering to the principle of buying low and selling high, is echoed in our indicators' clear display of potential entry and exit points. We consistently provide daily content demonstrating our indicators in action. We are committed to monitoring user feedback closely and making necessary improvements to our indicators should any bugs arise, ensuring that traders have access to the most effective tools for their trading endeavours.
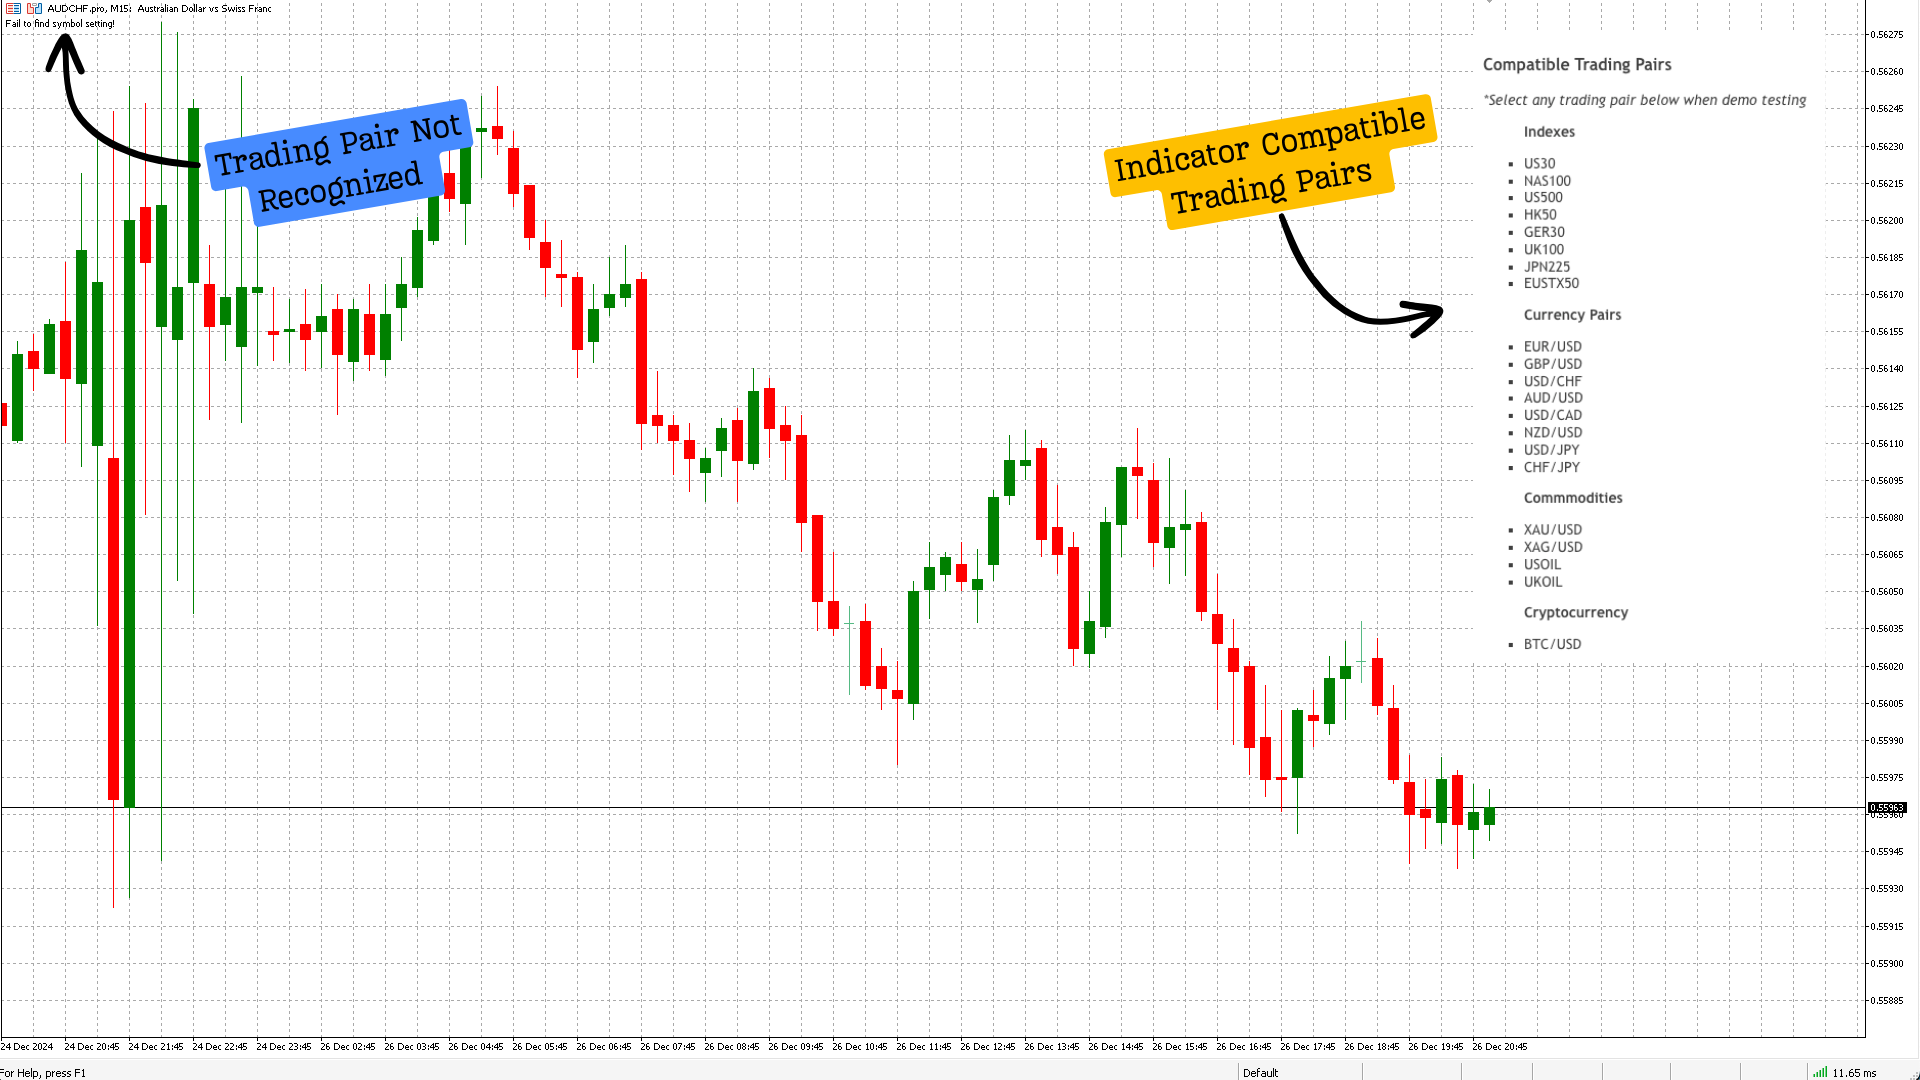
Compatible Trading Pairs
*Select any trading pair below when demo testingIndexes
- US30
- NAS100
- US500
- HK50
- GER30
- UK100
- JPN225
- EUSTX50
Currency Pairs
- EUR/USD
- GBP/USD
- USD/CHF
- AUD/USD
- USD/CAD
- NZD/USD
- USD/JPY
- CHF/JPY
Commmodities
- XAU/USD
- XAG/USD
- USOIL
- UKOIL
Cryptocurrency
- BTC/USD
MT4 Version Available: Yes
Trading Pairs: Most Popular Pairs (see compatible trading pairs)
Timeframe: Any
Brokers: Any
Account Type: Any
Prop Firms: Yes
Multi-Currency Indicator: Yes
Compatibility: Liquidity Pro works with currency pairs, indicies, equities, commodities and cryptocurrencies
NOTE: If you need help with settings or have any questions, please feel free to leave a comment in the comment section below. You can also visit our blog where you can leave a comment, and we'll respond promptly.
Disclaimer: We would like to emphasize that the information provided by seller and its affiliates, including its premium software subscribers, is not intended as financial advice and should not be construed as such. The content and opinions shared in our social media content and premium software subscription are for general informational purposes only, and they do not offer specific advice or recommendations for individuals or entities.
The seller and its affiliates do not endorse or recommend any securities, and our content is not an offer or solicitation to buy or sell any securities. The information provided in our social media content and premium software subscription may not be exhaustive and is subject to change without notice.
It's important to note that our social media content, research, information, and disclosures do not guarantee financial success or profitability. They provide insights into our investment strategies and how we manage our private capital in the financial markets.
Given the inherent risks of financial markets and the fact that past performance does not guarantee future results, we cannot assure specific outcomes or returns. Investing in financial markets carries the risk of loss.
Therefore, we advise conducting your own research and seeking professional advice before making any investment decisions. The information and opinions presented in our social media content and premium software subscription are meant for general informational purposes only and do not constitute specific advice or recommendations for any individual or entity.
By purchasing any premium software subscription, you acknowledge and accept that the seller and its affiliates are not liable for any investment decisions made based on information provided through social media content or premium subscription software.