• 概述
  • 评论 (2)
  • 评论 (1)
  • 新特性

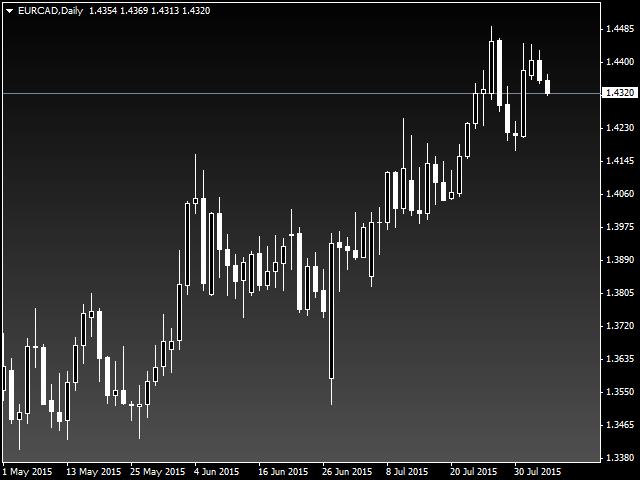
Original background

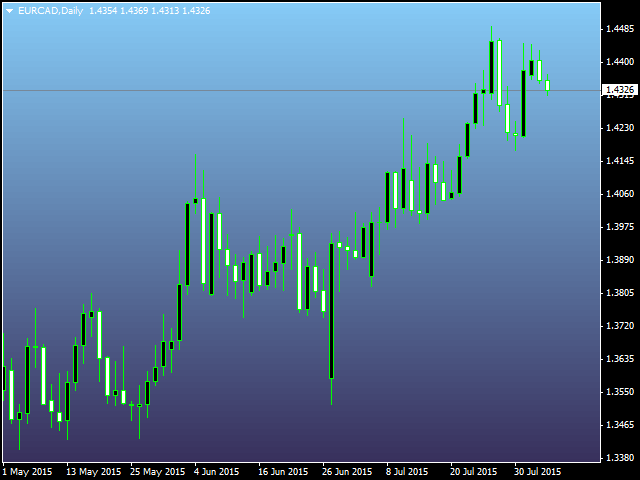
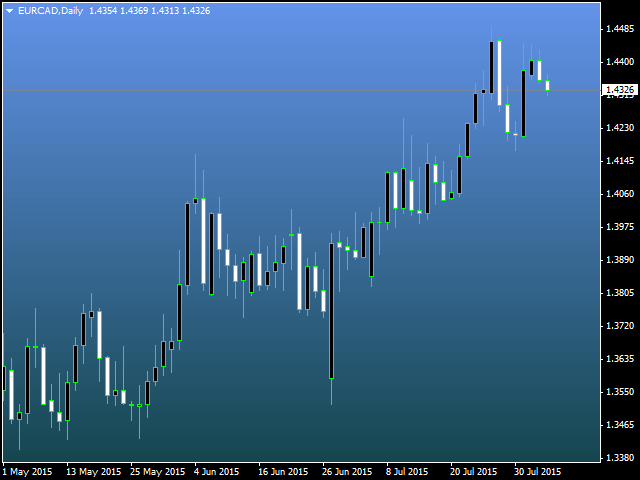
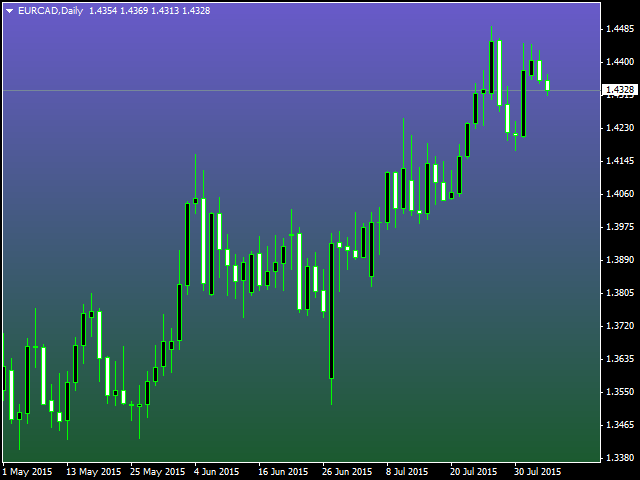
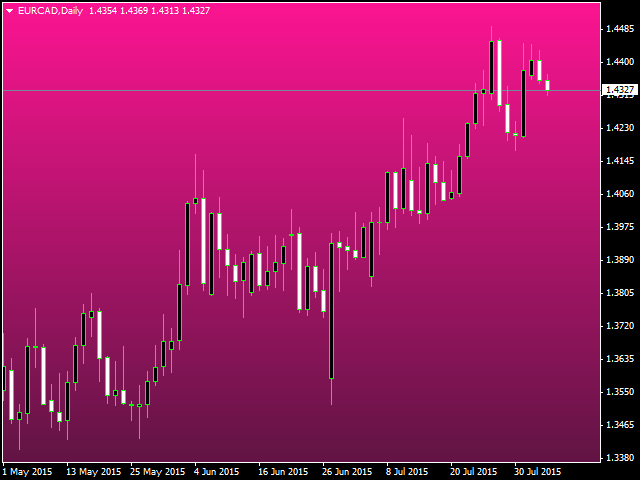
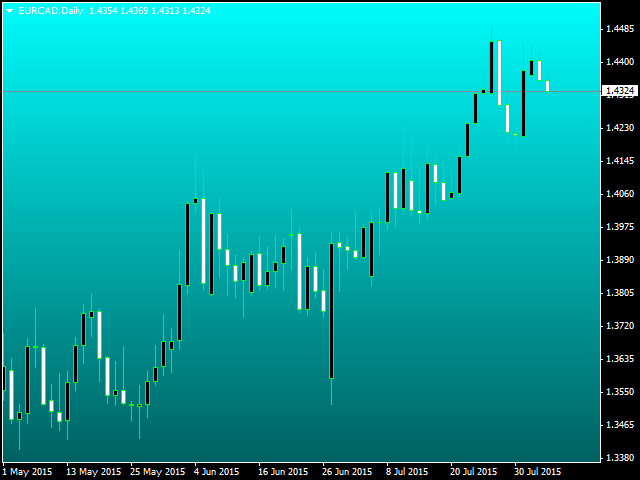
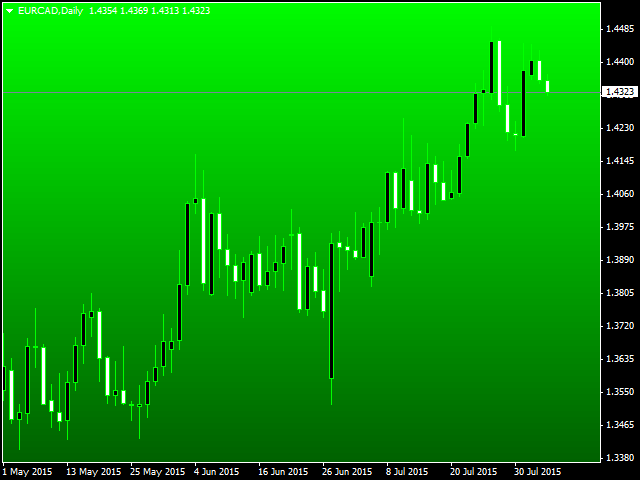
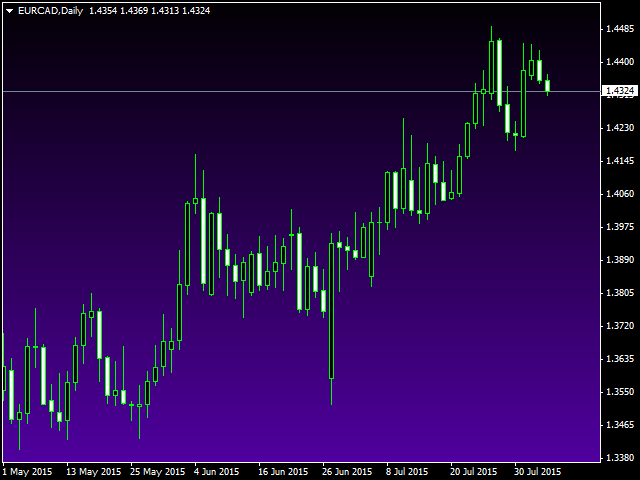
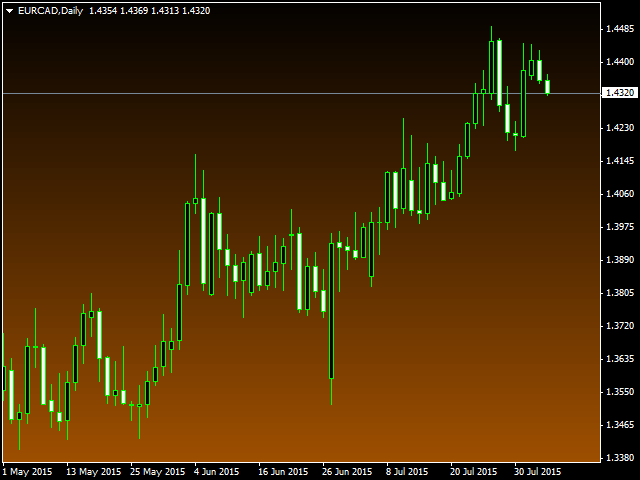
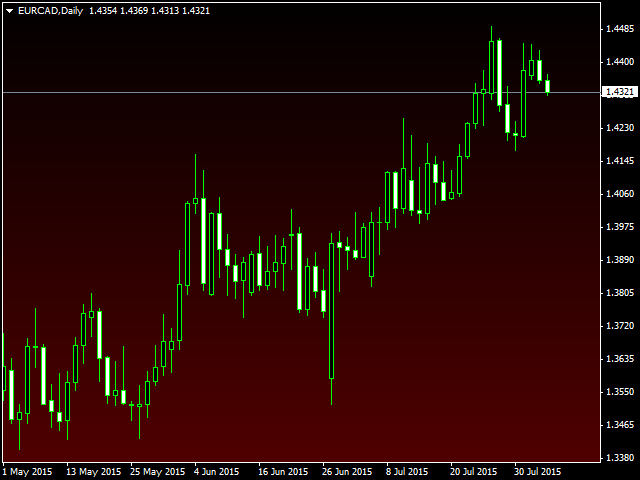
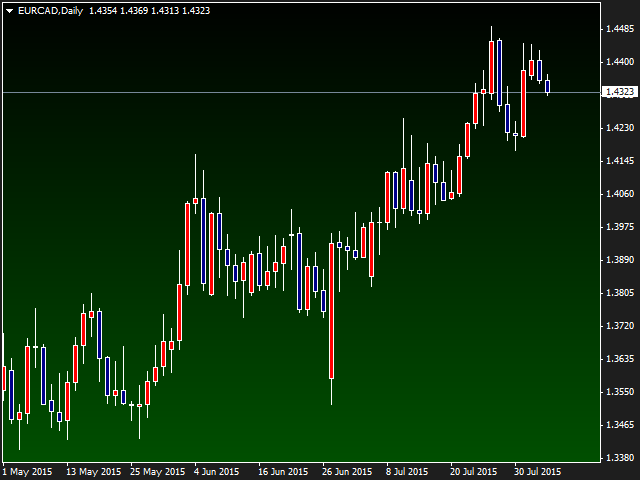
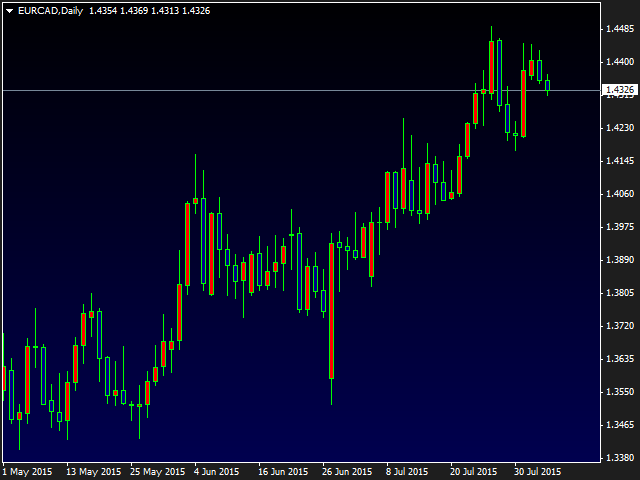
It is widely known that colors affect the emotional state of a human, especially if this human is a trader. Psychologists recommend that you follow your instincts and select the color of your environment that is most comfortable to you. In order to reduce emotional stress, impact of colors on a person should be considered. The optimal range of the most beneficial colors includes green, yellow-green and green-blue ones.

This indicator allows you to manage your emotional state and health. Choose a color (program) you currently need. It is simple: set the sunset (default) or sunrise mode and select a color palette. You can use both primary colors and custom sets. The option for replacing all chart background primary colors allows you to paint over all symbol chart windows. Set a background in the main background parameter, so that its initial parameters remain intact after deleting the indicator.

I hope, you will like the broad selection the product provides. Your feedback is appreciated.


Parameters

  • Sunrise mode (true) or sunset - sunrise (true) or sunset mode;
  • Replacement of the main colors of the background - change the main background colors (enable if you want to change the color of the bottom windows);
  • The basic background - main background (set after removing the indicator);
  • Background color of the screen - screen background color to be transformed.
推荐产品
Trendiness Index
Libertas LLC
5 (3)
"The trend is your friend" is one of the best known sayings in investing, because capturing large trendy price movements can be extremely profitable. However, trading with the trend is often easier said than done, because many indicators are based on price reversals not trends. These aren't very effective at identifying trendy periods, or predicting whether trends will continue. We developed the Trendiness Index to help address this problem by indicating the strength and direction of price trend
KopierMaschine - локальный копировщик сделок между различными счетами MetaTrader 4 и MetaTrader 5 в любом направлении расположенных на одном компьютере с интуитивно понятным интерфейсом. Направления копирования: MT4 --> MT5 MT4 --> MT4 MT5 --> MT5 MT5 --> MT4 для копирования между терминалами MetaTrader 4 и MetaTrader   5 необходимо приобрести версию продукта KopierMaschine  для  MetaTrader   5 Особенности Программа работает в двух режимах Master и Slave На один подчиненный счет можно копирова
Candlestick Pattern Scanner is a multi-timeframe and multi-symbol dashboard and alert system that checks all timeframes and currency pairs for different candlestick patterns that are formed in them. Scanner is integrated with support and resistance zones so you can check the candlestick patterns in the most important areas of the chart to find breakout and reversal patterns in the price chart. Download demo version   (works on M1,M5,M30,W1 timeframes) Read the full description of scanner paramet
Owl smart levels
Sergey Ermolov
4.63 (54)
MT5版本  |  FAQ Owl Smart Levels Indicator   是一個完整的交易系統,包含   Bill Williams   的高級分形、構建正確的市場波浪結構的 Valable ZigZag 以及標記準確入場水平的斐波那契水平等流行的市場分析工具 進入市場和地方獲利。 策略的详细说明 指示灯使用说明 顾问-贸易猫头鹰助手助理 私人用户聊天 ->购买后写信给我,我会将您添加到私人聊天中,您可以在那里下载所有奖金 力量在於簡單! Owl Smart Levels   交易系統非常易於使用,因此適合專業人士和剛開始研究市場並為自己選擇交易策略的人。 策略和指標中沒有隱藏的秘密公式和計算方法,所有策略指標都是公開的。 Owl Smart Levels 允許您快速查看進入交易的信號,突出顯示下訂單的水平並向您發送有關已出現信號的通知。 優點很明顯: 清楚地顯示主要和更高時間框架的趨勢方向。 指示儀器信號的出現。 標記開單、止損設置和固定利潤的水平。 沒有多餘的,只有必要的結構! ZigZag   表示全球趨勢的方向,因此也表示貿易方向。 市場反轉點的短線清楚地表明在
VR Cub
Vladimir Pastushak
VR Cub 这是获得高质量切入点的指标。该指标的开发是为了促进数学计算并简化对仓位入场点的搜索。多年来,该指标所针对的交易策略已被证明其有效性。交易策略的简单性是其巨大的优势,即使是新手交易者也能成功进行交易。 VR Cub 计算开仓点以及获利和止损目标水平,这显着提高了效率和易用性。查看使用以下策略进行交易的屏幕截图,了解简单的交易规则。 设置、设置文件、演示版本、说明、问题解决,可以从以下位置获取 [博客] 您可以在以下位置阅读或撰写评论 [关联] 版本为 [MetaTrader 5] 计算入场点的规则 开仓 要计算入场点,您需要将 VR Cub 工具从最后一个高点拉伸到最后一个低点。 如果第一个点在时间上早于第二个点,交易者等待柱线收于中线上方。 如果第一个点在时间上晚于第二个点,交易者等待柱线收于中线下方。 根据上述条件,严格在 柱线收盘 后建仓。 换句话说,如果我们在小时图上进行交易,那么从最高点到最低点的时间距离必须超过24小时,最高点和最低点之间的点数必须大于或等于平均价格变动每天。 维持和改变市场地位 可以有多个未平仓头寸;每个头寸都可以单独修改。 VR Cu
QM Pattern Scanner MT4
Reza Aghajanpour
4.83 (6)
QM (Quasimodo) Pattern is based on Read The Market(RTM) concepts. The purpose of this model is to face the big players of the market (financial institutions and banks), As you know in financial markets, big traders try to fool small traders, but RTM prevent traders from getting trapped. This style is formed in terms of price candles and presented according to market supply and demand areas and no price oscillator is used in it. RTM concepts are very suitable for all kinds of investments, includi
Historical and positioning trade volume calculator. Especially designed for trader who trade cryptos and familiar with the rules of Exchange. [IMPORTANT] Be sure load the historical orders in `Account History` tab for this tools to calculate properly.  - Just right click in `Account History` tab -> `Custom Period` -> Select the period you'd like it to calculate with. I've met some friends always want to know how their traded values and want to display them on chart. Here I represent to you
Trade with Gann on your side!! MASTER CIRCLE 360 CIRCLE CHART, originally created by Gann admitted that this is “The Mother of all charts”. It is one of the last studies that this great trader left for us. The numeric tab le is apparently quite simple like all the tables and is based on square numbers, the SQUARE OF 12 and is by evolution, one of the most important square numbers. Here we can find CYCLE, PRICE AND TIME thanks to angles and grades, to show past and future support and resistance.
An indicator of pattern #31 ("Long Island") from Encyclopedia of Chart Patterns by Thomas N. Bulkowski. The second gap is in the opposite direction. Parameters: Alerts - show alert when an arrow appears   Push - send a push notification when an arrow appears (requires configuration in the terminal) GapSize - minimum gap size in points ArrowType - a symbol from 1 to 17 ArrowVShift - vertical shift of arrows in points   ShowLevels - show levels ColUp - color of an upward line ColDn - color of
Noize Absorption Index MT4
Ekaterina Saltykova
5 (1)
Noize Absorption Index - is the manual trading system that measures the difference of pressure between bears forces and bulls forces. Green line - is a noize free index that showing curent situation. Zero value of index shows totally choppy/flat market.Values above zero level shows how powerfull bullish wave is and values below zero measures bearish forces.Up arrow appears on bearish market when it's ready to reverse, dn arrow appears on weak bullish market, as a result of reverse expectation. S
Expert candle finder for forex in MetaTrader 4 Expert candle finder is one of the practical trader assistant experts that is used in the forex financial market, this expert accurately identifies the candlestick patterns on the price chart as a signal, all the found candles. informs you. This expert is run on your Meta trader platform and in a very precise way, it examines all the currency pairs that are in your watch list and every currency pair that had a professional and good candlestick patt
Innovative and complex system for determining the correct market entries for trading. Calculated signals that determine the exact moments for exiting the market are based on a very complex mathematically algo. Tight and close Stop Loss and Take Profit. Slippage control to avoid news but seems that high impact news dont have any side efects on this EA. For each position, maximum levels for the profit and loss limits are established. TF M30. Pairs are EURGBP and GBPAUD. Not Martingale and Not Gr
Chart Patterns Detect 15 patterns (Ascending Triangle, Descending Triangle, Rising Wedge, Falling Wedge, Bullish Flag, Bearish Flag, Bullish Rectangle, Bearish Rectangle Symmetrical triangle, Head and Shoulders, Inverted Head and Shoulders, Triple top, Triple Bottom, Double Top, Double Bottom) Use historical data to calculate the probability of each pattern to succeed (possibility to filter notification according to the chance of success) gives graphic indication about the invalidation level and
Atomic Analyst
Issam Kassas
5 (3)
首先值得强调的是,该交易指标是非重绘、非延迟的指标,这使其成为手动和机器人交易的理想选择。 用户手册:设置、输入和策略。 Atomic Analyst是一种PA价格行动指标,利用价格的力量和动量来寻找市场上更好的机会。配备了高级过滤器,可帮助去除噪音和假信号,并提高交易潜力。使用多层复杂的指标,Atomic Analyst扫描图表,并将复杂的数学计算转化为任何初学者都能理解并用来做出一致交易决策的简单信号和颜色。 “Atomic Analyst”是专为新手和经验丰富的交易者量身定制的综合交易解决方案。它将高级指标和一流功能融合为一体的交易策略,使其成为所有类型交易者的多功能选择。 日内交易和剥头皮策略:专为快速准确的日内交易和短期交易而设计。 日内和摆动交易策略:可用作追求价格大幅波动的日内和摆动交易者的可靠工具。 多货币和市场:凭借其可靠的精度,在不同的工具和市场上运作。 多个时间框架:可在多个时间框架上使用,性能良好。 稳定性:所有指标均不重绘、不重绘和不滞后,确保可靠的信号。 信号清晰度:提供箭头信号,用于清晰的入场和出场点。 实时警报:通过交易入场、SL和TP警报通知交
MTF rvi Signals
Nebal S I Saloul
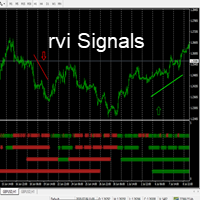
Hello This Indicator will draw Green (Up) and Red (Down) small arrows from Multi TimeFrames based in ( Relative Vigor Index ) to help you to take decision to buy or sell or waiting If there 4 green arrows in same vertical line that's mean (Up) and If there 4 Red arrows in same vertical line that's mean (Down)  and the options contain (Alert and Mobile , Mail Notifications). Please watch our video for more details https://youtu.be/MVzDbFYPw1M and these is EA for it https://www.mql5.com/en/market/
Meta Sniper
Samir Tabarcia
Requirements Optimized to work with   EURUSD-EURCHF-USDJPY, AUDUSD-CADJPY-AUDNZD, CHFJPY-NZDJPY-NZDUSD For timeframe 4H. *(Minimum recommended deposit is $300 for each Pair) for initial lot set to 0.10, My favorite Pair are (CHFJPY-NZDJPY-EURUSD-AUDNZD-USDJPY) Warning it will be SALE only 5 Copys at 60$ Then it will be update up to 200$  You can use it the way it is, For new Set Files will be add on (Comments) ECN broker with low spread is recommended to get better results. Setup is
Gap island
Dmitry Fedoseev
An indicator of pattern #30 ("Island Reversal") from Encyclopedia of Chart Patterns by Thomas N. Bulkowski (two gaps, the second gap is in the direction of the first one). Parameters: Alerts - show alert when an arrow appears   Push - send a push notification when an arrow appears (requires configuration in the terminal) GapSize - minimum gap size in points ArrowType - a symbol from 1 to 17 ArrowVShift - vertical shift of arrows in points   ShowLevels - show levels ColUp - color of an upward lin
BPSPanel
Remi Passanello
BPS Panel Breakout Pro Scalper Solution Panel This indicator is part of the   RPTrade Pro Solutions  systems. BPS Panel   is a daily trend indicator using Price Action, Dynamic Support and Resistances. It's designed to be used by anyone, even the absolute beginner in trading can use it. NEVER repaints . Indications are given   from close to close . Designed to   be used alone , no other indicators are required. Gives you the trend and potential Take Profit at the beginning of the day. How
Vizzion
Joel Protusada
Vizzion is a fully automated scalping Expert Advisor that can be run successfully using GBPJPY currency pair at H1 timeframe. Very Important This Expert Advisor can not run with any EAs in the same account. As part of the money management plan, it calculates and monitors the Margin Level % and assumes that all open trades are created by it. If you want an Expert Advisor that trades in a daily basis, this EA is not for you because using this requires a patience to wait for a few days or weeks o
Forex Fibonacci
Yuriy Kuzmin
4.33 (6)
After purchasing, you can request and receive any two of my products for free! После покупки вы можете запросить и получить два любых моих продукта бесплатно! The trading robot is designed for trading in the Forex market. Safety in trading: constant stop loss, take profit, protection from increased spread. The advantage of the advisor is trading Money Management (money management system) automatic lot calculation based on the size of your deposit, automatic installation and movement of Fibona
Levels ATR
Hafis Mohamed Yacine
The ATR Levels Indicator For MT4 is an indicator that is built specifically for traders who use the Meta Trader 4 for their trading analysis, charting of different currency pairs and trading assets, doing their technical analysis and making trading decisions all through the trading day as they work. One of the first major advantages of using the ATR Levels Indicator For MT4 is that it automatically helps the trader to spot very important levels in the markets based on the Average True Range In
Wave Wolf MT4
Andrei Salanevich
Wave Wold MT4外汇指标旨在搜索狼波并将其显示在交易终端的当前窗口中。 对于在交易中使用狼波的交易者来说,这是一个很好的指标。 它在交易策略中的应用将显着提高其效率和盈利能力。 有关指标的信息 与其他Wolf wave指标不同,Wave Wold MT4外汇指标具有许多显着提高其有效性的功能: 第一个是打开的Windows5point参数(真值)提供信息支持,即扩展了狼波出现在其上的图表的窗口。 例如,如果EURUSD、AUDUSD和GBPUSD图表是开放的,并且每个图表都安装了Wave WOLD MT4指标,那么如果检测到欧元模型,相应的图表将自动被带到其他图表的顶部,这在交易大量工具时变得非常方便。  第二个功能是MACD上的内置发散分析,用户可以自己选择参数(默认设置(12,26,9))。 顺便说一下,通常振荡器的值不显示在工作窗口上,只反映在形成点(5)时的价格标签的颜色上,特别是,如果标签的颜色是蓝色,则没有发散,如果颜色是红 如何使用指标 Wave WOLD MT4指标显示第4个形成点的假设Wolf模型和第5个点的形成区域(所谓的甜区,以黄色显示)。
Distinctive
Tatiana Savkevych
Distinctive is a forex trending arrow indicator for identifying potential entry points. I like it, first of all, because it has a simple mechanism of work, adaptation to all time periods and trading tactics. Created on the basis of a regression channel with filters. Plotting the Lawrence indicator signals on a price function chart using a mathematical approach. How it works - when the price breaks out in the overbought / oversold zone (channel levels), a buy or sell signal is generated. Every
The indicator displays the data of the Stochastic oscillator from a higher timeframe on the chart. The main and signal lines are displayed in a separate window. The stepped response is not smoothed. The indicator is useful for practicing "manual" forex trading strategies, which use the data from several screens with different timeframes of a single symbol. The indicator uses the settings that are identical to the standard ones, and a drop-down list for selecting the timeframe. Indicator Parame
Trend Ray
Andriy Sydoruk
The indicator shows the potential trend direction by cyclical-wave dependence. Thus, all the rays of the intersection will be optimal rays, in the direction of which the price is expected to move, taking into account the indicator period. Rays can be used as a direction for potential market movement. But we must not forget that the approach must be comprehensive, the indicator signals require additional information to enter the market.
Awesome Oscillator by Bill Williams with the ability to fine-tune and replace the averaging algorithms of the indicator, which significantly expands the possibilities of using this oscillator in algorithmic trading and brings it closer in its properties to such an indicator as the MACD. To reduce price noise, the final indicator is processed with an additional Smooth averaging. The indicator has the ability to give alerts, send mail messages and push signals when the direction of movement of th
Virtual Exchange Reserve Equity Monitor In an environment where exchanges offer increasingly high leverage ratios, it is all the more important for traders to tightly regulate their level of equity .  This software is designed to be run in the background on any virtual private server that can run Meta Trader 4/5.  It implements basic equity control functions ahead of the broker---allowing users to set their own equity trailing stop, an equity limit to lock-in a certain profit margin, and a unive
FREE
PipFinite Exit EDGE
Karlo Wilson Vendiola
4.88 (161)
Did You Have A Profitable Trade But Suddenly Reversed? In a solid strategy, exiting a trade is equally important as entering. Exit EDGE helps maximize your current trade profit and avoid turning winning trades to losers. Never Miss An Exit Signal Again Monitor all pairs and timeframes in just 1 chart www.mql5.com/en/blogs/post/726558 How To Trade You can close your open trades as soon as you receive a signal Close your Buy orders if you receive an Exit Buy Signal. Close your Sell orde
>>> BIG SALE PROMOTION: 50% OFF + GIFT EA!  - Promo price: $64 / Regular price $129 <<< - The promotion will end soon! The Forex Trend Tracker is an advanced tool designed to enhance the trading capabilities of forex traders. This sophisticated indicator uses complex mathematical formulas alongside the Average True Range (ATR) to detect the beginnings of new upward and downward trends in the forex market. It offers visual cues and real-time alerts to give traders a competitive advantage in th
History Pattern Search
Yevhenii Levchenko
该指标建立当前报价,可以与历史报价进行比较,并在此基础上进行价格走势预测。指示器有一个文本字段,用于快速导航到所需日期。 选项: 符号 - 选择指标将显示的符号; SymbolPeriod - 选择指标从中获取数据的时段; IndicatorColor - 指示器颜色; HorisontalShift - 由指标绘制的报价移动指定的柱数; Inverse - true 反转引号,false - 原始视图; ChartVerticalShiftStep - 图表垂直移动(键盘上的向上/向下箭头); 接下来是文本字段的设置,您可以在其中输入日期,您可以通过按“回车”立即跳转到该日期。 接下来是文本字段的设置,您可以在其中输入日期,您可以通过按“回车”立即跳转到该日期。
该产品的买家也购买
Trade Assistant MT4
Evgeniy Kravchenko
4.46 (184)
它有助于计算每笔交易的风险,容易安装新的订单,具有部分关闭功能的订单管理, 7 种类型的追踪止损和其他有用的功能。 注意,该应用程序在策略测试器中不起作用。 Manual, Description, Download demo 线条功能  - 在图表上显示开仓线、止损线、止盈线。 有了这个功能,就可以很容易地设置一个新的订单,并在开仓前看到它的附加特性。   风险管理  - 风险计算功能在考虑到设定的风险和止损单的大小的情况下,计算新订单的成交量。它允许你设置任何大小的止损,同时观察设定的风险。 批量计算按钮 - 启用 / 禁用风险计算。 在 " 风险 " 一栏中设置必要的风险值,从 0 到 100 的百分比或存款的货币。 在 " 设置 " 选项卡上选择风险计算的变量: $ 货币, % 余额, % 资产, % 自由保证金, % 自定义, %AB 前一天, %AB 前一周, %AB 前一个月。   R/TP 和 R/SL - 设置止盈和止损的关系。 这允许你设置相对于损失的利润大小。 例如, 1 : 1 - 这决定了 TP = SL 的大小。 2 : 1 - 这意味着 TP 是
您认为在价格可以瞬间变化的市场中,下单应该尽可能简单吗? 在 Metatrader 中,每次您要开单时,您都必须打开一个窗口,您可以在其中输入开盘价、止损和止盈以及交易规模。 在金融市场交易中,资本管理对于维持您的初始存款并使其倍增至关重要。 因此,当您想下订单时,您可能想知道应该开多大的交易? 在这单笔交易中,您应该承担多少百分比的存款? 您可以从这笔交易中获利多少,利润风险比是多少? 在您设置交易规模之前,您需要进行必要的计算,以获得交易规模应该是多少的问题的答案。 想象一下,您有一个工具可以自动完成所有这些工作。 您打开图表,进行市场分析并用水平线标记入场点、防御点(止损)和目标(止盈),最后您定义风险水平,例如 作为可用资本的百分比,您可以在此交易中承担,此时程序提供: 定义风险和止损规模的可接受交易规模 以点数、点数和账户货币计的止损和获利值 风险回报率 现在剩下的就是点击面板上的相应按钮来打开交易。 如果您是黄牛,需要在不设置防御或目标的情况下快速打开和关闭交易,那么您可以在交易管理器面板中轻松掌握一切,您可以在其中定义固定订单参数并通过单击“购买”或 “卖出”按钮。 关闭
Local Trade Copier EA MT4
Juvenille Emperor Limited
5 (85)
通过 Local Trade Copier EA MT4 获得非常快速的交易复制体验。它的简单1分钟设置,使您可以在同一台Windows计算机或Windows VPS上在多个MetaTrader终端之间复制交易,具有闪电般快速的复制速度,低于0.5秒。 无论您是初学者还是专业交易者, Local Trade Copier EA MT4 都提供了广泛的选项,可根据您的特定需求进行自定义。对于任何希望增加利润潜力的人来说,这都是终极解决方案。 今天就尝试一下,看看为什么它是市场上最快、最简单的贸易复印机! 提示: 您可以在您的模拟账户中下载并试用 Local Trade Copier EA MT4 模拟版: 这里 将下载的免费演示文件粘贴到您的 MT4 >> 文件 >> 打开数据文件夹 >> MQL4 >> 专家文件夹并重新启动您的终端。  免费演示版本每次可在 4 小时内发挥全部功能,仅限演示帐户。 要重置试用期,请转至 MT4 >> 工具 >> 全局变量 >> Control + A >> 删除。 请仅在非关键模拟账户上执行此操作,不要在挑战道具公司账户中执行此操作。 Local
Exp COPYLOT CLIENT for MT4
Vladislav Andruschenko
4.66 (67)
MetaTrader 4 的交易复制器。     它从任何账户复制外汇交易、头寸、订单。 它是最好的贸易复印机之一     MT4 - MT4,MT5 - MT4     为了   复制 MT4     版本(或     MT4 - MT5 MT5 - MT5     为了   复制MT5     版本)。 MT5版本 详细描述   +DEMO +PDF 如何购买 如何安装     如何获取日志文件     如何测试和优化     Expforex 的所有产品 复印机 版本       MetaTrader 5 终端 (   МТ5 - МТ5, МТ4 - МТ5   )-   Copylot 客户端 MT5 独特的复制算法将所有交易从主账户准确复制到您的客户账户。 该产品还以其高运行速度而著称,并且具有强大的错误处理能力。 一组强大的功能。 该程序可以在多个终端绑定上运行。 使用它作为您在一个账户上交易的多个账户的交易 的同步器 , - COPYLOT 会将您的交易复制到其他终端。 从已关闭的账户中复制 Invest 密码; 部分关闭仅从 mt4 到 mt4
The product will copy all telegram signal to MT4   ( which you are member  ) , also it can work as remote copier.  Easy to set up, copy order instant, can work with almost signal formats, image signal, s upport to translate other language to English Work with all type of channel or group, even channel have "Restrict Saving Content", work with  multi channel, multi MT5 Work as remote copier: with signal have ticket number, it will copy exactly via ticket number. Support to backtest signal. How to
TradePanel MT4
Alfiya Fazylova
4.91 (89)
交易面板是一个多功能的交易助手。 该应用程序包含 50 多个手动交易功能,并允许您自动执行大多数交易操作。 购买之前,您可以在模拟帐户上测试演示版本。 演示 此处 。 完整说明 此处 。 贸易。 让您一键执行基本交易操作: 开立挂单和开仓。 平仓挂单和持仓。 仓位反转(平仓买入并开仓卖出,或平仓卖出并开仓买入)。 锁定仓位(通过开立相反仓位使卖出和买入仓位的交易量相等)。 对所有仓位进行部分平仓。 将所有头寸的止盈和/或止损设置为同一水平。 将所有仓位的止损设置为盈亏平衡水平。 开仓订单和仓位时,您可以: 根据既定风险自动计算订单量。 一键打开多个订单。 将计算出的交易量分配给多个订单。 使用面板创建的线条和标记在图表上可视化未来订单的交易水平位置。 开仓时,设置最大点差限制。 使用止盈规模与止损规模的自动比率。 使用虚拟止损和止盈。 将当前点差添加到止损和止盈。 使用 ATR 指标计算止盈和止损。 设置待处理订单的到期日期。 使用挂单跟踪(挂单自动移动到价格后面指定的距离)。 平仓订单和平仓时,您可以: 一键按订单或仓位类型关闭。 只需点击一下,即可仅平仓盈利或无利可图的头寸。 一键
Trade copier MT4
Alfiya Fazylova
4.68 (31)
Trade Copier 是一种专业实用程序,旨在复制和同步交易账户之间的交易。 复制发生从供应商的帐户/终端到收件人的帐户/终端,安装在同一台计算机或 vps 上。 在购买之前,您可以在演示帐户上测试演示版本。 演示 这里 。 完整说明 这里 。 主要功能和优点: 支持复制MT4>MT4、MT4>MT5、MT5>MT4,包括МТ5 netting账户。 供应商和收件人模式在同一产品中实现。 简单直观的界面,允许您直接从图表中实时控制复制。 连接中断或终端重新启动时不会丢失设置和位置。 允许您选择要复制的符号,也可以替换接收者的符号,例如 EURUSD> USDJPY。 支持回拷贝。 能够仅复制某些订单。 允许您设置开仓交易价格的最大差异和最大时间延迟。 正确复制部分订单关闭的执行。 计算复制手数的几种方法。 同步止盈和止损。有几种方法可以计算它们的位置。 支持通过执行在“Market account”上工作,其中 SL / TP 仅在开仓后设置。 如何使用简单的设置复制交易 将供应商终端和接收终端安装在同一台计算机或 VPS 上。 在供应商终端上以“Master”模式安装复印机,然后
交易管理器可帮助您快速进入和退出交易,同时自动计算风险。 包括帮助您防止过度交易、报复性交易和情绪化交易的功能。 交易可以自动管理,账户绩效指标可以在图表中可视化。 这些功能使该面板成为所有手动交易者的理想选择,并有助于增强 MetaTrader 4 平台。多语言支持。 MT5版本  |  用户指南+演示 交易经理在策略测试器中不起作用。 如需演示,请参阅用户指南 风险管理 根据%或$自动调整风险 可选择使用固定手数或根据交易量和点自动计算手数 使用 RR、点数或价格设置盈亏平衡止损 追踪止损设置 最大每日损失百分比,在达到目标时自动平仓所有交易。 保护账户免遭过多提款并阻止您过度交易 最大每日损失(以美元为单位)在达到目标时自动关闭所有交易。 保护账户免遭过多提款并阻止您过度交易 一键实现所有交易的盈亏平衡 自动计算从手机/电话发送的交易的风险 OCO 在设置中可用 交易和头寸管理 通过设置每月、每周、每天、每小时或每分钟的最大交易次数,停止过度交易和报复性交易。 高级挂单管理。 调整何时关闭挂单的规则 追踪挂单 支持市价订单和挂单 每日最大利润目标(以美元为单位)以确保头寸并停
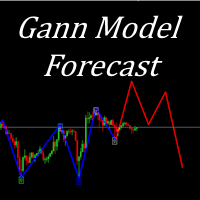
I present to your attention a powerful utility for predicting the future movement of an asset based on W.D. Ganna’s law of vibration. This utility analyzes the selected market model and provides codes for future possible market movement patterns. If you enter the selected code into the appropriate box, you will receive a forecast of the potential market movement. The utility has the ability to display several potential forecast models. The forecast is not yet tied to time and price and gives th
MT4 至 Telegram 信号提供者 是一款易用、可完全自定义的工具,它使发送信号到 Telegram 成为可能,将您的账户变成信号提供者。 消息的格式 可以完全自定义! 但是,为了简便使用,您也可以选择一个预设模板,并能够启用或禁用消息的特定部分。 [ 演示 ]  [ 手册 ] [ MT5 版本 ] [ Discord 版本 ] [ Telegram 频道 ] 设置 可通过 用户指南 获取逐步说明。 无需了解 Telegram API;开发者提供所需的一切。 主要特性 自定义发送给订阅者的订单详情的能力 您可以创建分层订阅模型,例如铜牌、银牌、金牌。金牌订阅可获得所有信号等。 按订单号、符号或备注过滤订单 包括执行订单的图表的屏幕截图 在发送的屏幕截图上绘制已关闭的订单,以便额外验证 推迟发送新订单消息的可能性,以便在发送前对位置进行调整 订单详情的全透明度: 新的市场订单 *附带屏幕截图 订单修改(止损、获利点) 已关闭订单 *附带屏幕截图 部分关闭订单 ** 新的挂起订单 修改的挂起订单(进场价格) 挂起订单激活(作为新的市场订单) 已删除的挂起订单
Trade Dashboard MT4
Fatemeh Ameri
5 (30)
疲于复杂的订单下达和手动计算?Trade Dashboard 是您的解决方案。凭借其用户友好的界面,订单下达变得轻而易举,只需点击一下,您就可以开设交易、设置止损和止盈水平、管理交易手数,并计算风险回报比,让您只需专注于您的策略。告别手动计算,使用 Trade Dashboard 简化您的交易体验。 立即下载演示版本 。 您可以在这里找到仪表盘功能和特性的详细信息 。 加入 Telegram 频道 。 购买后请给我发消息以获取支持。如果您需要添加更多功能,可以在产品的评论区留下您的想法,我愿意听取任何建议,希望您能在使用我的产品时获得最佳体验 。 这是 MT5 版本。 风险管理:使用 Trade Dashboard,可以将您的风险设置为账户余额或权益的百分比,或将风险设置为总金额。在图表上直观地定义您的止损,让工具准确计算每个货币对的适当手数。该工具还可以根据您期望的风险回报比自动设置止盈水平。它甚至可以在手数计算中涵盖佣金和点差费用。此外,您的止损和止盈可以转变为虚拟水平,隐藏于经纪商。通过 Trade Dashboard 的高级风险管理功能,掌控风险,保护您的资本。
The product will copy all  Discord  signal   to MT4   ( which you are member  ) , also it can work as remote copier.  Easy to set up. Work with almost signal formats, support to translate other language to English Work with multi channel, multi MT4. Work with Image signal. Copy order instant, auto detect symbol. Work as remote copier: with signal have ticket number, it will copy exactly via ticket number. How to setup and guide: Let read all details about setup and download Discord To MetaTrade
Grid Manual MT4
Alfiya Fazylova
4.74 (19)
Grid Manual是一个交易面板,用于处理订单网格。 该实用程序是通用的,具有灵活的设置和直观的界面。 它不仅可以在亏损方向上设置订单网格,还可以在盈利方向上设置订单网格。 交易者不需要创建和维护订单网格,实用程序会这样做。 打开一个订单就足够了,Grid manual会自动为它创建一个订单网格,并伴随它直到非常关闭。 完整说明和演示版 此處 。 该实用程序的主要特性和功能: 伴隨以任何方式打開的訂單,包括從移動終端打開的訂單。 適用於兩種類型的網格:“限制”和“停止”。 使用兩種方法計算網格間距:固定和動態(基於 ATR 指標)。 允許您更改未結訂單網格的設置。 顯示圖表上每個網格的盈虧平衡水平。 顯示每個網格的利潤率。 允許您一鍵關閉網格中的盈利訂單。 讓您一鍵關閉每個訂單網格。 允許您對訂單網格應用追踪止損功能。 允許您在訂單網格上應用將訂單網格的止損轉移到盈虧平衡水平的功能。 相對於訂單網格的盈虧平衡水平自動重新排列止盈(僅在限價網格模式下,距離取決於所選的計算類型:“保守”或“激進”)。 最多可管理 20 個訂單網格,每個網格最多可包含 100 個訂單。
Take a Break
Eric Emmrich
5 (28)
The most advanced news filter and drawdown limiter on MQL market NEW: Take a Break can be backtested against your account history! Check the " What's new " tab for details. Take a Break has evolved from a once simple news filter to a full-fledged account protection tool. It pauses any other EA during potentially unfavorable market conditions and will continue trading when the noise is over. Typical use cases: Stop trading during news/high volatility (+ close my trades before). Stop trading when
控制您的外匯投資組合。立即查看您的站立位置、工作原理以及導致您疼痛的原因! 此處提供 MT5 版本: https://www.mql5.com/en/market/product/58658 交易經理儀表板旨在讓您一目了然地顯示您當前在外匯市場中的每個頭寸,並使風險管理和貨幣敞口更易於理解。 對於通過多個頭寸或交易網格和籃子策略逐漸進入市場的交易者,這是需要查看的關鍵信息。監控終端中的多個位置通常很難管理。 過度槓桿化和使用低風險:回報是新交易者和一些經驗豐富的交易者面臨的主要問題,交易經理向您展示您對每種貨幣的風險敞口,確保您不會同時進行雙向交易。 特徵: 未平倉交易 - 查看您當前按貨幣對排序的所有未平倉交易。您不僅可以在該貨幣對上看到您的方向偏差,還可以在該貨幣對上運行的每筆交易或頭寸上看到您的方向偏差。 回撤和利潤信息 - 立即查看您交易活躍的貨幣對的回撤或盈利情況。輕鬆識別需要管理的交易。 手數大小 - 查看您在每個貨幣對上的手數以及您進行的交易數量。 風險敞口 - 查看您對每種貨幣的方向偏差,以確保您不會在另一個入場時以相反的方向交易。另請查看您在該貨幣中使用
The top-selling EAs on the market cost a lot and one day they are suddenly gone. This is because one strategy will not work in the forex market all the time. Our product is unique from all others in the MQL Marketplace because our EA comes with 34+ built-in indicators that allow adding more strategies every time.  You build your strategy and keep updating it. If one strategy does not work, simply build another all using only one EA. This is All-In-One EA in this market place. You can use as trad
RedFox Copier Pro
Rui Manh Tien
4.75 (12)
FREE SIGNAL CHANEL:  https://t.me/redfox_daily_forex_signals Time saving and fast execution Whether you’re traveling or sleeping, always know that Telegram To Mt4 performs the trades for you. In other words, Our   Telegram MT4 Signal Trader  will analyze the trading signals you receive on your selected Telegram channels and execute them to your Telegram to MT4 account. Reduce The Risk Telegram To Mt4   defines the whole experience of copying signals from   Telegram signal copier to mt4  p
将信号从您所属的任何渠道(包括私人和受限渠道)直接复制到您的 MT4。 该工具在设计时充分考虑了用户的需求,同时提供了管理和监控交易所需的许多功能。 该产品采用易于使用且具有视觉吸引力的图形界面。 自定义您的设置并在几分钟内开始使用该产品! 用户指南 + 演示  |     MT5版本  |     不和谐版本 如果您想尝试演示,请参阅用户指南。 Telegram To MT4 接收器在策略测试器中不起作用! Telegram 至 MT4 功能 一次复制多个通道的信号 从私人和受限频道复制信号 不需要机器人令牌或聊天 ID(如果出于某种原因需要,您仍然可以使用这些) 使用风险百分比或固定手数进行交易 排除特定符号 选择复制所有信号或自定义要复制的信号 配置单词和短语以识别所有信号(默认值应适用于 99% 的信号提供商) 配置时间和日期设置以仅在需要时复制信号 设置一次打开的最大交易量 交易和头寸管理 使用信号或自动设置的管理 通过设置每月、每周、每天、每小时或每分钟的最大交易次数,停止过度交易和报复性交易。 支持市价订单和挂单 每日最大利润目标(以美元为单位)以确保头寸并停止
TakePropips TradePad Pro
Eric John Pajarillaga Aldana
5 (4)
TakePropips TradePad Pro 包括一个强大的交易管理器、货币强度计、账户报告工具、风险管理工具等等! 它是您将遇到的最先进的外汇交易经理和交易助手之一!对于想要更有效地管理贸易交易的交易者来说,它是完美的解决方案。 您可以在我们的博文中下载用户手册: User Manual 您可以在 Strategy Tester 上测试此交易系统(启用可视模式)。如果您喜欢在实时图表上进行测试,也可以给我发消息以获取 7 天试用版。 视频教程也可在说明下方获得更多详细信息。 如果您有任何疑问或需要帮助,请随时与我联系,我很乐意提供帮助。 TradePad Pro 适用于所有外汇对、金属、商品、指数和加密货币。 主要特点 订单管理 - 公开市场或挂单,轻松调整止盈、止损和手数大小。 获利计算 - 手动点数、ATR 乘数和风险回报率。 止损计算- 手动点,   ATR 乘数和供应/需求。 批量计算 - 手动点,   每笔交易的风险百分比和风险金额。 账户保护 - 回撤保护允许您设置账户回撤的最大限额以避免进一步损失。利润保护为您的账户设置最大利润限额以避免过度交易。 编辑订
The News Filter
Leolouiski Gan
5 (20)
这个产品在新闻时间过滤所有的专家顾问和手动图表,因此您不必担心突然的价格波动会破坏您的手动交易设置或其他专家顾问输入的交易。此产品还带有完整的订单管理系统,可在任何新闻发布前处理您的持仓和挂单。一旦您购买了 The News Filter ,您将不再需要依赖以后的专家顾问内置的新闻过滤器,因为这个产品可以从此过滤它们所有。 新闻选择 新闻来源于Forex Factory的经济日历。 选择可以基于任何一种货币,如USD,EUR,GBP,JPY,AUD,CAD,CHF,NZD和CNY等。 选择也可以基于关键识别,例如Non-Farm (NFP),FOMC,CPI等。 能够选择新闻影响级别的筛选,从低、中、到高影响。 自动模式只选择与图表相关的新闻。 新闻来源每小时自动刷新,以确保最新的新闻数据。 为每个新闻影响级别提供单独的输入,以确定您要过滤掉的新闻发布前后的分钟数。 订单管理选项 在新闻发布前关闭未平仓头寸的选项,并在新闻发布后恢复它们。 在新闻发布前删除挂单的选项,并在新闻发布后恢复它们。 在新闻发布前移除止损和止盈水平的选项,并在新闻发布后恢复它们。 在新闻发布前移动止损
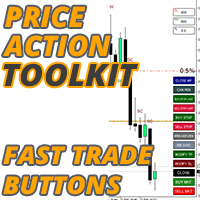
價格行為工具包 EA 主要為剝頭皮而設計,但可用於所有時間框架,以根據您的止損水平正確計算手數大小來快速進入市場,它允許您快速進入交易(即時或在蠟燭高點和低點掛起訂單),然後隨著市場的變化調整止損並獲利了結。 如需使用的所有功能、設置和最佳實踐策略的完整列表,請單擊此處: https://www.mql5.com/en/blogs/post/748072 基於風險的進入 快速下單按鈕可根據您賬戶的風險百分比讓您進入頭寸。它會根據您選擇的風險和止損距離自動計算您的手數。因此,您需要確保您的經紀商允許您使用 0.01 手大小,如果您被迫使用 0.10 或 1.00 手增量,它將不起作用。 快速交易執行按鈕 它在您的圖表上放置了快速交易執行按鈕,這些按鈕會立即自動打開、關閉或調整交易。除了正常的進場按鈕外,您還有一個快速關閉按鈕來退出所有頭寸,將您的止損移動到盈虧平衡(或您的平均盈虧平衡,如果您有多個交易未平倉),將買入和賣出止損設置在當前或最後一根蠟燭高點之上並且能夠僅平倉您最有利可圖的頭寸,這樣您就可以在多筆交易開始為您工作時從您擴大的頭寸中獲得部分利潤。 止損模式按鈕可讓
Exp SafetyLock PRO
Vladislav Andruschenko
4.7 (27)
SAFETYLOCK 允许交易者通过为已经开立的头寸设置相反的订单来避免强烈的市场逆转。 如果交易者或 EA 开仓,SAFETYLOCK 会为其开立反向挂单。如果头寸亏损,挂单将被激活以创建锁定。 EA 允许您关闭初始头寸、使用追踪止损或乘以手数。 您还可以根据持仓价格修改挂单开仓价格。 详细描述 +DEMO +PDF 如何购买 如何安装     如何获取日志文件     如何测试和优化     Expforex 的所有产品 参数基本(我们博客中对参数的完整描述) MilliSecondsTimerForMonitoring   - 算法执行的持续时间,以毫秒为单位(默认为 1000 = 1 秒)。 SymbolMonitoring   - SymbolMonitoring = ALL_SYMBOL = 监控账户上的所有交易品种和所有交易。如果您在任何货币对图表上启动智能交易系统,它将监控所有货币对。 Type_Monitoring   - EA 监控的交易类型,买入卖出或全部。 Magic_Monitoring   - EA 监控的神奇头寸数量,您可以指定多个以逗号分隔的值
Auto Trade Copier
Vu Trung Kien
4.71 (93)
自动交易复制器旨在以 100% 的准确度在多个 MT4/MT5 账户/终端之间复制交易。提供商和接收方账户必须位于同一台 PC/VPS 上。使用此工具,您可以将交易复制到同一台 PC/VPS 上的接收方账户。所有交易操作都将从提供商复制到接收方,不会有任何延迟。此版本仅适用于 MT4 账户。对于 MT5 账户,您必须使用 MT5 的自动交易复制器。参考: 参考: 对于 MT4 接收器,请下载“Trade Receiver Free” 这里 . 对于 MT5 接收器,请下载“Trade Receiver Free MT5”  这里 . 对于同一台 PC/VPS 上的 MT5 提供商,请检查“Auto Trade Copier MT5” 这里 . 如果您需要通过互联网在不同的 PC/VPS 上进行账户复制,请查看“Trade Copier Pro” 这里 . 如果您需要通过互联网在不同的 PC/VPS 账户之间进行复制,且接收方数量不限,请查看“无限交易复制器专业版” 这里 . 以下是重点功能 在 MT4 和 MT5 账户之间复制。 一个提供商可以将交易复制到多个接收者的账户。 一
CloseIfProfitorLoss with Trailing
Vladislav Andruschenko
4.87 (31)
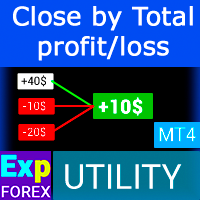
在 MetaTrader 4 中使用利润跟踪功能在达到总利润/亏损时平仓。 您可以启用 虚拟停止(单独订单)   , 分别计算和平仓 买入和卖出头寸 (Separate BUY SELL)   , 关闭和计算 所有交易品种或仅当前交易品种(所有交易品种)   , 启用追踪获利( 追踪 利润) 关闭存款货币、点数、余额百分比的总损益。 该应用程序旨在与任何其他 EA 一起用于任何账户或与手动交易结合使用。 MT5 版本 详细描述   +DEMO +PDF 如何购买 如何安装     如何获取日志文件     如何测试和优化     Expforex 的所有产品 一旦某些货币对或所有货币对的交易总余额大于或等于设置中指定的值,所有头寸将被关闭并删除订单。 此版本不仅能够在指定的利润水平平仓,而且还可以追踪利润以获得更好的结果。 我们实用程序的主要功能 按所有交易品种的总利润平仓; 按单独交易的总利润结算。 (虚拟模式); 按总利润结算并追踪利润; 按总利润以点数、百分比或货币结算; 所有交易或单独交易均以总亏损结束; 关闭交易后关闭图表和终端、风险管理器、包含关闭信息的邮件
MT4 to Discord Signal Provider 是一款用户友好、完全可定制的工具,专为直接向 Discord 发送交易信号而设计。这个工具将您的交易账户转变为一个高效的信号提供者。 自定义消息格式以适应您的风格!为了方便使用,您可以从预先设计的模板中选择,并决定包括或排除哪些消息元素。 [ 演示 ] [ 手册 ] [ MT5 版本 ] [ Telegram 版本 ] 设置 遵循我们详细的 用户指南 进行简单设置。 不需要预先了解 Discord API;我们提供所有必要工具。 主要特性 为订阅者更新自定义订单详情。 实施分层订阅模型,如铜牌、银牌、金牌,每一层都提供不同级别的信号访问。 附加执行订单的图表截图。 在这些截图上显示已关闭的订单,以增加清晰度。 提供延迟发送新订单消息的选项,以便在发送前进行最后调整。 透明和详细的订单信息: 带截图的新市场订单。 订单修改(止损、获利)。 已关闭和部分关闭的订单。 新的和修改的挂起订单。 挂起订单的激活和删除。 关于历史订单的详细报告。 每个订单的可定制评论。 注意: * 截图包括图表上的任何对象,如指标。 ** 在报
EA Hedger
Sergej Chukhista
4.67 (3)
您购买了交易顾问,订阅了信号,还是手动交易?!不要忘记风险管理。 EA Hedger 是一个专业的交易工具,具有许多设置,允许您使用对冲来管理风险。 对冲是一种交易技术,涉及开设与那些已经开立的头寸相反的头寸。在对冲的帮助下,仓位可以完全或部分被阻止(锁定)。 为什么购买这种产品有利可图: 可靠性 -顾问经过彻底检查和测试 有用性 -专家顾问在实际交易中使用,并在其工作中有效 表现 –带对冲交易的结果明显优于不带对冲交易的结果 可用性 -顾问的成本仅为每月$4.91或每天0 0.17-这是1-2点差 支持 -在讨论中,您将能够向卖家提问并获得建议 开发 -你可以写你的愿望的产品,如果可能的话,他们将被添加 更新 -即将到来的更新将提供给您 例如,您的账户上有三个未平仓头寸: EURUSD 买入 0.10 EURUSD 买入 0.20 英镑兑美元买入 0.20 如果您想将风险减半(50%),当您激活对冲时,将开设以下仓位: EURUSD 卖出 0.15 对冲 GBPUSD 卖出 0.10 对冲 当 EA Hedger 派上用场时 一、您想减少回撤,保护存
TPSpro Trade PRO
Roman Podpora
5 (4)
An instrument capable of instantly calculating position size or risk based on a specified stop-loss level is critically important for both professional traders and beginners. Trading utility TRADE PRO provides fast and accurate calculations, helping you make decisions in conditions of limited time and increased market volatility. Main functions: Original. Simple. Effective. Original and convenient opening of the main trading panel: Simply hover your mouse over the right part of the chart and cli
Summer 40% discount ($149 -> $88) Everything for chart Technical Analysis indicator mt4 in one tool Draw your supply demand zone with rectangle and support resistance with trendline and get alerts to mobile phone or email alert -  Risk reward indicator Video tutorials, manuals, DEMO download   here .  Find contacts on my   profile . 1.   Extended rectangles and trendlines Object will be extended to the right edge of the chart when price will draw new candles on chart. This is rectangle extend
News Panel MT4
Omar Alkassar
2 (1)
MetaTrader 新闻面板是一款在 MetaTrader 交易平台内显示经济日历数据的工具。该工具从外部来源(例如财经新闻网站或数据提供商)获取经济新闻和数据发布,并以易于阅读的格式显示它们。 该工具允许交易者按来源、时区、影响级别、货币和通知方式过滤新闻发布。它还包括一个刷新按钮,使用户能够手动更新数据并确保他们拥有最新的可用信息。 新闻面板安装和输入指南 如果您想获取有关 EA 的通知,请将我们的 URL 添加到 MT4/MT5 终端(参见屏幕截图)。 您必须将数据源的 URL 添加到选项 -> Expert Advisors ->“允许对列出的 URL 进行 WebRequest”,以便让新闻面板从源加载新闻数据     (参见屏幕截图)。 MT4版本     https://www.mql5.com/en/market/product/77300 MT5版本     https://www.mql5.com/en/market/product/77301 主要特点: 新闻载有完整的详细信息(解释、效果、频率等)。 随时手动刷新数据。 过滤要显示的新闻类型(影响、货币等)。
BBMA Oma Ally Signals Scanner (BBMA Oma Ally Analyzer Dashboard EA) This is a multi-pair and multi scanner dashboard to find the key signal of BBMA Oma Ally Strategy BBMA consists of the use of 2 indicators: Moving Averages Bollinger Bands BBMA consists of many types of entries: Reentry Extreme Rejection EMA50 GAP (EMA50 to Upper/Lower BB) MHV Full Setup (CSE>TPW>MHV>Direction>Reentry) There are many multi timeframe signals based on this strategy. RRE (Reentry - Reentry - Extreme) REE (Reentry
作者的更多信息
This is an interactive and easy-to-set indicator which allows to form seven equally spaced channels which have your settings simultaneously. All seven channels are enabled by default. But you can easily enable one or another channel using control buttons located in the upper case of the indicator's control panel. You can change a period of the indicator calculation by clicking one of buttons indicating number of the channel in the lower case of the control panel. Two other buttons (one of them i
This EA represents an interactive panel with adjustable parameters destined for installation and deletion of pending orders (orders grid generator). You can place the panel anywhere on the screen or hide it into a dot clicking on the button in the upper left part of the chart (it will be shown after clicking on it for the second time). Number and step of orders, lot size, vertical shift for limit orders - all these things make your work easier. There are functions for restoring according to pend
Equidistant channel
Valeriy Medvedev
The purpose of the indicator is drawing an equidistant channel. It is somewhat different from the traditional model. The choice of control parameters is simple and does not require any special description. Enter the calculation interval in hours and the solution to the problem will appear on the screen. Please note that the time involved in calculation of the channel must be greater than the timeframe it will be displayed on. If the parameters you enter are beyond the allowable limits, you will
This indicator is designed for drawing equidistant channels. Two options are available: based on the number of hours in the indicator calculation and by the number of bars. To draw a channel, enter a number 1 or greater. The maximum value is limited by the amount of visible bars. If the parameters you enter are beyond the allowable limits, you will get notified if the indicator restrictions. Please note that the time involved in calculation of the channel must be greater than the timeframe it wi
ZigZag on average
Valeriy Medvedev
This is a well-known ZigZag indicator. But it differs by the fact that its plot is based on values of the middle line which is set by a user. It can display Andrews’ Pitchfork and standard or Bobokus Fibo levels. NO REPAINTING. Parameters Period МА — middle line period. Default value is 34. Minimum value is 4. Maximum value is set at your discretion. Used to calculate price - base price to calculate the middle line. The averaging method - method of smoothing the middle line. Turning pitchfork
The indicator displays the moving average of all periods on one chart. It shows the MA of a one step lower timeframe and all the MAs equal to and higher than it. Parameters Period moving average - Moving Average period (default is 34); Used to calculate price - price used for the MA calculation (default is the average price = (high+low)/2); The averaging method - default is linear-weighted; Moving average shift - MA shift (default is 0). Just enter the MA calculation period and its parameters,
This indicator is designed for analyzing your positions on 30 financial instruments with the font size of the output information between 8 and 10. If the font size is 11 you will see only 26 instruments and so on: 12-25, 13-24, 14-20. The font size can range from 8 to 14. The main window contains buttons with names of financial instruments and lines where brief information about all open positions is displayed. Two columns show the total volumes in lots of positions in each trading direction: BU
This is a prototype of the famous Control and management of transactions panel. There are two main differences: Allows to work with all the variety of financial instruments opened by a user and not only with instruments it was attached to; To activate levels of order closure hidden from a broker, it uses not lines but modifiable virtual levels. To enjoy the full functionality of the panel you are advised to have: Desk analytical table . Their combined operation allows to keep the situation under
This is a prototype of the famous Control and management of transactions panel. There are two main differences: Allows to work with all the variety of financial instruments opened by a user and not only with instruments it was attached to; To activate levels of order closure hidden from a broker, it uses not lines but modifiable virtual levels. The EA will independently determine a total number of involved financial instruments, display them in the upper left window and locate the pointer on the
The indicator is based on the two-buffer scheme and does not require any additional settings. It can be used on any financial instrument without any restrictions. The indicator is a known ZigZag, but it does not redraw . The indicator allows to easily detect significant levels on the price chart, as well as demonstrates the ability to determine the probable direction of a price movement. The calculations are based on the candles' Close prices, thus improving the reliability of the levels. Para
The idea of the indicator stems from the necessity to clearly define the borders of support and resistance levels, which helps to plan the opening and closing of positions in the areas that most appropriately determine the process. Look at the breakdowns of the resistance level that confirm the intention of the price to continue the upward movement, after it passed the support level and entered the channel formed by the two levels. The same is for the case when the price enters the channel downw
This indicator is a logical extension of the product at https://www.mql5.com/en/market/product/12526 . The only difference is that price movement is displayed using a histogram with levels, allowing to assess the direction and strength of the movement. How to interpret the signal: 0 - the middle of the channel; above 0.5 - the breakdown of the channel up; below -0.5 - the breakdown of the channel down. Both indicators are displayed in the attached screenshots. Install the indicator and you will
Simple Line
Valeriy Medvedev
The indicator shows the levels of the past week and day. In addition, it draws a level in percentage. This level is specified relative to the difference between the High and Low of the past month and week. For the daily levels of the past day, the Close levels are additionally displayed. All you need to do is configure the display parameters of the levels to your liking. Parameters Over the past months installations - settings for the last months; PasteMonthsLines - the level display mode is
This indicator is the logical continuation of the well-known equidistant channel indicator: https://www.mql5.com/en/market/product/8723 . The main purpose of the indicator is the visualization of price levels relative to the parallel channel using Fibo Bobokus levels in a separate window and the price history. This often allows forecasting the future price movement with a sufficiently high degree of probability. The Fibo levels calculation equation is as follows: FiboLevel = (50-(100*((Close[i]-
This simple to use utility allows opening charts from the list of financial instruments by left clicking their names. The chart window is opened using the Default template. The template name can be changed to one of those stored in Charts-Templates section of the terminal. It is possible to customize the background colors of panels and their labels, and also to select the display type for a more comfortable working environment. This is all you need to know in order to see the result quickly. P
If you need to quickly evaluate the results of trading on a current financial instrument by hypothetical price movement in the chosen direction and up to a certain level, set the indicator on any chart that contains open positions and move the line to the desired level after it appears together with the results tab. This is all you need to understand what happens to your deposit if the price is at this level without taking into account existing stop loss and take profit. Enable considering pendi
This is an individual tool for analyzing the market situation. It is very simple to use. After attaching the indicator to the chart, you will see three vertical lines named "VLine 1", "VLine 2" and "VLine 3", following in this order from left to right. For the utility to operate correctly, this sequence should always be observed. Please note: at the first start, the lines are not bound to specific price levels on the chart. This should be done by user in accordance with the following rule: if li
This indicator displays a set of moving average lines across all higher timeframes. The indicator can be installed on any financial instrument and any timeframe. For the analysis of the lines, a panel with timeframe values is provided in the lower right corner. Using the panel, you can easily enable/disable the display of the MA line of any higher timeframe. This allows a more thorough analysis of the market situation. The color of the button matches the color of the moving average line. Param
This indicator is designed for monitoring RSI levels on the current and higher timeframes. The control panel is user friendly and consists of buttons, with which you can control the display of lines as per the names of the buttons. The button color matches the line color. Parameters "___| Settings of the main indicator " RSI Period - averaging period for index calculation (default is 14); RSI Price type - price used for calculations (default is the Close price); "___| Color palette " Text colo
Этот индикатор предназначен для контроля уровней CCI на текущем и старших от него таймфреймах. Панель управления проста в понимании и состоит из кнопок, с помощью которых можно управлять отображением линий, соответствующим указанным на наименовании кнопок. Цвет кнопки совпадает с цветом линии. Этот индикатор из серии подобных индикаторов, которые уже успели завоевать популярность: https://www.mql5.com/ru/market/product/30276 и https://www.mql5.com/ru/market/product/30403 Параметры "___| Set
This is a well-known ZigZag indicator. But it differs by the fact that its plot is based on values of the middle line which is set by a user. It can display Andrews’ Pitchfork and standard or Bobokus Fibo levels. NO REPAINTING. Parameters Period МА — middle line period. Default value is 34. Minimum value is 4. Maximum value is set at your discretion. Used to calculate price — type of price used for the midline calculations. The averaging method — type of smoothing for the middle line. Turning
The indicator is similar to https://www.mql5.com/en/market/product/12330 . However, it considers the MQL5 platform features. Peaks and bottoms are calculated based solely on external bars. After a swing is formed, the indicator does not redraw providing opportunities for traders working on horizontal level breakthroughs. Traffic can be reduced by changing the amount of calculated bars in the MinBars variable (default value is 500). All you need is to select the output options, so that you can se
The indicator is based on the two-buffer scheme and does not require any additional settings. It can be used on any financial instrument without any restrictions. The indicator is a known ZigZag, but it does not redraw . The indicator allows to easily detect significant levels on the price chart, as well as demonstrates the ability to determine the probable direction of a price movement. The calculations are based on the candles' Close prices, thus improving the reliability of the levels. Para
It is an analogue of the indicator of levels at https://www.mql5.com/en/market/product/24273 for the MetaTrader 5 platform. The indicator shows the levels of the past month, week and day. In addition, it draws a level in percentage relative to the difference between the High and Low of the past month and week. For the daily levels of the past day, the Close levels are additionally displayed. All you need to do is to configure the display parameters of the levels to your liking. In some cases, af
筛选:
Miguel Jimenez Cordero
6764
Miguel Jimenez Cordero 2021.02.25 08:12 
 

用户没有留下任何评级信息

Matthew Todorovski
12937
Matthew Todorovski 2018.06.16 11:12 
 

用户没有留下任何评级信息

回复评论
版本 1.3 2017.08.17
Fixed the color change warning text.
版本 1.2 2015.09.03
Changed the initial color and improved screen coloring.
版本 1.1 2015.08.13
Added the option for replacing all chart background primary colors allowing you to paint over all symbol chart windows. Set a background in the main background parameter, so that its initial parameters remain intact after deleting the indicator.