• 概述
  • 评论
  • 评论
  • 新特性

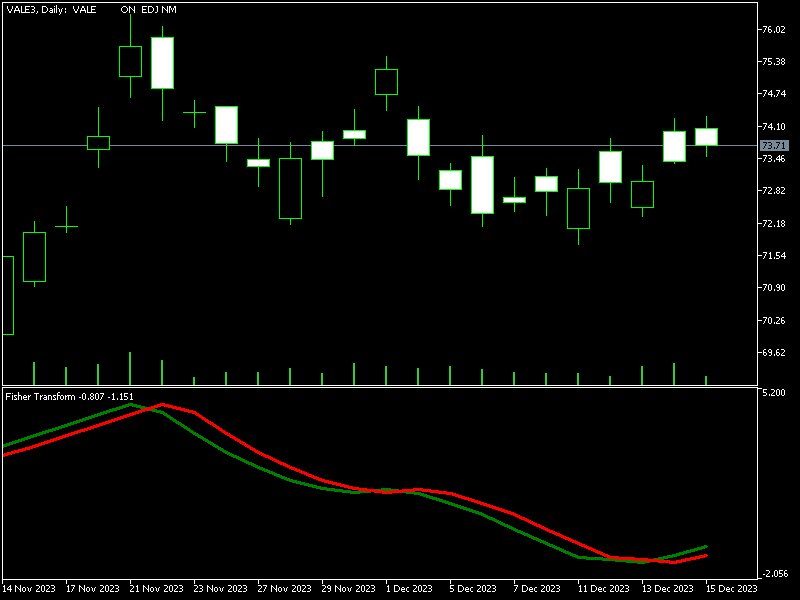
Fisher Transform Indicator

Key Features:

  1. Robust Algorithm: Based on John F. Ehlers’ renowned Fisher Transform formula, our indicator excels in pinpointing major price shifts, facilitating more informed trading decisions.

  2. Versatile Application: Works seamlessly with any asset, including forex, stocks, commodities, and indices, offering wide-ranging applicability for diverse trading strategies.

  3. Customizable Settings: Tailor the indicator to your trading style with adjustable parameters, including the transformation length, for optimal responsiveness and accuracy.

  4. Dual-Line Display: Features a primary Fisher Transform line (Red) and a Trigger line (Blue) for easy interpretation and signal confirmation.


推荐产品
High Low Open Close
Alexandre Borela
4.98 (43)
如果你象这个项目一样,就有5个饥饿审查。 这项指标采用了既定价格的公开、高、低价和关闭价格 可以对特定时间区加以调整。 许多机构和专业人士都认为这些是重要的。 贸易商可以为你了解他们可能更进一步的地点, 积极。 现有期间为: 前一日。 前一星期。 曾任Month。 曾任。 前一年。 或: 目前日。 目前周。 目前 Month。 目前配额。 今年。
FREE
Pare de seguir as "sardinhas" e comece a operar como big player, de forma automática. O robô Imbalance Autotrader é a mais recente tecnologia de trade que monitora os big players (grandes investidores) do mercado financeiro. Com estratégia de rompimento ( breakout ) ou pullback (Fair Value Gap FVG e Order Block) , você consegue configurar o robô para o ativo, conforme condições que você deseja operar. Além disso, o robô pode ter stops configuráveis, dinâmicos ou fixos. Na questão de gerenciamen
Growth Guard - Empower Your Portfolio Management Are you managing multiple EAs on MT5 and struggling to stay on top of their performance? Growth Guard is your ultimate monitoring solution, designed to keep a watchful eye on external Expert Advisors (EAs). Seamlessly tracking profit factors, consecutive losses, and other vital metrics, Growth Guard ensures your trading portfolio remains optimized and secure. How It Works The system comprises two components: Growth Guard Indicator – Attach this to
Ignition
Dansie Software Limited
Strategy Overview The Ignition EA tries to take advantage of sudden momentum when the Ignition pattern is detected. The final bar in the ignition pattern has a small opening wick, a very little or no closing wick, is large in comparison to recent bars and must start from the lower end of the current range (for a bullish ignition) Quick Testing Use Symbol EURUSD, Timeframe M2, and remove the GBPUSD symbol from the "Symbols" input (stratergy 1 and stratergy 2) Settings The below settings appe
Ultimate Retest
Nguyen Thanh Cong
5 (5)
Introduction The "Ultimate Retest" Indicator stands as the pinnacle of technical analysis made specially for support/resistance or supply/demand traders. By utilizing advanced mathematical computations, this indicator can swiftly and accurately identify the most powerful support and resistance levels where the big players are putting their huge orders and give traders a chance to enter the on the level retest with impeccable timing, thereby enhancing their decision-making and trading outcomes.
FREE
Spread highlighter
Jonathan Daniel Marion
This spread indicator displays the actual spread of each candle. It highlights the maximum spread and the minimum spread of the chosen symbol. This indicator is very helpful to see in real time the spread evolution helping to avoid taking a trade when the spread is too high. Inputs: Print value in Points: if true displays the spread as a whole number D isplay minimum and maximum spread of the past N days: select the number of days to consider the maximum and minimum spread Automatically adj
FREE
Haven Volume Profile
Maksim Tarutin
3.5 (2)
Haven Volume Profile 是一个多功能的成交量剖面分析指标,帮助基于交易量分布识别关键价格水平。它旨在为专业交易者提供更深入的市场理解,并帮助识别重要的进出场点。 其他产品 ->  这里 主要功能: Point of Control (POC) 计算 - 最大交易活动水平,帮助识别最具流动性的水平 Value Area 定义(增加活动区)和可自定义的成交量百分比,帮助更准确地评估交易区间 支持tick成交量和实际成交量,适用于不同市场类型和交易策略 灵活的计算周期设置(天数),使工具能够适应任何时间范围 自动适应浅色和深色终端主题,提升用户界面的可视体验 清晰的水平可视化,支持自定义样式和颜色,便于图表分析和快速决策 该指标非常适合识别重要的价格水平和整合区,帮助交易者做出更加明智的交易决策。使用 Haven Volume Profile 有助于通过更准确的成交量和市场动态分析来降低风险并增加利润。
FREE
BoxProfile MT5
Evgeny Shevtsov
4.56 (9)
The indicator displays volume profiles based on the nesting principle. Profiles periods are pre-set so that each subsequent profile has a length twice as long as the length of the previous profile. In addition to profiles, the indicator displays volume clusters sorted by color, depending on the volume they contain. Indicator operation features The indicator works on typical timeframes from M5 to MN, but for calculations uses historical data from smaller timeframes: M1 - for timeframes from M5
FREE
Tron MT5
Franck Martin
5 (1)
TRON is the result of several months of development. Featuring an advanced algorithm and a combination of custom indicators, this EA is a blend of profitability, security and simplicity. With its intelligent real-time technology and proven trading strategy for several years now, it offers reliable long-term trading and knows how to adapt to the situations it encounters over time. *** Compatible with Prop Firm ***   (see backtest) Please check your Prop Firm's terms and rules for consistency and
Gecko EA MT5
Profalgo Limited
5 (1)
NEW PROMO: Only a few copies copies available at 349$ Next price: 449$ Make sure to check out our " Ultimate EA combo package " in our   promo blog ! Gecko runs a simple, yet very effective, proven strategy.  It looks for important recent support and resistance levels and will trade the breakouts.  This is a "real" trading system, which means it will use a SL to protect the account.  It also means it will not use any dangerous techniques like martingale, grid or averaging down. The EA shows its
This robot sends Telegram notifications based on the coloring rules of PLATINUM Candle indicator. Example message for selling assets: [SPX][M15] PLATINUM TO SELL 11:45. Example message for buying assets : [EURUSD][M15] PLATINUM TO BUY 11:45 AM. Before enable Telegram notifications  you need to create a Telegram bot, get the bot API Key and also get your personal Telegram chatId. It's not possible to send messages to groups or channels. You can only send messages to your user chatId. You should
FREE
GoldTrader
Yashar Seyyedin
Please backtest with the exact balance of your live account before applying to real money. ==> If account balance is too low it may not trade at all! For MT4 version please contact via private message. martingale version is available here . Strategy description - Detect trend based on EMA18-EMA50-SMA200 alignment in three time frames: M15, H1, H4 - Trade in trend direction and exit when above alignment is broken. - The bot is tuned to trade XAUUSD(Gold). - The bot output is break even in rangin
FREE
Bar Follow EA
Aurelio Miguel Machado Da Silva
1 (1)
FREE
ISing
Yury Smagin
EA 的工作原理是價格與平均值的最大偏差。 這個想法是價格總是力求平衡, 與平均值的任何大偏差都會導致相互作用力 - 反作用力。 入口是在這些偏差上進行的。 这是这个顾问的一个信号示例 https://www.mql5.com/en/signals/2047087 (如果愿意,您可以进行更保守的交易)。 選項: sigal_deviation - 交易開始後的最大偏差; 過濾器: closeBarOnly - 僅在柱線關閉時工作,僅在柱線關閉後打開和關閉交易; waitFastMovement - 等待快速下降或下降。 N 是秒數,0 表示禁用。我們僅在從最小值或最大值的形成開始經過 N 秒後才進入。有助於防止在即時價格變動期間進入; oneOrderInDay - 每天只有一筆未平倉交易。有助於降低白天價格突然變化的風險; onlySwapPlus - 僅在正交換的方向上工作。建議選擇在任一方向具有正掉期的經紀商。 由於顧問的工作中也使用了對沖算法,因此某些交易可能會長時間保持開放狀態; sepatateBuyAndSell - 用於計算買賣的單獨算法; minimu
Simple QM Pattern   is a powerful and intuitive trading indicator designed to simplify the identification of the Quasimodo (QM) trading pattern. The QM pattern is widely recognized among traders for effectively signaling potential   reversals   by highlighting key market structures and price action formations. This indicator helps traders easily visualize the QM pattern directly on their charts, making it straightforward even for those who are new to pattern trading. Simple QM Pattern includes d
FREE
Introducing the Consecutive Green/Red Candle Alert Indicator for MT5 - Your Trend Spotting Companion! Are you ready to take your trading to the next level? We present the Consecutive Green/Red Candle Alert Indicator, a powerful tool designed to help you spot trends and potential reversals with ease. Whether you're a new trader looking for clarity in the market or an experienced pro seeking additional confirmation, this indicator is your trusted companion. Key Features of the Consecutive Green
FREE
NeuroExt
Dmytryi Voitukhov
4 (11)
https://t.me/mql5_neuroExt 當前版本和討論。 您可以使用任何工具。基礎將在訓練開始時自動創建。如果您需要從 0 開始訓練 - 只需刪除數據庫文件。 一般條款。 可以訓練 EA 交易在任何工具上工作。 不要試圖在沒有神經網絡訓練的情況下進行測試! 訓練後的平衡圖是水平的就足夠了。 生成訓練基地非常簡單。 美元兌瑞郎可進行準備培訓。 為了正確操作,必須只有一對一帳戶!顧問,只有一個!工具。否則,平衡控制將不起作用。 初始存款 - 200 美元起。 選項: - OrderComm:在訂單中會補充一個操作方式和分析深度的標誌。 - 工作類型:學習\工作\市場。 “學習”——在這種模式下,你需要達到一個至少有輕微增加的時間表。沒有洞。此模式也可用於工作,但市場上一次只會有 1 個訂單。 “工作” - 定期加載數據庫。在測試人員同時進行培訓並不斷提高培訓質量的情況下。 “市場” - 僅供市場接收。需要切換。 - 我的百分比:... - SL:如果你在訓練模式下設置=0,40到110的值會被自動分配,會導致交易過多、學習緩慢和圖像失真。當 MaxOrders>1 且 Wor
FREE
TPO Profile MT5
Kyra Nickaline Watson-gordon
Definition : TPO is a Time Price Opportunity. Instead of using bars or candles with an Open, High, Low, and Close price, each "bar" in a Market Profile is represented by horizontal bars against the price It is called Market Profile terminology. In other words time-price-opportunity (TPO) profiles are histograms of how much time was spent at each price within the span of the profile. By using a TPO chart, you are able to analyze the amount of trading activity, based on time, for each price level
Certainly! Let me introduce you to a powerful tool for MetaTrader 5 (MT5) that can automatically identify and draw support and resistance (S&R) levels on your trading charts. This tool is called the “Support and Resistance Levels Guru” . Support Resistance Levels Guru  The Support & Resistance Indicator automatically displays essential S&R levels on your chart. These levels are crucial for technical analysis and are used by many traders. Resistance levels (zones) are shown in R ed , while suppo
FREE
ROMAN5 时间突破指标自动绘制日线的支撑和阻力突破箱体。它可帮助用户识别何处进行买入、卖出。当新信号出现时,它可发出提示和声音。它还具有发送邮件功能。您的邮件地址和 SMTP 服务器设置应该在 MetaTrader 5 的 "邮箱" 标栏里的设置窗口里指定。 蓝色向上箭头 = 买。 红色向下箭头 = 卖。 您可以使用一款我的移动止损产品,来自动移动止损,并包括设置盈亏平衡。 ROMAN5 分型移动止损   ROMAN5 抛物线SAR 移动止损 ROMAN5 布林带移动止损 ROMAN5 HeikenAshi 移动止损 ROMAN5 均线移动止损 ROMAN5 高级移动止损 如果您希望尝试 EA, 参见 ROMAN5 时间突破 EA 。 版本 1.2: 发送推送通知至移动终端。
FREE
Stop Out Line MT5
Sergey Batudayev
4.5 (2)
工作逻辑 止损实用程序是一个简单但非常方便的指标,显示离止损水平还有多少点/ 它的好处在于许多交易者为了追求利润而故意高估交易风险,最大限度地使用可用保证金,对于这种情况,了解经纪人可以在哪里强行平仓是非常重要的。 只需将指标放在图表上,根据买入或卖出的未平仓头寸,您将在图表上看到此交易价格的边界标记。 在您开仓之前,这条线在图表上是不可见的。 如果您没有在图表上看到这条线,这并不意味着该实用程序不起作用,很可能您交易的风险很小,而且存款很大,那么您需要寻找更高的止损线/ 低于交易,因为在当前风险下,您离止损还很远。 如果您有任何问题,可以在讨论部分写下来。 愉快的交易。 Recommended Robot Scalper -   https://www.mql5.com/en/market/product/77108 变量 字体大小 - 标签中的字体大小 边缘缩进 - 从边缘缩进 线条颜色 - 线条颜色 文字颜色 - 文字颜色
FREE
Value Chart Candlesticks
Flavio Javier Jarabeck
4.73 (11)
The idea of a Value Chart indicator was presented in the very good book I read back in 2020 , " Dynamic Trading Indicators: Winning with Value Charts and Price Action Profile ", from the authors Mark Helweg and David Stendahl. The idea is simple and the result is pure genius: Present candlestick Price analysis in a detrended way! HOW TO READ THIS INDICATOR Look for Overbought and Oversold levels. Of course, you will need to test the settings a lot to find the "correct" one for your approach. It
FREE
All Harmonics 26 demo
Alexey Isavnin
4.25 (4)
This is the demo version of "All Harmonics 26" indicator . "All Harmonics 26" searches for 26 types of harmonic patterns and outputs them in a convenient way. You can check out the documentation here . This demo version has the following limitations: The indicator searches only for one type of harmonic patterns out of 26:- Gartley. The indicator outputs new patterns with a lag of 10 bars.
FREE
Auto Support and Resistances
Flavio Javier Jarabeck
4.56 (70)
Are you tired of drawing Support & Resistance levels for your Quotes? Are you learning how to spot Support & Resistances? No matter what is your case, Auto Support & Resistances will draw those levels for you! AND, it can draw them from other timeframes, right into you current chart, no matter what timeframe you are using... You can also Agglutinate regions/zones that are too much closer to each other and turning them into one single Support & Resistance Level. All configurable. SETTINGS Timefr
FREE
Standardize
Manuel Gonzales
5 (1)
The "Standardize" indicator   is a technical analysis tool designed to   standardize and smooth price or volume data to highlight significant patterns and reduce market noise, making it easier to interpret and analyze. Description & Functionality: Standardization : The indicator standardizes price or volume values by subtracting the mean and dividing by the standard deviation. This converts the data into a distribution with zero mean and standard deviation of one, allowing different data sets t
FREE
Setup Stormer
Alex Rodin De Sousa E Silva
4 (6)
Graph configuration and buy and sell signals based on Stormer's  (Alexandre Wolwacz, Brazilian trader) swing, position and day trade strategy, described on his youtube channel (https://www.youtube.com/watch?v= 0QZ_NjWkwl0) The buy and sell indications are based on 2 candle patterns ( Inside Bar [Yellow] and Reversal Closing Price [Blue and Red] ), 3 Moving Averages and 1 Stochastic . Indicators: Inside Bar - Candle pattern indicating trend continuity, or reversal Reversal Closing Price - Cand
FREE
Dynamic Linear Regression EA
Abraao Moreira
4.71 (7)
The Expert Advisor (EA) is based on the Dynamic Linear Regression indicator ( https://www.mql5.com/en/market/product/49702 ). User inputs: Number of candles is considered when calculating linear regression; Distance to the top line; Distance to the bottom line; Stop the loss of. The EA executes purchase and sale orders in the market when the value of a line, higher or lower, is reached at the current price, when the lower line is reached, a buy order at market is executed and when the upper li
FREE
General Description In the simplest terms this is a contrarian intra-day scalping system. Built to try and let correct trades run as far as possible and flip the trade when indicated. The indicator looks at historical daily trading ranges to lay out levels at which it takes long and short positions based on the statistical levels. The indicator is built around index futures, mainly around S&P and the DOW but can be used an any futures contract mainly using AMP Futures to trade. The indicator is
True Day
Aurthur Musendame
5 (1)
True Days is a tool designed specifically for the trader who wants to catch intraday volatility in price charts.  True day makes it easier for the trader to avoid trading in the dead zone - a period in time where markets are considered dead or non volatile. The trader can concentrate on finding opportunities only during periods of profound market movements. By default the indicator gives you a true day starting at 02:00 to 19:00 hours GMT+2. You can adjust according to your Time Zone. By deafult
FREE
A machine translation from the English product description was used. We apologize for possible imprecisions. 使用了英文 产 品描述的机器翻 译。 我 们对可能的不准确表示歉意 。 最喜 欢的烛台价格行为模式的可视化系统 。 附加后,指 标将自动在图表上标记下一个模式 : 匹 诺曹酒吧  - 带有长 “ 鼻子 ” 的小型条形杆,非常著名的反向模式; 内柱  -  一个柱,其范 围位于前一个柱的范围内。   它代表市 场的不确定性 ; 外柱  -  其范 围超出前一个柱的范围的柱。   它代表市 场的不确定性 ; 导轨图案  - 两个随之而来的 对立柱,具有几乎相等的、较大的实体。 反向模式, 实际上与更高时间框架的匹诺曹柱线模式相吻合 ; 主蜡 烛形态  -  蜡 烛的第五根,其中四个后续蜡烛的范围 在第五根蜡 烛的范围内   -   主蜡 烛。   这种模式代表市场整合,尤其是在较短的时间范围内 。 差距  -  后 续柱的收盘价和开盘价之间的差距,不应忽视 。 该指标的开发考
该产品的买家也购买
Trend Screener Pro MT5
STE S.S.COMPANY
4.85 (79)
使用趋势筛选指标释放趋势交易的力量:由模糊逻辑和多货币系统提供支持的终极趋势交易解决方案! 使用趋势筛选器(由模糊逻辑提供支持的革命性趋势指标)提升您的趋势交易。 它是一个强大的趋势跟踪指标,结合了超过 13 种高级工具和功能以及 3 种交易策略,使其成为使您的 Metatrader 成为趋势分析器的多功能选择。 限时优惠:趋势筛选指标终身仅需 50 美元。 ( 原价 250$ ) (优惠延长) 体验趋势筛选器 100% 无需重新绘制的准确性,确保您的交易决策不受过去价格变化的影响。 释放多时间框架和多货币功能的多功能性,使您能够以无与伦比的信心在外汇、商品、加密货币和指数领域进行交易。 利用 Trend Screener 的综合策略套件增强您的交易: - 趋势跟踪策略和趋势延续策略 :趋势筛选器的趋势跟踪策略提供清晰的趋势延续信号,让您有效捕捉趋势走势并管理风险。 - 反转策略和早期入场点策略 :趋势筛选器的反转策略可检测市场方向的潜在变化,使您能够预测趋势反转并利用疲弱的市场趋势。通过早期入场点,您可以在潜在的趋势变化之前定位自己 获取可观的利润。 - 倒卖策略: 趋势筛选器的倒卖
Moneytron — профессиональный сигнальный индикатор тренда Индикатор Moneytron предназначен для тех, кто хочет зарабатывать стабильно и системно, торгуя по тренду. Он автоматически определяет: • Точки входа (Buy/Sell сигналы) • 3 уровня тейк-профита (TP1, TP2, TP3) • 3 уровня стоп-лосса (SL1, SL2, SL3) • Показывает реальную статистику успешности сделок прямо на графике Особенности: • Работает на всех валютных парах и металлах • Идеален для таймфреймов M30, H1 и выше • Подходит как для начинающи
Algo Pumping
Ihor Otkydach
5 (7)
PUMPING STATION – 您的专属“全包式”交易策略 我们为您推出PUMPING STATION —— 一款革命性的外汇指标,它将使您的交易变得更加有趣且高效。这不仅仅是一个辅助工具,而是一套完整的交易系统,具备强大的算法,帮助您开始更加稳定的交易。 购买本产品,您将免费获得: 专属设置文件:用于自动配置,实现最大化性能。 逐步视频教程:学习如何使用PUMPING STATION策略进行交易。 Pumping Utility:专为PUMPING STATION打造的半自动交易机器人,让交易变得更加方便和简单。 购买后请立即联系我,我将为您提供所有额外资源的访问权限。 PUMPING STATION如何工作: 趋势监控:能够即时识别市场趋势方向。趋势是您最好的朋友。 进场信号:图表上的箭头会提示您何时进场以及交易方向。 明确的交易目标:指标会自动识别最佳的平仓时机。 回调交易:内置的基于布林带的价格通道可检测修正结束并发出新趋势开始的信号。 效率分析:如果当前设置效果较差,系统会自动提示。只需调整PUMPING STATION,即可获得最佳性能。 功能强大: 推送和邮件通知:即
Golden Trend Indicator MT5
Noha Mohamed Fathy Younes Badr
4.89 (18)
Golden Trend indicator  is The best indicator for predicting trend movement this indicator never lags and never repaints and never back paints    and give  arrow buy and sell    before the candle appear  and it will help you and  will make your trading decisions clearer its work on all currencies and  gold and crypto and all time frame This unique  indicator uses very secret algorithms to catch the  trends, so you can trade using this indicator and see the trend clear on charts  manual guide and
支撑和阻力筛选器是 MetaTrader 的一个级别指标,它在一个指标内提供多种工具。 可用的工具有: 1. 市场结构筛选器。 2. 看涨回调区。 3. 看跌回调区。 4.每日枢轴点 5.每周枢轴点 6. 每月枢轴点 7. 基于谐波形态和成交量的强大支撑和阻力。 8. 银行级区域。 限时优惠:HV 支撑和阻力指示器仅售 50 美元且终生可用。 (原价 125$) 通过访问我们的 MQL5 博客,您可以找到我们所有带有分析示例的高级指标: 单击此处 主要特点 基于谐波和音量算法的强大支撑和阻力区域。 基于谐波和成交量算法的看涨和看跌回调区域。 市场结构筛选器 每日、每周和每月的枢轴点。 文档 所有支持和阻力筛选器文档(说明)和策略详细信息均可在我们 MQL5 博客的这篇文章中找到: 单击此处。 接触 如果您有任何问题或需要帮助,请通过私信联系我。 作者 SAYADI ACHREF,金融科技软件工程师,Finansya 创始人。
FX Power MT5 NG
Daniel Stein
5 (13)
FX Power:分析货币强度,助您做出更明智的交易决策 概述 FX Power 是一款专业工具,帮助您全面了解主要货币和黄金在任何市场条件下的真实强度。通过识别强势货币用于买入,弱势货币用于卖出, FX Power 简化了交易决策,并帮助您发现高概率的交易机会。不论您是想跟随趋势还是通过极端的 Delta 值预测反转,这款工具都能完美适应您的交易风格。别再盲目交易——用 FX Power 让您的交易更加智慧。 1. 为什么 FX Power 对交易者极具价值 实时货币和黄金强度分析 • FX Power 实时计算并显示主要货币和黄金的相对强度,助您全面了解市场动态。 • 监控领先或落后资产,轻松识别值得交易的货币对。 全面的多时间框架视图 • 跟踪短期、中期和长期时间框架的货币和黄金强度,以便将您的交易策略与市场趋势保持一致。 • 无论是快进快出的短线交易还是更长期的投资策略, FX Power 都能为您提供所需的信息。 Delta 动态分析用于趋势和反转 • 极端 Delta 值常常预示反转机会,而平缓的 Delta 变化则确认趋势延续。 • 使用 Delta 分析,轻
FX Volume MT5
Daniel Stein
4.82 (17)
FX Volume:从经纪商视角洞察真实市场情绪 简要概述 想要提升您的交易策略? FX Volume 可提供零售交易者和经纪商的持仓实时数据——远早于诸如 COT 之类的延迟报告。不论您希望获得持续稳定的收益,还是想在市场中多一分制胜的砝码, FX Volume 都能帮您识别重大失衡、确认突破以及完善风险管理。立即开启体验,让真实的成交量数据为您的交易决策带来革新! 1. 为什么 FX Volume 对交易者格外有用 极具准确度的早期预警 • 快速捕捉有多少交易者正在买入或卖出某个货币对——比大多数人提前一步。 • FX Volume 是 唯一 能够整合多家零售经纪商真实成交量数据并以简洁方式呈现的工具。 强力风险管理 • 及时识别多头或空头仓位的巨大不平衡,这往往预示着潜在的趋势反转,帮助您更自信地设置止损和目标位。 • 独家而真实的数据让每一次交易决策更具可靠性。 优化进场与出场点 • 发现“过度集中”的交易(大多数交易者都在同一方向),并通过真实成交量来确认突破。 • 避免依赖常见指标可能带来的误导信号,而是利用真实的实时成交量。 适配各种交易策略 • 将 FX
FX Levels MT5
Daniel Stein
5 (4)
FX Levels:适用于所有市场的高精度支撑与阻力 快速概览 想要精准确定适用于任何市场(外汇、指数、股票或大宗商品)的支撑与阻力吗? FX Levels 将传统的“Lighthouse”方法与前沿的动态分析相结合,实现近乎通用的准确性。依托真实经纪商经验和自动化的每日与实时更新, FX Levels 帮助您捕捉价格反转点、设置合理的盈利目标,并自信地管理交易。立即使用,体验更准确的支撑/阻力分析如何助力您的交易更上层楼! 1. 为什么 FX Levels 对交易者非常有利 极度精准的支撑 & 阻力区 • FX Levels 专为不同经纪商提供的行情源和时间设置而设计,可生成几乎相同的价位区,解决数据不一致的常见问题。 • 这意味着无论您在哪里交易,都能获得稳定一致的水平线,为策略打下更加牢固的基础。 结合传统与先进技术 • 通过将久经考验的“Lighthouse”方法与动态分析相融合, FX Levels 不仅限于每日刷新,还可针对新的价格波动进行即时更新。 • 您可以选择经典的静态方式,或实时捕捉新出现的水平,以贴近最新的市场行为。 识别清晰的反转点 • FX Lev
Grabber System MT5
Ihor Otkydach
5 (5)
向您介绍一款优秀的技术指标——Grabber,它是一套即开即用的“全包式”交易策略。 在一个代码中集成了强大的市场技术分析工具、交易信号(箭头)、提醒功能和推送通知。 每位购买该指标的用户还可免费获得以下内容: Grabber辅助工具:用于自动管理已开仓位 视频操作指南:逐步教学如何安装、设置和使用该指标进行交易 原创Set文件:可快速自动配置,帮助实现最佳交易效果 忘掉其他策略吧!只有Grabber能够真正激励你在交易中攀登新高峰! Grabber策略的主要特点: 交易周期:从M5到H4 适用资产:任意,但我推荐我亲自测试过的品种(GBPUSD、GBPCAD、GBPCHF、AUDCAD、AUDUSD、AUDSGD、AUDCHF、NZDUSD、NZDCAD、EURCAD、EURUSD、EURAUD、EURGBP、EURCHF、USDCAD、USDSGD) 交易时间:全天候 24/7 交易效果:我分享自己的真实交易结果,并在此教学如何操作: https://www.mql5.com/ru/market/product/134563?source=Site+Market+MT5+Indic
TPSproTREND PrO MT5
Roman Podpora
4.72 (18)
VERSION MT4        —        ИНСТРУКЦИЯ RUS           —        INSTRUCTIONS  ENG 主要功能: 准确的输入信号,无需渲染! 如果出现信号,它仍然相关!这是与重提指标的一个重要区别,重提指标可以提供信号然后改变信号,这可能导致存款资金的损失。现在您可以以更高的概率和准确度进入市场。还有一个功能是在箭头出现后为蜡烛着色,直到达到目标(止盈)或出现反转信号。 显示止损/获利区域 为了提高搜索切入点时的视觉清晰度,创建了一个模块,该模块最初显示买入/卖出区域,在该区域中搜索进入市场的最佳点。用于处理止损水平的附加智能逻辑有助于随着时间的推移减小其大小,从而降低进入交易(移动 sl)时的初始风险。 显示较高时间范围内的最小值/最大值(MTF 模式) 添加了一项功能,可以显示较高时间间隔的最小/最大校正位置,并显示趋势变化。此外,MIN/MAX 现在有编号,显示修正内容。 风险回报率 (RR) 使用指标算法,可以检测精确的入场点,平均风险回报比超过1k2。这也伴随着视觉效果,例如,收到信号后会出现蜡烛的彩色草图。 无论
IX Power MT5
Daniel Stein
4.86 (7)
IX Power:解锁指数、大宗商品、加密货币和外汇市场洞察 概述 IX Power 是一款多功能工具,可分析指数、大宗商品、加密货币和外汇市场的强弱表现。 FX Power 提供针对货币对的最高精度,利用所有可用货币对数据进行分析,而 IX Power 专注于基础资产的市场数据。这使得 IX Power 成为非外汇市场的理想选择,同时在需要简单外汇分析时也非常可靠。它可以无缝适用于任何图表,提供清晰的、有行动价值的洞察,帮助提升您的交易决策。 1. 为什么 IX Power 对交易者非常有价值 多市场强弱分析 • IX Power 分析指数、大宗商品、加密货币和外汇市场的强弱表现,为每个市场提供量身定制的洞察。 • 监控 US30、WTI、黄金、比特币等资产的表现,发现交易机会。 适用于更广泛的市场 • 对于外汇交易, FX Power 提供无与伦比的精度,通过分析所有相关货币对。 • IX Power 专注于基础资产的市场数据,非常适合非外汇市场及简化的外汇分析。 实时适应性 • 借助自适应算法, IX Power 实时响应市场数据变化,保持分析的最新性。 • 实时更新
Gold Stuff mt5
Vasiliy Strukov
4.93 (178)
Gold Stuff mt5 是专为黄金设计的趋势指标,也可用于任何金融工具。 该指标不会重绘,也不会滞后。 推荐时间框架 H1。 购买后立即联系我以获得设置和个人奖励!   你可以在我的个人资料中找到它。   重要! 购买后立即与我联系,以获得说明和奖金!   您可以免费收到我们的强力支持和趋势扫描指标的副本,请私信。大部头书!   设置 绘制箭头 - 打开关闭。 在图表上绘制箭头。 警报 - 打开关闭声音警报。 电子邮件通知 - 打开关闭。 电子邮件通知。 Puch-notification - 打开关闭。 推送通知。 接下来,调整色域。 Gold Stuff mt5 是专为黄金设计的趋势指标,也可用于任何金融工具。 该指标不会重绘,也不会滞后。 推荐时间框架 H1。 购买后立即联系我以获得设置和个人奖励!   设置 绘制箭头 - 打开关闭。 在图表上绘制箭头。 警报 - 打开关闭声音警报。 电子邮件通知 - 打开关闭。 电子邮件通知。 Puch-notification - 打开关闭。 推送通知。 接下来,调整色域。
FourAverageMT5
Mikhail Sergeev
5 (2)
FourAverage是趋势检测中的一个新词。 随着信息技术的发展和大量的参与者,金融市场越来越不适合用过时的指标进行分析。 传统的技术分析工具,如移动平均线或随机指标,其纯粹形式无法确定趋势的方向或其逆转。 一个指标可以根据14年的历史指示未来价格的正确方向,而不改变其参数吗? 与此同时,不要失去充足的横向市场走势? 答:可以。 我们的团队开发了一个指标,具有相当强大和有效的机制来适应不断变化的市场条件。 2025年,领先的趋势指标"FourAverage"正进入新的发展阶段。 现代加密货币和股票市场似乎是为此指标创建的。 独特的平滑公式允许您调整(识别模式)指标的任何特征的货币对或其他工具。 现在,为了盈利,一个指标就足够了,而这仅仅是个开始。 与其他工具结合使用或作为信号滤波器,FourAverage的好处是巨大的。 该指标有一个内置函数,绘制箭头并在指标上显示前一笔交易的结果。 这使得检查历史非常方便。 这是非常容易使用这个趋势指标。 1)确定具有良好增长潜力的资产。 2)使用一组内置指标设置或选择您自己的选项。 3)您正在等待指标的信号来开启交易。 4)打开一个位置,并获得利
可以说,这是您可以为MetaTrader平台找到的最完整的谐波价格形成自动识别指标。它检测19种不同的模式,像您一样认真对待斐波那契投影,显示潜在的反转区域(PRZ),并找到合适的止损和获利水平。 [ 安装指南 | 更新指南 | 故障排除 | 常见问题 | 所有产品 ] 它检测19种不同的谐波价格形态 它绘制了主要,衍生和互补的斐波那契投影(PRZ) 它评估过去的价格走势并显示每个过去的形态 该指标分析其自身的质量和性能 它显示合适的止损和获利水平 它使用突破来表明合适的交易 它在图表上绘制所有样式比率 它实现了电子邮件/声音/视觉警报 受斯科特·M·卡尼(Scott M. Carney)的书的启发,该指标旨在满足最纯粹和最熟练的交易者的需求。但是,它采取了一种使交易更容易的方式:在向交易发出信号之前,它会等待Donchian朝正确方向突破,从而使交易信号非常可靠。 斐波那契投影与向量无关 它实现了电子邮件/声音/推送警报 它绘制了ABCD投影 重要提示: 为了符合 Scott M. Carney先生 的商标申诉,某些图案名称已重命名为不言自明的替代方式, Scott M.
Matrix Arrow Indicator MT5
Juvenille Emperor Limited
5 (13)
矩阵箭头指标 MT5   是一种独特的 10 合 1 趋势,遵循   100% 非重绘多时间框架指标 ,可用于所有符号/工具: 外汇 、 商品 、 加密货币 、 指数 、 股票 。 Matrix Arrow Indicator MT5 将在其早期阶段确定当前趋势,从多达 10 个标准指标中收集信息和数据,它们是: 平均定向运动指数 (ADX) 商品渠道指数 (CCI) 经典 Heiken Ashi 蜡烛 移动平均线 移动平均收敛散度 (MACD) 相对活力指数 (RVI) 相对强弱指数 (RSI) 抛物线SAR 随机振荡器 威廉姆斯的百分比范围 当所有指标给出有效的买入或卖出信号时,相应的箭头将打印在图表上,在下一根蜡烛/柱线开盘时,指示强劲的上升趋势/下降趋势。用户可以选择使用哪些指标,并可以单独调整每个指标的参数。 Matrix Arrow Indicator MT5 仅从选定的指标中收集信息,并仅根据其数据打印箭头。   Matrix Arrow Indicator MT5   还可以为所有新信号发送终端、推送通知或电子邮件警报。无论您是黄牛、日内交易者还是波段交易者, Mat
Basic Harmonic Patterns Dashboard MT5
Mehran Sepah Mansoor
4.13 (8)
该仪表盘显示所选符号的最新可用谐波形态,因此您可以节省时间并提高效率 /  MT4 版本 。 免费指标:  Basic Harmonic Pattern 指标列 Symbol:   显示所选符号 Trend:     看涨或看跌 Pattern:    形态类型(Gartley、蝴蝶、蝙蝠、螃蟹、鲨鱼、Cypher 或 ABCD) Entry:     入口价格 SL: 止损价 TP1: 第一止盈价 TP2: 第二次获利价格 TP3: 第三次获利价格 Current price:    当前价格 Age (in bars):   最后绘制的模式的年龄 主要输入 Symbols :   从 "28 种主要货币对 "或 "选定符号 "中选择。 Selected Symbols :   希望监控的符号,用逗号分隔("EURUSD,GBPUSD,XAUUSD")。如果您的经纪商为货币对设置了后缀或前缀,您必须在以下两个参数中添加(货币对前缀或货币对后缀)。 Max Iteration:   调整模式的最大迭代次数(如果该值越小,则模式越少,性能越快;如果该值越大,则模式越多,性能越慢)
FX Dynamic:借助可定制的 ATR 分析,追踪波动率与趋势 概述 FX Dynamic 是一款强大的工具,通过计算平均真实波幅(ATR)来为交易者提供日内和日间波动性方面的深度见解。通过设置 80%、100%、130% 等关键波动率阈值,您可以快速识别潜在的盈利机会,或者在市场超出常规范围时及时得到预警。 FX Dynamic 可根据您经纪商的时区进行调整,帮助您保持一致的波动率衡量标准,并能与 MetaTrader 平台完美结合,实现实时分析。 1. 为什么 FX Dynamic 对交易者极具价值 实时 ATR 洞察 • 仅需一眼便可了解日间与日内波动水平。当价格触及或突破 80%、100%、130% 的 ATR 阈值时,会发出提示,让您知道市场是否达到临界水平。 • 在波动完全爆发前预判可能的衰竭或突破走势。 多市场通用 • 适用于外汇、商品、指数等多种资产。 FX Dynamic 可以自动识别经纪商时区,也可手动进行调整。 • 您可选择只专注于某一特定品种,或在多市场保持一致的 ATR 标准。 更智能的风险管理 • 利用 ATR 门槛来优化止损或止盈位置。当市场
精密指数振荡器(Pi-Osc)由Precision Trading Systems的Roger Medcalf开发 版本2经过精心重新编码,以在您的图表上加载速度非常快,还加入了一些其他技术改进,以提高体验。 Pi-Osc旨在提供准确的交易定时信号,旨在找到极端的耗尽点,这些点是市场被迫去触及,以清理每个人的止损单。 该产品解决了一个古老的问题,即知道极端点在哪里,这使得交易员的生活变得更加简单。 这是一个高度复杂的共识指标,与行业标准的振荡器相比,具有一些强大的区别。 它使用的一些特征包括需求指数、资金流动、RSI、随机指标、模式识别、成交量分析、标准偏差极端点以及不同长度上述各种变化的分歧。 乍一看,对于未经培训的人来说,它似乎与任何其他振荡器没有什么不同,但当与其他振荡器(如RSI或动量等)相对比时,这个指标的真正威力开始显现。 据我所知,没有其他振荡器可以频繁地精确指出顶部和底部,具有相同的定期效率。 精密指数振荡器由许多不同的数学方程组成,用于测量多个时间框架采样中的价格和成交量变动,从而高度准确地预测趋势可能发生转折的位置。 PTS Pi-Osc V2非
PZ Mean Reversion MT5
PZ TRADING SLU
3 (2)
采用专业和量化方法进行均值回归交易的独特指标。它利用了价格以可预测和可衡量的方式转移并返回均值这一事实,这允许明确的进入和退出规则大大优于非量化交易策略。 [ Installation Guide | Update Guide | Troubleshooting | FAQ | All Products ] 清晰的交易信号 非常容易交易 可定制的颜色和尺寸 实现性能统计 优于大多数交易策略 显示合适的止损和止盈水平 它实现了电子邮件/声音/视觉警报 这个怎么运作 该指标从更高的时间范围测量完全可定制的移动平均线的标准偏差,并使用趋势跟踪方法精确地找到交易。交易是通过深入当前图表的价格行为发现的,并在价格返回到平均价格区间时关闭,根据您选择的更高时间范围计算。由于其编码方式,该指标将远离高波动性和强劲趋势市场,并且仅在可预测的情况下进行交易,在可接受的波动性与方向性比率范围内,回归均值是可行的。 指标剖析 绿线是更高时间范围内的移动平均线(也就是平均值) 虚线区域是移动平均线周围的典型价格区间 蓝线是看涨交易的突破价格 红线是看跌交易的突破价格 交易是针对均值进行的,并在典型的价格
KT Candlestick Patterns MT5
KEENBASE SOFTWARE SOLUTIONS
KT Candlestick Patterns 实时识别并标注出 24 种最可靠的日本蜡烛图形态。自18世纪以来,日本交易员便一直使用蜡烛图预测价格走势。 确实,并非所有蜡烛图形态都能可靠地预测价格方向,但如果与支撑阻力等其他技术分析方法结合使用,它们可以更清晰地反映当前市场状况。 该指标涵盖了许多出现在 Steve Nison 所著《日本蜡烛图技术》中的形态。 除书中图形外,还能识别很多较为复杂但不太为人所知的蜡烛图形态。 功能特点 可设置固定点数为目标,输入成功点数后即可看到每个信号的成功率。 准确识别 24 种日本经典蜡烛图形态。 配备实时统计模块,显示每种形态的表现情况。 可设置图形之间最小间隔柱数,优化图表整洁度与信号质量。 结合市场趋势方向,提高识别的准确性。 包含反转、趋势延续与中性形态(如十字星)。 支持所有 MetaTrader 警报类型。 包含图形 ----- 反转形态 ----- 母子形态 锤头/流星 吞没 三只白兵/三只乌鸦 外包三阳/三阴 内包三阳/三阴 晨星/暮星 挤压形态 带腰带形态 乌云盖顶/刺透形态 推进阻挡/下降阻挡 反击线 阶梯底/顶 跳空
首先,值得强调的是,这个交易工具是非重绘、非重画和非滞后的指标,非常适合专业交易。 在线课程,用户手册和演示。 智能价格行动概念指标是一个非常强大的工具,既适用于新手,也适用于经验丰富的交易者。它将超过20个有用的指标合并到一个指标中,结合了高级交易思想,如内圈交易员分析和智能资金概念交易策略。该指标侧重于智能资金概念,提供有关大型机构交易方式的见解,帮助预测它们的动向。 它在流动性分析方面尤其擅长,有助于理解机构的交易方式。它擅长预测市场趋势,并仔细分析价格波动。通过将您的交易与机构策略对齐,您可以更准确地预测市场走向。该指标多才多艺,擅长分析市场结构,识别重要的订单区块,并识别各种模式。 它擅长识别BOS和CHoCH等模式,理解动量的转变,并突出显示供需强劲的关键区域。它还擅长发现强大的不平衡,并分析价格创造更高高点或更低低点的模式。如果您使用斐波那契回撤工具,该指标可以满足您的需求。它还可以识别相等的高点和低点,分析不同的时间框架,并通过仪表板显示数据。 对于使用更高级策略的交易者,该指标提供了工具,如公平价值差指标和优惠和折扣区域的识别。它特别关注高时间框架订单区块,并
Easy Buy Sell Signal Alert
Franck Martin
4.5 (8)
Easy Buy Sell is a market indicator for opening and closing positions. It becomes easy to track market entries with alerts. It indicates trend reversal points when a price reaches extreme values ​​and the most favorable time to enter the market. it is as effective as a Fibonacci to find a level but it uses different tools such as an algorithm based on ATR indicators and Stochastic Oscillator. You can modify these two parameters as you wish to adapt the settings to the desired period. It cannot
Trend Line Map Pro MT5
STE S.S.COMPANY
4.09 (11)
趋势线图指标是趋势筛选器指标的插件。它用作趋势筛选器(趋势线信号)生成的所有信号的扫描仪。 它是基于趋势筛选器指标的趋势线扫描仪。如果您没有 Trend Screener Pro Indicator,Trend Line Map Pro 将无法使用。 It's a Trend Line Scanner based on Trend Screener Indicator. If you don't have Trend Screener Pro Indicator,     the Trend Line Map Pro will not work . 通过访问我们的 MQL5 博客,您可以下载趋势线图指标的免费版本。购买前试用,不受 Metatrader Tester 限制。 :  点击这里 1. 容易获得的优势 根据货币和时间范围显示买入和卖出信号。 评估自图表中出现箭头以来价格上涨或下跌的点数。 (趋势筛选指标箭头) 显示信号的时序。 获取多时间范围和多货币警报以购买和出售警报。 2. 如何使用趋势线图 如何显示买卖信号仪表板? 如果您有任何问题或需要帮助,请通过私
PZ Support Resistance MT5
PZ TRADING SLU
4.17 (6)
厌倦了绘制支撑线和阻力线? 支撑阻力 是一个多时间指标,可以自动检测并绘制图表中的支撑线和阻力线,并具有非常有趣的变化:随着时间的推移测试价格水平及其重要性的提高,线变得越来越粗。 [ 安装指南 | 更新指南 | 故障排除 | 常见问题 | 所有产品 ] 一夜之间增强您的技术分析 无需浏览图表即可检测重要的价格水平 一目了然地识别所有价格水平的相对优势 每次交易最多可节省半小时的绘图线 指标显示所有价格水平的期限 指示器不重涂 过去和现在的价格水平因接近程度而崩溃,并根据当前的市场行为进行了调整。在动作发生的地方绘制了线条,而不一定在峰值处绘制了线条。 价格水平随着时间的推移而被拒绝,变得越来越暗 定期清除不重要的价格水平以避免噪音 可自定义的时间范围选择和崩溃因子 它实现了电子邮件/声音/推送警报的突破 输入参数 指标设置:指标将从当前时间段读取价格,但您可以选择另一个。例如,您可以在H4图表中显示D1支撑线和阻力线。您还可以使用 价格水平密度 参数选择在图表上显示多少价格水平。 颜色设置:根据重要性输入所需的支撑线和阻力线颜色。 标签设置:(可选)可以在指示器中显示用于
Legend mt5
Vladyslava Shaviernieva
This is an indicator that includes the best basic forex indicators , without redrawing. Based on this data, a sell or buy signal is generated. It does not disappear anywhere after the signal, which gives us the opportunity to see the results on the history. It can be used on any currency pair, crypto, metals, stocks It is best used on an hourly chart, but other periods are also acceptable. The best results for the period H1,H4,daily If customers have any questions, I will answer them and af
Trend Hunter MT5
Andrey Tatarinov
5 (2)
Trend Hunter 是外汇、加密货币和差价合约市场的趋势指标。 该指标的一个特点是,它可以自信地跟随趋势,当价格略微刺穿趋势线时不会改变信号。 指标不会重新绘制;收盘后会出现入市信号。 当沿着趋势移动时,指标会显示趋势方向上的其他入场点。 根据这些信号,您可以使用较小的止损进行交易。 趋势猎人是一个诚实的指标。 当您将鼠标悬停在指标信号上时,会显示该信号的潜在利润和可能的止损。 当出现新信号时,您可以收到以下通知: 警报 推送通知 通过电子邮件通知 电报中的通知 图表的屏幕截图也会发送到 Telegram,因此您无需打开终端即可做出交易决定。 指标信号可以在电报频道中在线查看 https://www.mql5.com/zh/market/product/11085#!tab=comments&page=13&comment=50356403 趋势猎人扫描仪可帮助您评估其他货币对和时间范围的趋势方向。 您还可以使用扫描仪接收其他仪器的入场信号。 要自动化交易,您可以使用使用指标信号进行交易的顾问  该指标通过位于图表下方的便捷面板进行控制。 MT4 版本 https://www.
TPSpro RFI Levels MT5
Roman Podpora
4.55 (20)
该指标重新定义了交易,成为图表分析的基准,并为交易设定了新的标准。 反转区域 / 峰值成交量区域 / 大玩家的活跃区域   说明 RUS         说明书 中文 / 我们建议使用指标 -   TPSpro TREND PRO 该指标的每位购买者还可免费获得: 6 个月内可访问 RFI SIGNALS 服务的交易信号 - 根据 TPSproSYSTEM 算法准备的切入点。 定期更新的培训材料 - 让您沉浸在策略中并提高您的专业水平。 工作日每天 24 小时提供支持,并可以访问封闭的交易者聊天室 - 沟通、协助和市场情况分析。 作者设定的文件——自动指标设置,无需额外努力即可获得最大效果。 -   MT4版本 主要功能: 显示卖家和买家的活跃区域! 该指标显示购买和销售的所有正确的第一脉冲水平/区域。当这些级别/区域被激活时,从那里开始搜索入口点,级别会改变颜色并填充特定的颜色。还出现了箭头,以便更直观地了解情况。 LOGIC AI - 激活模板时显示用于搜索入口点的区域(圆圈) 为了提高视觉清晰度,添加了使用人工智能搜索入口点的显示区域的功能。 显示更高时间范围内的
Atomic Analyst MT5
Issam Kassas
4.32 (19)
首先值得强调的是,该交易指标是非重绘、非延迟的指标,这使其成为手动和机器人交易的理想选择。 用户手册:设置、输入和策略。 Atomic Analyst是一种PA价格行动指标,利用价格的力量和动量来寻找市场上更好的机会。配备了高级过滤器,可帮助去除噪音和假信号,并提高交易潜力。使用多层复杂的指标,Atomic Analyst扫描图表,并将复杂的数学计算转化为任何初学者都能理解并用来做出一致交易决策的简单信号和颜色。 “Atomic Analyst”是专为新手和经验丰富的交易者量身定制的综合交易解决方案。它将高级指标和一流功能融合为一体的交易策略,使其成为所有类型交易者的多功能选择。 日内交易和剥头皮策略:专为快速准确的日内交易和短期交易而设计。 日内和摆动交易策略:可用作追求价格大幅波动的日内和摆动交易者的可靠工具。 多货币和市场:凭借其可靠的精度,在不同的工具和市场上运作。 多个时间框架:可在多个时间框架上使用,性能良好。 稳定性:所有指标均不重绘、不重绘和不滞后,确保可靠的信号。 信号清晰度:提供箭头信号,用于清晰的入场和出场点。 实时警报:通过交易入场、SL和TP警报通知交易者
Quantum TrendPulse
Bogdan Ion Puscasu
5 (13)
介绍 Quantum TrendPulse   ,这是一款终极交易工具,它将 SuperTrend   、   RSI 和 Stochastic 的强大功能整合到一个综合指标中,以最大限度地发挥您的交易潜力。该指标专为追求精准和效率的交易者而设计,可帮助您自信地识别市场趋势、动量变化以及最佳进入和退出点。 主要特点: 超级趋势整合: 轻松跟随当前的市场趋势并乘上盈利浪潮。 RSI 精度: 检测超买和超卖水平,非常适合把握市场逆转时机,可用作 SuperTrend 的过滤器 随机精度: 利用随机振荡在波动的市场中寻找隐藏的机会, 用作超级趋势的过滤器 多时间范围分析: 从 M5 到 H1 或 H4,在不同时间范围内关注市场动态。 可定制的警报: 当您的自定义交易条件得到满足时收到通知,这样您就不会错过任何交易。 无论您是新手还是经验丰富的交易员,   Quantum TrendPulse 都能为您提供所需的优势,帮助您增强策略并自信地进行交易。借助这一强大的指标,将洞察力转化为利润 — 掌控您的交易! ***购买 Quantum TrendPulse,即可免费获得 Quantum Tr
Advanced Supply Demand MT5
Bernhard Schweigert
4.5 (14)
任何新手或专业交易者的最佳解决方案! 该指标是一款独特、高质量、且价格合理的交易工具,因为我们已经整合了许多专有功能和新公式。 依据此更新,您将能够显示双重时间帧区域。 您不仅可以显示一个较高的时间帧,还可以同时显示图表时间帧,加上更高的时间帧:显示嵌套时区。 供需双方所有交易者都会喜欢它。 :) 重要信息披露 高级供需的最大潜力,请访问 https://www.mql5.com/zh/blogs/post/720245   想象您的交易如何得以改善,是因为您能够精准定位入场或目标位吗? 构建于新的底层算法,它可以更轻松地识别出买卖双方之间的潜在失衡。 这是因为它以图形方式展示供需最强劲区域,及其过去的表现(显示旧区域)。 这些功能旨在帮助您更轻松地发现最佳入场区域和价位。 现在您可以针对您的交易品种和时间帧来优化和编辑区域强度! 高级供需指标适用于所有产品和时间帧。 它是一个新的公式,非常新的功能是两个区域强度函数可由用户输入进行调整! 这在交易中是一大优势。 当您学习如何使用专有功能,例如带有价格游离最小 X 因子的区域强度时,您能够判断该区域强劲与否。 供需区域用作警报触发器。
作者的更多信息
Visual Depth of Market
Fernando Lahude Ritter
3.89 (9)
ATTENTION: Bear in mind this indicator will ONLY work with your broker/symbols has Level2 data otherwise NOTHING will be shown Level 2 Book Visualization Indicator Our innovative indicator seamlessly integrates Level 2 order book data onto your trading chart, offering a real-time view of market depth and the dynamics of supply and demand. With its two key features, you can enhance your market analysis and make more informed trading decisions: Biggest Volume Highlight: This input allows traders t
FREE
CM Williams Vix Fix
Fernando Lahude Ritter
5 (1)
This is CM Williams VIX Fix Indicator by ChrisMoody adapted to MQL5 The CM Williams VIX Fix indicator, developed by Larry Williams, is a technical analysis tool designed to replicate the market sentiment insights provided by the CBOE's VIX, but applicable to a wide range of asset classes beyond stock indices.Unlike the actual VIX, which measures implied volatility in the S&P 500 options market, the VIX Fix utilizes historical price data to identify periods of significant market stress, often as
FREE
Seconds Candle Period
Fernando Lahude Ritter
5 (1)
This is an extension indicator that allows the user to select any second time-frame from 1 to 60 second without any multiplier limitaion (ex, 7 seconds, 13 seconds ... are all allowed).  There is only one input called Interval that allows you to set the seconds timeframe you want given is in the range above. You can use indicators on that new time frame with no problems and also build your EAs based on any second timeframe. I hope this is useful, please let me know any bugs you find! Note: Since
FREE
Squeeze Momentum
Fernando Lahude Ritter
5 (1)
This is the Squeeze Momentum Indicator from TradingView by LazyBear ported to mql5. Is the same logic and plotting. Interpreting the Indicator: Detecting a Squeeze: Look at the separate line’s color. If it indicates a squeeze (often shown as one distinct color), it means price is currently consolidating and volatility is low. This is a time to watch carefully for upcoming breakouts. When the Squeeze Fires: Once the indicator switches from the “Squeeze On” color to the “No Squeeze” or “Squeeze O
FREE
AlphaTrend
Fernando Lahude Ritter
4 (2)
Overview: The AlphaTrend Indicator is a custom technical analysis tool designed for the MetaTrader 5 (MT5) trading platform. This indicator uniquely combines the Average True Range (ATR) and the Money Flow Index (MFI) to offer traders a novel approach to trend analysis and potential reversal points in the market. Key Features: ATR-Based Trend Analysis: Utilizes the Average True Range (ATR) to assess market volatility, aiding in identifying potential trend reversals. MFI Integration: Incorporates
FREE
Crossing Average EA
Fernando Lahude Ritter
This is the classic strategy of moving average crossover. There is plenty useful configurations like trailing stops, trend detection, position protection and much more. If you want a user manual I can send you one, just DM me and I will provide. This is a free EA that works in any market and any timeframe is very simple but can be very profitable with the right configuration and market!
FREE
VI Vortex
Fernando Lahude Ritter
4.75 (4)
Description : Enhance Your Trading Strategy with the Advanced Vortex Indicator for MT5! Discover the power of the Vortex Indicator (VI), a robust technical analysis tool now available for MetaTrader 5. This custom-built indicator is designed to help traders identify trends and reversals, offering a critical edge in the dynamic Forex market. Key Features: Dynamic Trend Identification : With the VI's unique calculations of VI+ (positive) and VI- (negative) lines, you can easily spot trend strength
FREE
TR Agression Balance
Fernando Lahude Ritter
5 (1)
Shows the agression balance (buy agression deals - sell agression deals) in a histogram. The agression is calculated on every tick of a given candle  and is the sum of volume of all the market buys minus all of the market sell trades. If the ticker does not have real volume, tick volume is used insted; Very useful to determine if a given candle is dominated by bulls or bears  It is necessary for the data provider to have a list of trades (times & sales) as well as the agressor (buy/sell) data.
FREE
Projected Volume
Fernando Lahude Ritter
Volume Projection Indicator The Volume Projection Indicator is a specialized tool designed for traders who focus on the relationship between volume and price action. This intuitive indicator projects the expected volume for the ongoing candle, aiding in decision-making during live market conditions. The indicator presents volume data in a histogram format directly on the chart for quick analysis. Features: Bullish Volume Representation : Each green bar in the histogram signifies the volume for a
FREE
Aroon Indicator Classic
Fernando Lahude Ritter
The Aroon indicator measures the time since price highs and lows over a set period. It outputs two lines, Aroon Up and Aroon Down. Aroon Up shows how long it has been since a recent high occurred. Aroon Down shows how long it has been since a recent low occurred. When Aroon Up stays close to 100 and Aroon Down stays near 0, it suggests an upward trend. When Aroon Down is near 100 and Aroon Up is near 0, it suggests a downward trend. The closer each line is to 100, the stronger the recent trend i
FREE
Laguerre Filter
Fernando Lahude Ritter
Laguerre Indicator with Gamma Input Overview: The Laguerre Indicator is a sophisticated financial analysis tool designed to provide traders and investors with a dynamic and responsive method to track market trends. Its core functionality is centered around a unique algorithm that adapts to market volatility, offering clearer insights compared to traditional indicators. Key Feature - Gamma Input: Gamma: The sole input for the Laguerre Indicator, 'gamma,' plays a pivotal role in calibrating the i
FREE
Auto Price Levels
Fernando Lahude Ritter
5 (3)
Auto Levels is a technical analysis indicator designed to automatically identify and draw support and resistance levels on price charts.  The robot is capable of automatically identifying support and resistance levels based on historical price patterns, eliminating the need for manual analysis. You can set the maximum number of lines that the indicator plots as a parameter
FREE
General Clock
Fernando Lahude Ritter
A Simple clock that on the left side "Time" shows r espectively the TimeCurrent, followed beneath by the TimeLocal. On the right hand side we have the remaining minutes and seconds of the current candle. TimeLocal is synced every 500 miliseconds however, the TimeCurrent and the time left on the candle are synced every tick, so this can lead to inconsistencies on the readings so keep that in mind. This indicator have no plots or buffers so it cannot be used in any time based EA.
FREE
Ultimate Oscillator
Fernando Lahude Ritter
Title : Ultimate Oscillator - Multi-Timeframe Momentum Indicator Description : Overview : The Ultimate Oscillator is a powerful and versatile technical analysis tool developed by renowned trader Larry Williams. This indicator is specially designed to capture market momentum across three different timeframes, providing a comprehensive view of the market's dynamics. Unlike traditional oscillators, which are confined to a single timeframe, the Ultimate Oscillator integrates short-term, medium-term,
FREE
Chart Trading
Fernando Lahude Ritter
The Manager Panel is a streamlined trading interface designed for quick and efficient order execution and management. Below is the updated description based on the added functionality: Key Components: Top Configuration: TP (Take Profit): Configurable input field (currently set to 100 pips) to define the take profit level. SL (Stop Loss): Configurable input field (set to 100 pips) for specifying the stop loss level. Pips Dropdown: Selector to confirm the unit of measurement for TP/SL is in pips .
筛选:
无评论
回复评论
版本 1.20 2023.12.16
Zero division