Bento Market Structure
- 指标
- Gede Hendra Saputra
- 版本: 1.6
- 更新: 20 七月 2024
- 激活: 5
Overview
Automated smart money market structure identification following smart money concept and inner circle trader concept, it gives an unprecedented edge on your smart money and market structure analysis by automatically identifies valid market structure using smart money concept:
- Identify impulsive and corrective moves
- Identify valid pullbacks built by impulsive and corrective market moves
- Idenitfy bearish or bullish leg and their inducements for smart money concept
- Identify valid market structure based on inducement sweep
- Identify swing and internal structure
- Identification of pull backs as liquidity pool
- Identification of Fair Value Gap including Regular, Implied, Volume and Gap
- Identification of Order Block based on pullback followed up by an Fair Value Gap
- Identify Institutional Funding Candle
These are all thanks to the following unique, beautiful and performant implementation of:
- Independent bullish and bearish market structure identification based on smart money concept
- Contextual market structure in-control (bearish or bullish swing structure) to spot buy side and sell side liquidity based on smart money concept
- Configuration of premium and discount area within the structure following smart money concept
Details in Chart
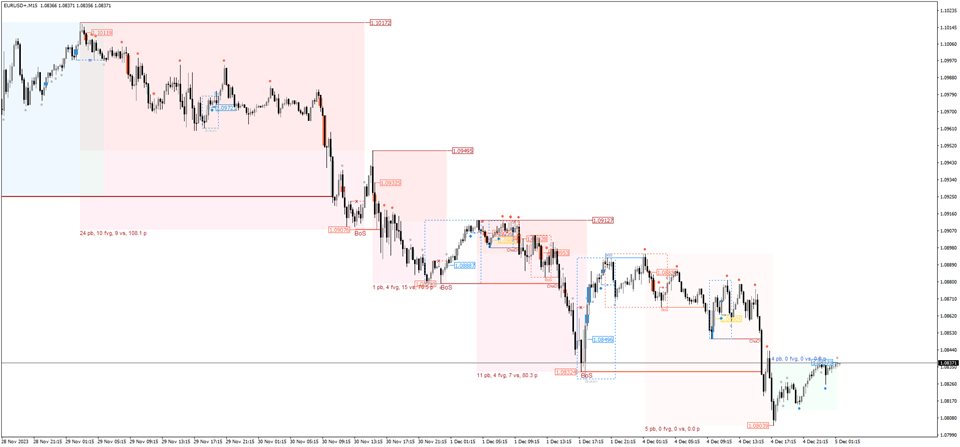
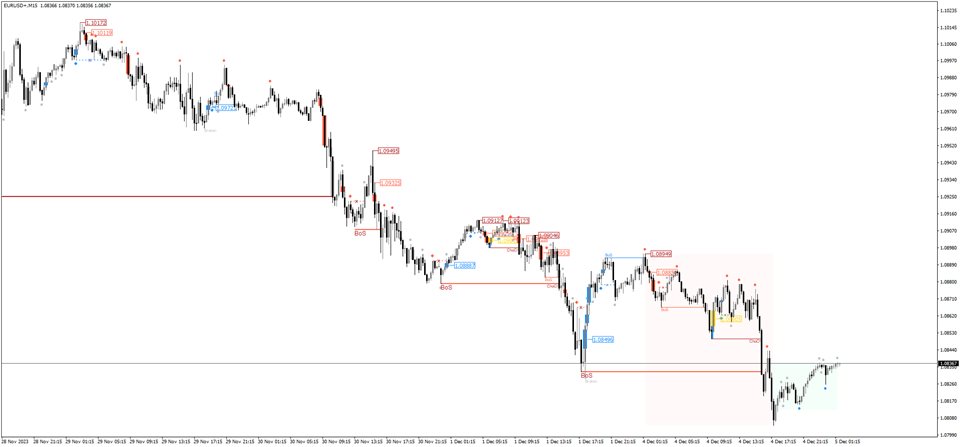
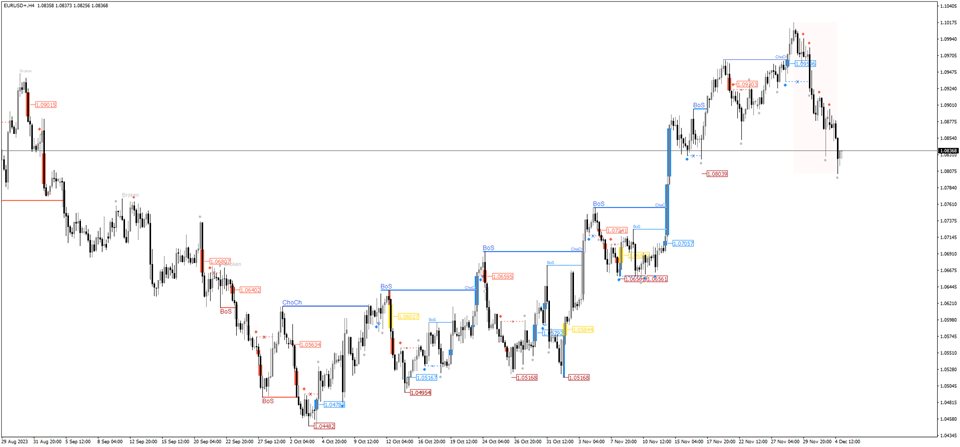
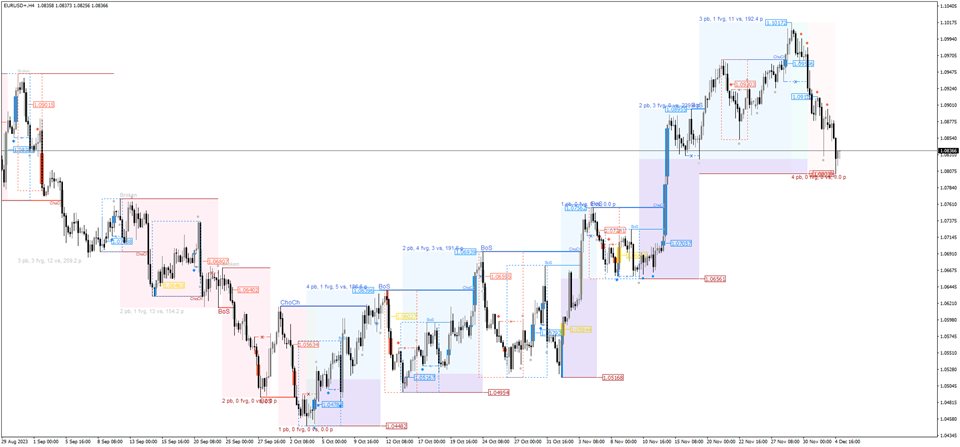
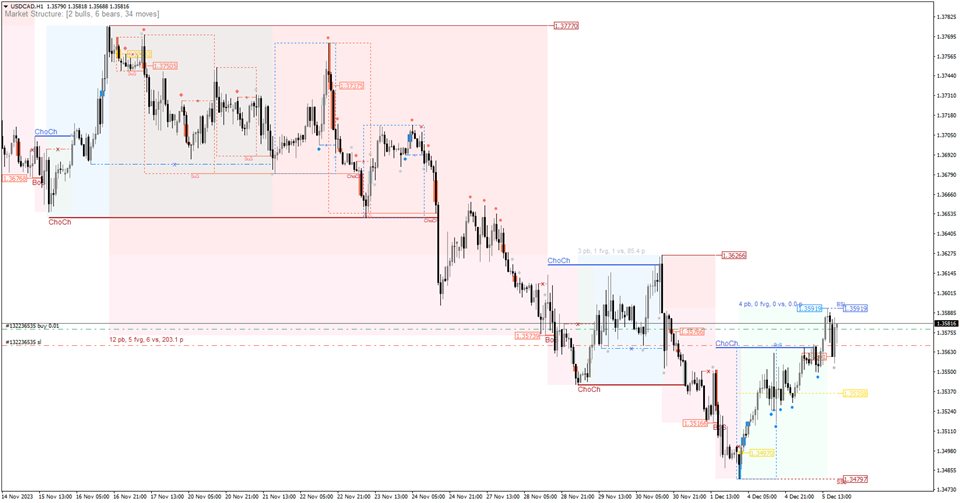
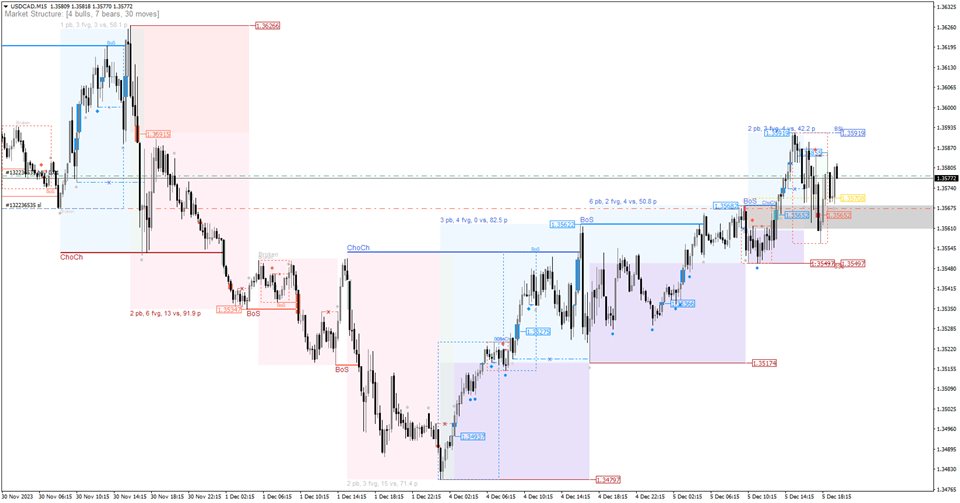
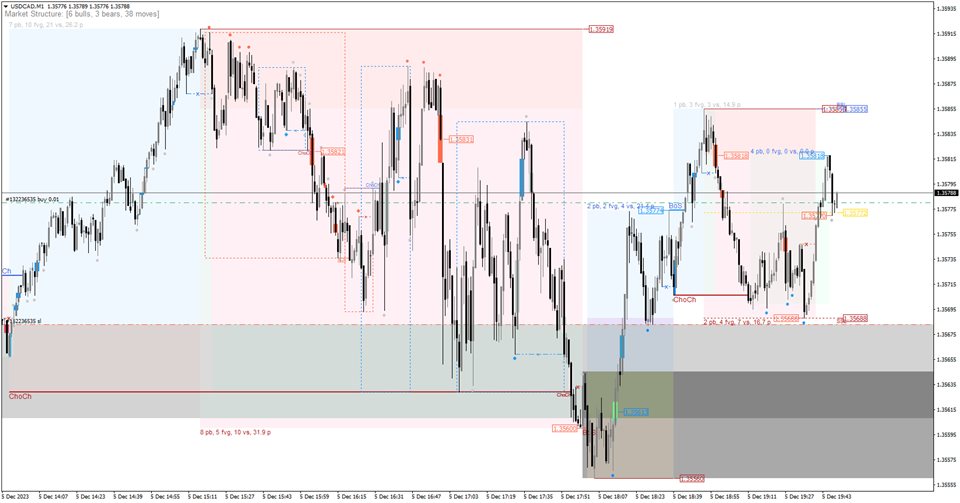
Each objects rendered in your chart represents:
- Alice Blue Rectangle: Major/Swing Bullish Structure
- Lavender Blush Rectangle: Major /Swing Bearish Structure
- Lavender Rectangle: Order Flow of Major/Swing Bullish Structure
- Misty Rose Rectangle: Order Flow of Major/Swing Bearish Structure
- Tomato/Dodger Blue Dots: located above/below shadows represents Valid Pullback within a structure
- Fire Brick/Dodger Blue Horizontal Line: Represent Change of Character and Break of Structure
- Tomato/Dodger Blue Rectangle: on candle(s) represents Fair Value Gap
- Gold Rectangle: Represents Institutional Funding Candle and Order Block
Trading Strategy
- This is a full implementation of mechanical market structure identification based on smart money concept which automatically identify pullbacks, impulsive, and correction move to build up a valid strcuture
- Once a valid market structure is identified, then you have your dealing range (buy side and sell side extreme liquidity)
- Within a market structure in HTF, try to locate liquidity-like pattern such as:
- Pullbacks as liquidity pool (dots)
- Pullbacks in premium area (50% area of dealing range)
- Order block (pullback + fair value gap) in premium area
- Fair value gap in premium area
- Institutional funding candle
- Once price hit the area:
- Wait for a valid move to opposite direction in lower timeframe, such as M1 or M5
- Color of visited area will then change to gray to indicate its no longer a fresh area
Good luck :)

