• 概述
  • 评论
  • 评论
  • 新特性

Quick Drawing Tool

注意⚠️测试模式使用时:

1.为获得最接近实际使用的体验,测试模式需要使用即时价格测试,并把测试速度调到合适水平(价格跳动频繁但是K线步进缓慢)。

2.测试指标前 单击 “指标属性” -> 单击“重设” 以恢复指标默认参数。

截图内容只是冰山一角


____由于MT4的画线功能比较基础,迈达克官方也无意改进升级,但是后起之秀TradingView的出现极大拓展了画线分析部分的功能(当然TV的优势远不止于此),甚至国内的很多看盘软件的画线功能也比MT4原生的画线功能要强大。当然市面上传播的画线工具肯定也是有很多的包括五年前我写的一些相对简单的工具。但是现存的所有加起来也无法和便捷画线工具第三版相提并论,这是MT史上最强的画线工具没有之一,这是使用画线工具的朋友给出的评价。本工具初版5-6千行代码,经过一年的升级优化写到第三版已经超过2万行代码(当然空行大括号和注释的占比也不会很低估计在10-20%左右我的代码很规范 每一个变量都不会瞎命名也不会对只用得到一两次的功能单独写一个函数当然也不会在需要反复调用的时候一遍遍复制雷同代码),最终功能呈现就是本文档所见这样几十个功能改进当然有些细节本文档也没有具体讲需要用户观看讲解视频学习使用。

____本工具细节尽量都做到极致,包括但不限于填充对象与非填充对象的多态、提供了多套主题供不同偏好的用户选择、每一个按钮都不浪费(切换面板尺寸按钮及区间跨度上下切换按钮)、停止标记的方式(同位置二次单击及价格轴单击)等。在此隆重请出两位功臣出场,一位是广东王哥(网名刺客)提供了初版需求,另一位是福建曾哥提供了大量修改建议可以说没有他可能就没有第三版,而且第二版的黑色背景发光的主题按钮就是他设计的,其他的按钮是我画的应该说界面这些图形处理是我本等的手艺,因为在本科四年平面设计的工作我做了很多网页三剑客都是认真学了的,除了兵法博弈论马哲计量经济学花了大气力学另外花的最多的时间学的就是各种图形图像设计软件,然而最终用得最多的唯抠图调色尔。

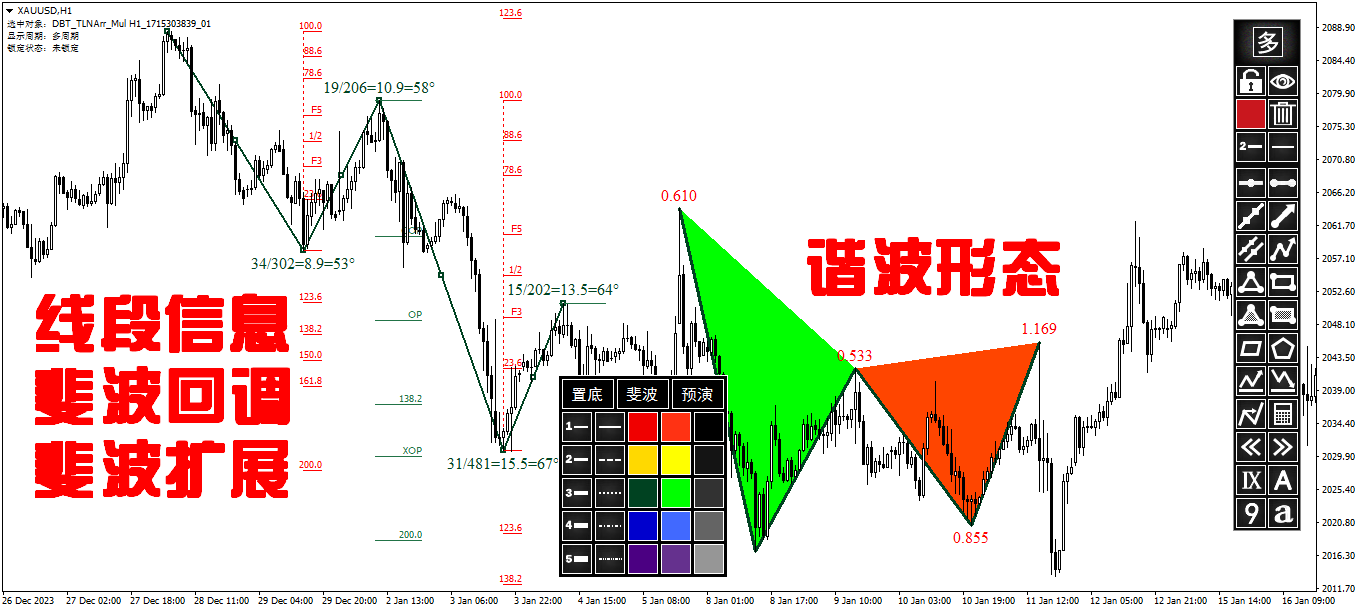
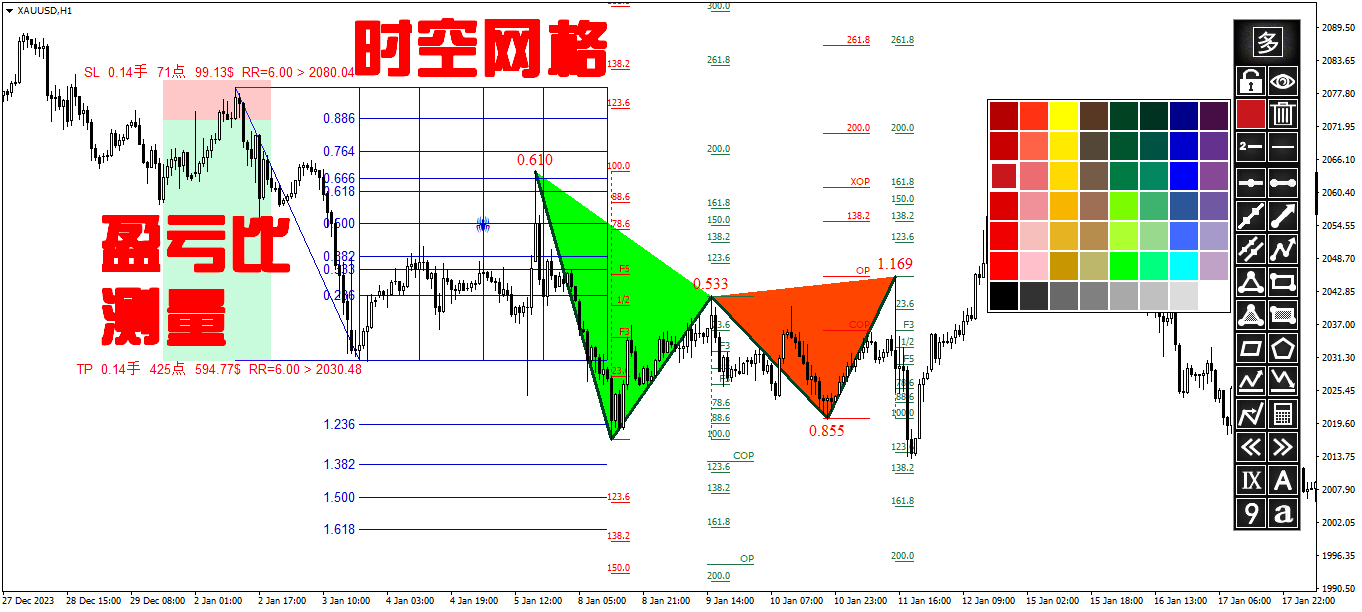
____很不幸由于国内用户用TradingView太麻烦(非常扯淡的原因需要翻墙),尤其对于学习缠论、波浪、鹿希武趋势交易法、谐波、形态、PA价格行为、供需区、SMC订单流(ICT等)的交易者都会频繁用到趋势线或折线通道线矩形框回调线盈亏比测量等分析工具甚至也需要便捷的术语标记功能。而且MT4的通道线还存在设计缺陷(MT5中已经被修正)也就是它无法置于背景导致很多时候通道线会遮挡其他按钮界面,这就让人难以接受了,只能用趋势线取代通道用。我在本工具中用趋势线组合模拟了通道线解决了置底的问题同时增加了趋势线复制功能这样的话我们画四条线的通道(也就是增加了两条边距线)也变得方便了算是意外所得。

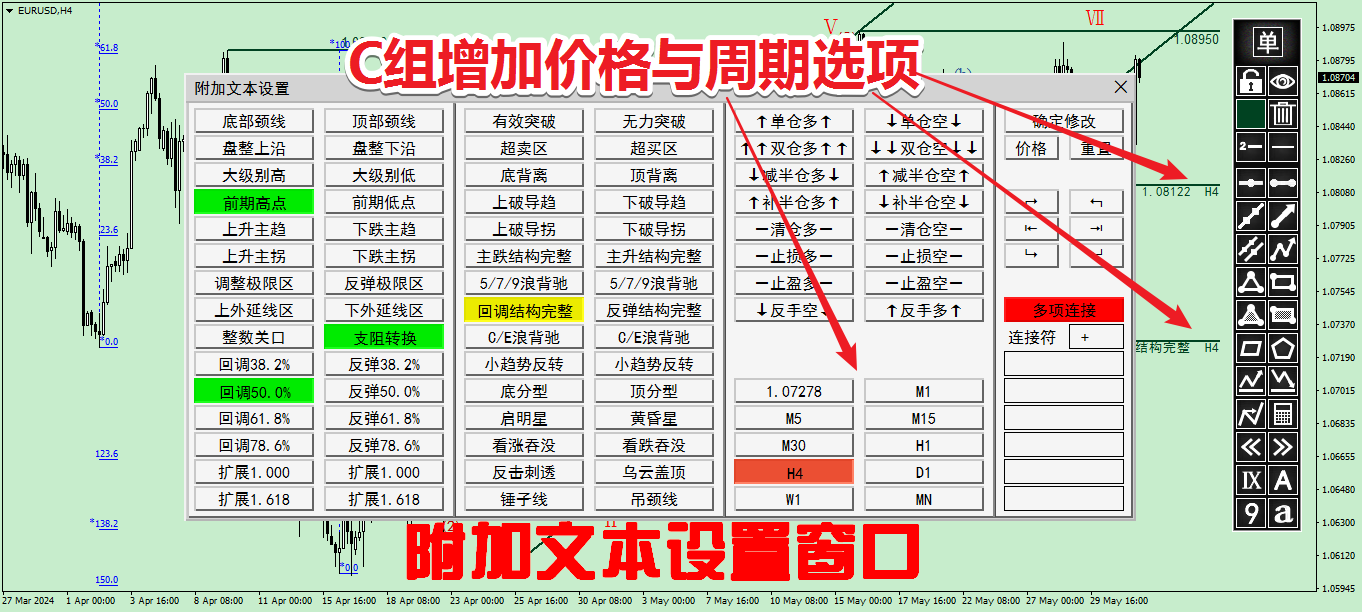
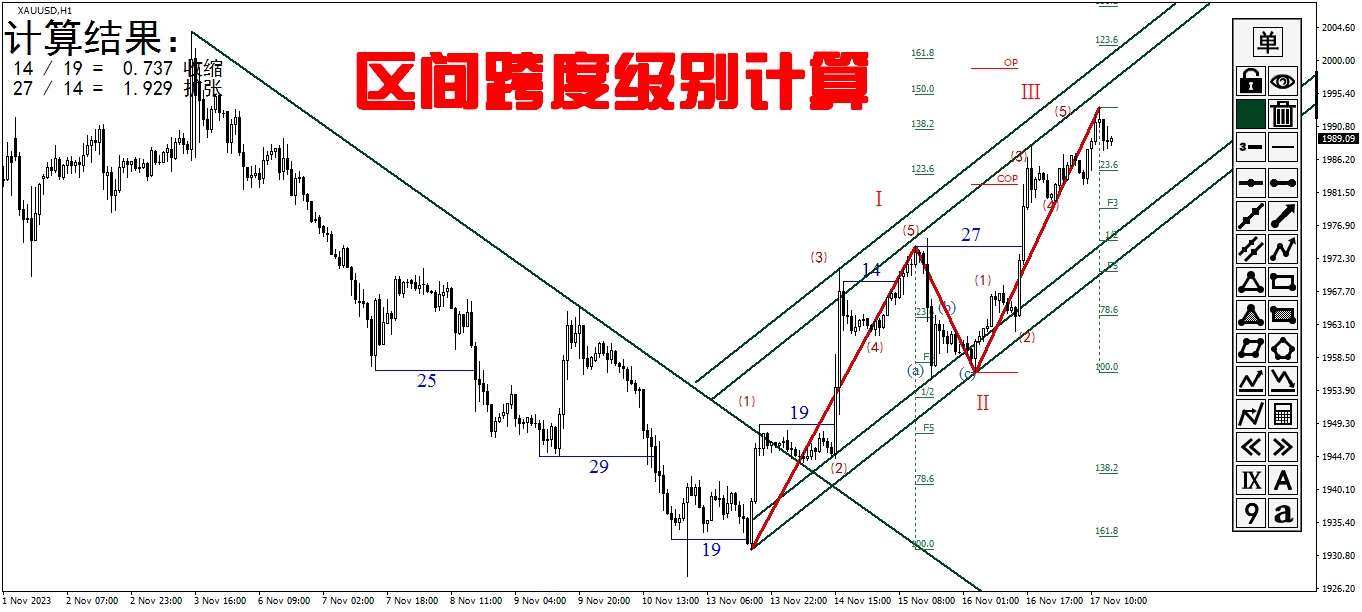
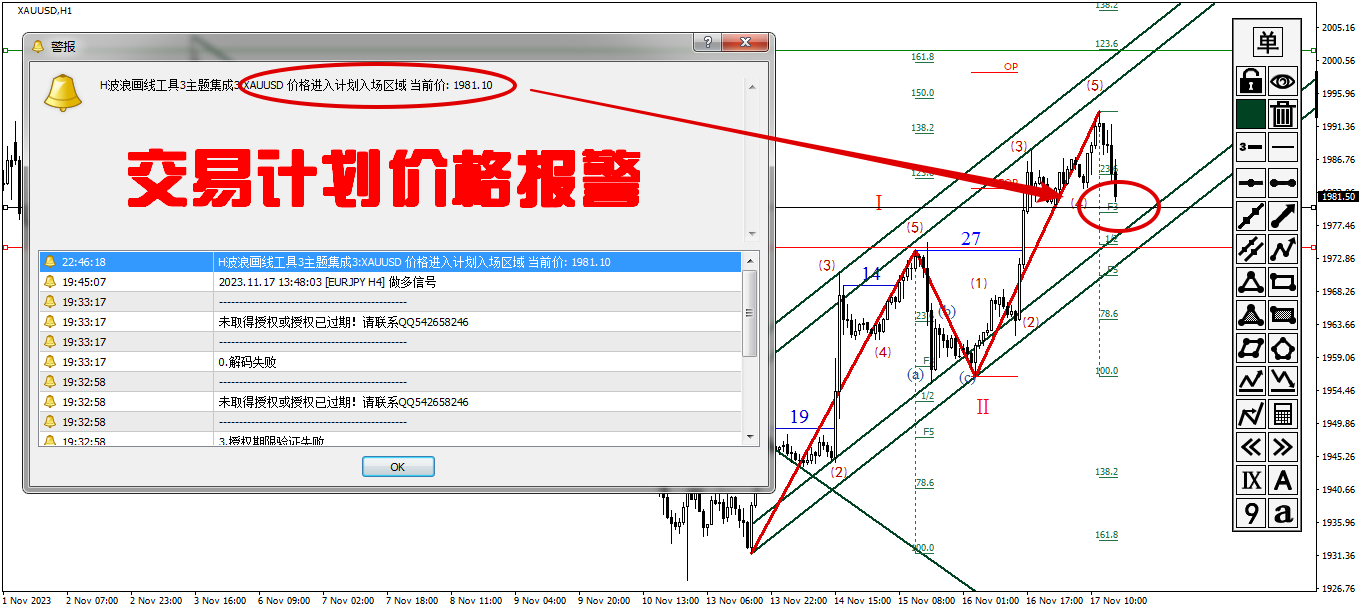
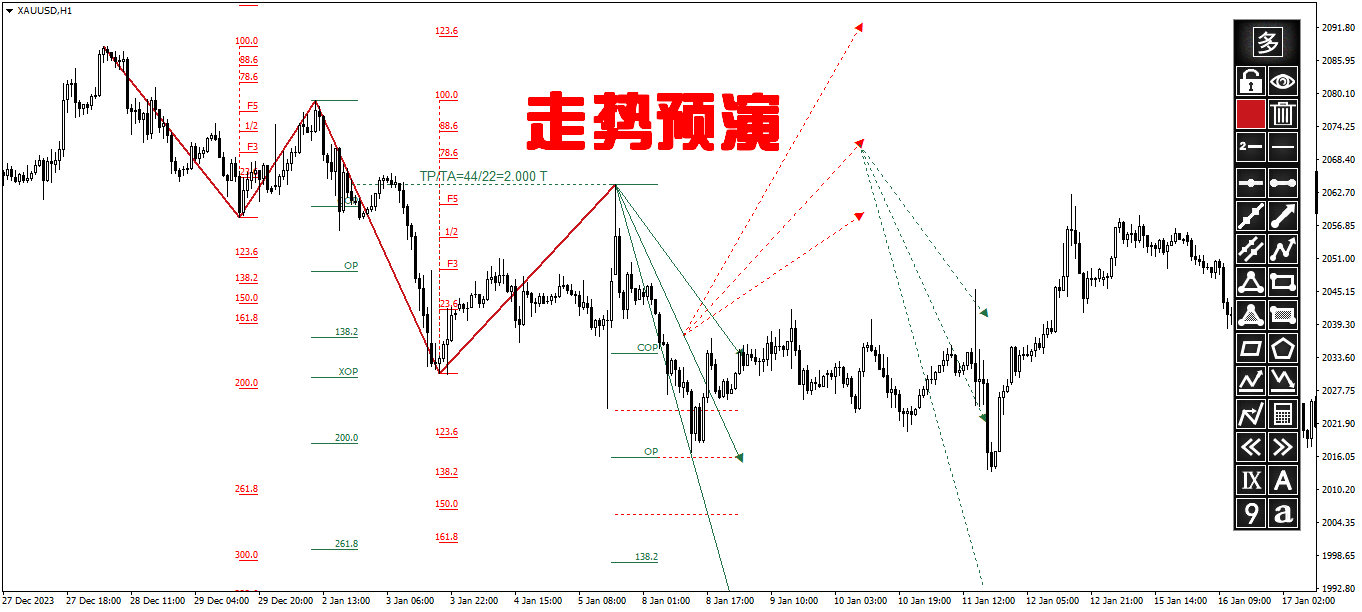
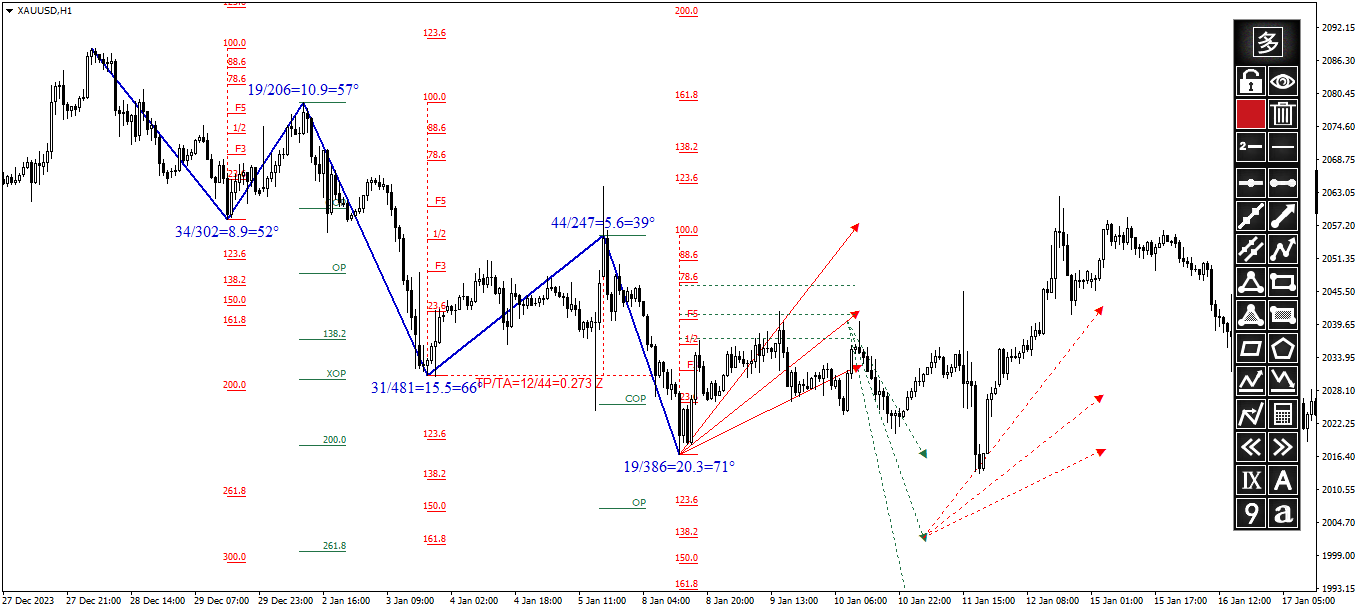
____初版和第二版选取了最常用的几个画线工具写进面板,在第三版增加了鹿希武波浪部分的区间跨度以及波浪标记功能,而且扩展了对选中对象操作的便捷功能比如连续锁定、连续删除、自动查找高低点、复制、水平翻转、快速改变对象属性(比如置于背景、宽度、颜色、射线、显示周期多单切换、报警启停,快捷切换显示连续线段信息等便捷功能),以及对象属性面板双击调出设置报警模式等。这样以后在MT4上使用便捷画线工具的体验得到大大提升甚至某些方面比TV更加好用,最重要的是不用再跑去网页上去画线分析交易,本来打开网页去交易就很麻烦了还要去翻墙用这是想麻烦死谁啊,而且网页的界面以及稳定性体验肯定都是不如客户端程序这是自不必提的。

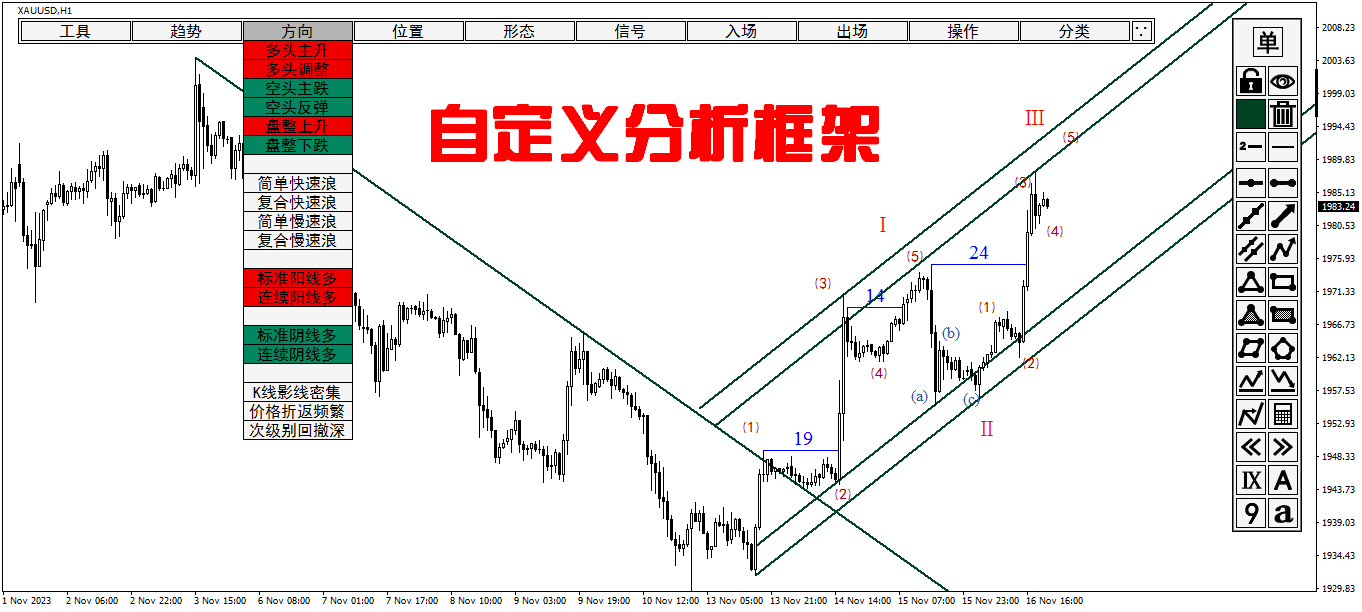
____如果止步于此,那么也没什么可神气的,只不过是更好用的个画线工具而已吗。所以重点来了。由于我自己是师从鹿希武老师的波浪及画线分析,对鹿版波浪的熟悉程度最深,但是技术分析的流派纷杂,单就趋势派而言大体框架是一致的,就单品种而言概括起来无非是级别、趋势、方向(和趋势有区别 趋势表示的是一种惯性 比如受力方向是向下 物体的趋势是向下的但并不表示物体的运动方向不能向上)、位置或区域(主浪结束区域、调整浪结束区域、趋势结束区域、主调转换区域即调整浪转换成主浪的临界区域或调整浪转换成主浪的临界区域)、阶段或周期(主浪或调整浪或趋势所处的阶段初中期或末期)、划分级别的标准(即约束某一级别的判别条件)、信号(指标信号与K线或形态信号)、过滤信号的条件、操作模式(单仓或分仓加减、趋势跟踪或波段交易等、止损止盈条件及移损保盈方式)、风控设置。除了专为鹿版波浪写的区间跨度和波浪标记以外,自定义分析框架里也内置了鹿版波浪分析框架,同时也内置了常规分析框架。对于其他有自己分析框架的交易者可以用外部参数自定义自己流派的分析框架。很多价格行为或订单流的交易者喜欢在TV图表上标记专有名词比如HH(Higher High)、HL(Higher Low)、SSR(Significant Support Resistance)、Pin Bar 、PB(Price Break)、FB(Fake/False Break)、OB(Order Block)、BMS(Break in Market Structure)/BOS(Break Of Structure)、SMS(Shift in Market Structure)、SSL(Sell Side Liquidity)、BSL(Buy Side Liquidity)、FVG(Fair Value Gap)等等,如果用我的自定义分析框架标记那不要太方便!这玩意儿还需要手打?想麻烦死谁啊?

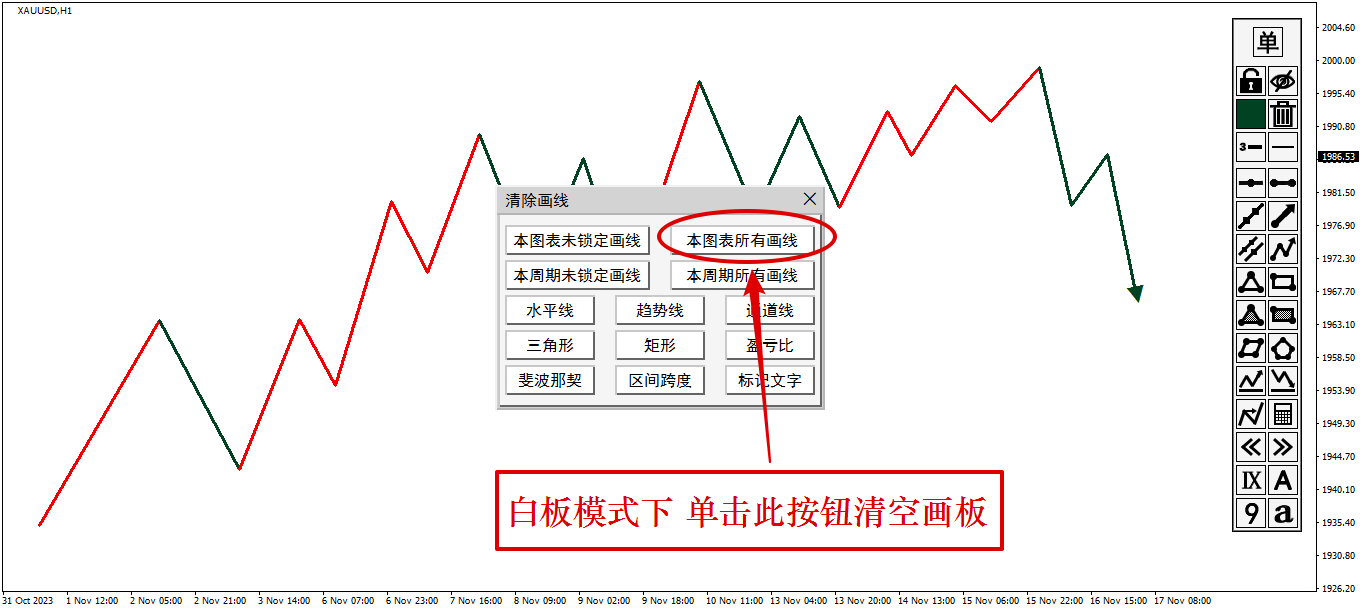
____That’s enough?达咩达咩!如果说自定义分析框架是操作流程说明书或者推理论文,那么加载图表背景图片就是分解图或者陈安之成功学励志鸡血文。一个是具有条理性的逻辑思维,一个是具有发散和强刺激的创造性思维,前者是左脑负责的区域,后者是右脑负责的区域,一个是指令式的一个是刺激性的。自定义分析框架引导你严格按分析系统操作,而加载图片帮助你强化系统规则,这两个功能实现完美搭配。由于图片内容可以是任何内容,你可以在自定义图片文件夹内放任何你想强化的内容比如:系统流程图、规则警示语、交易记录的经验总结图片、甚至风景图片What ever you need。有人可能会讲,我自己保存在桌面不也一样可以浏览图片吗?不要小看这一点点便捷性,你只需要问你你有看过吗?表面上看是差了一点点,在图表上加载浏览图片只是便捷了一步而已,但就是这一步造成截然不同的结果(类比抖音腾讯和淘宝的区别,入口的便捷性产生的影响是巨大的,如果我经常使用的APP可以快捷进入购物系统我何必单独下载一个APP舍近求远除非单独APP其他方面的优势显著优于前者,便捷性是人性的深入骨髓的天然需求简言之就是经济性原则),我很明确地知道绝大部分根本不会去经常单独打开文件夹查看记录图片或者强化系统相关的截图,但是一旦你用了我这款工具你会有强烈的意愿经常加载背景图片浏览,一是便捷二是不需要离开交易软件而且如果图片置底还不影响监测跟踪行情(这一点非常重要)。另外我们有交易计划表,有强大的画线分析、标记功能、而且具有截图保存日志的功能,等于是内建了一个日志系统,我们可以把分析和计划截图保存进日志随时调出来与行情进行比对。最后,指标里面内置了白板功能也就是所谓的屏幕划线,在白板模式里,我们的画线体验甚至超过了绝大部分画图软件,PS太麻烦,Office更不用说,Windows自带的画图软件差太多,白板模式支持一键复制到剪贴板,也支持清空白板,作为一个画图软件也足够了。

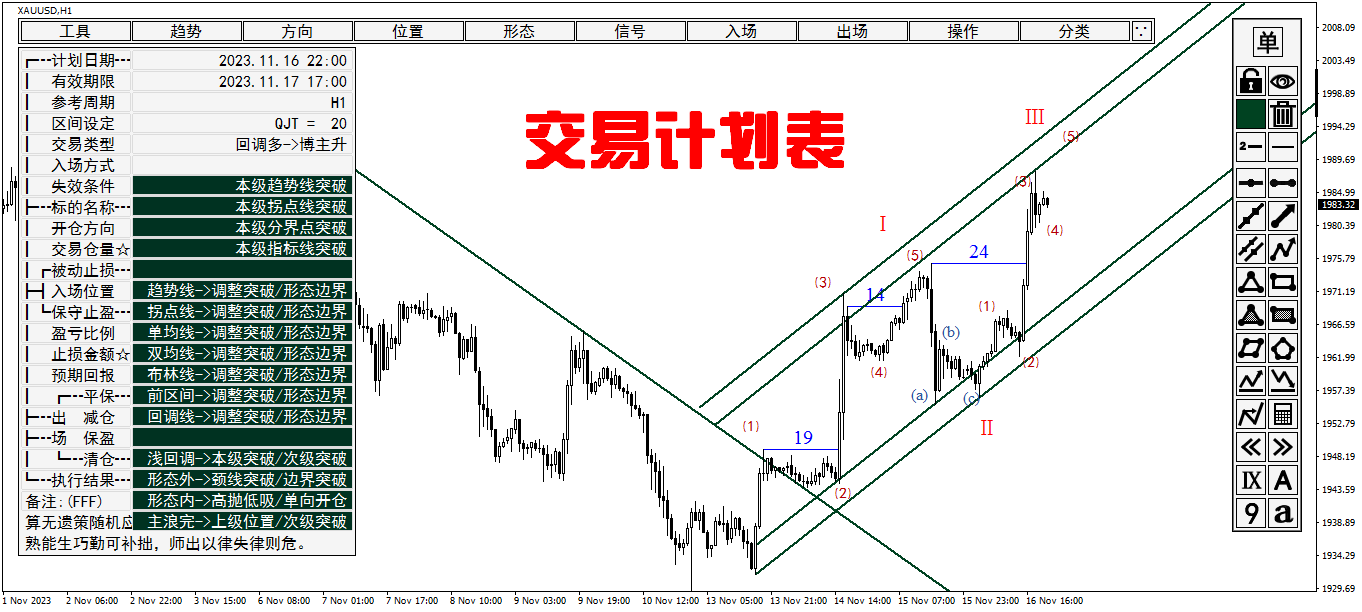
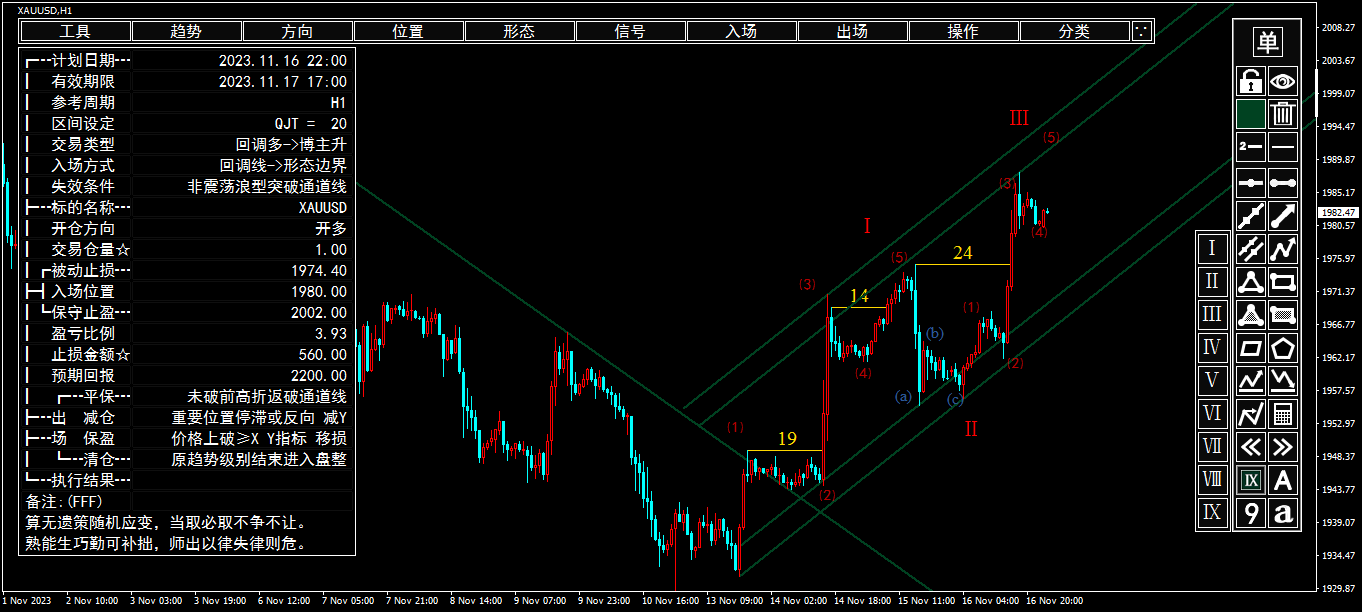
____既然有了日志功能,交易计划制定当然也不能少。魏强斌的书里面经常用的一句话:计划你的交易,交易你的计划。凡事预则立不预则废,如果事先对任何情况都进行了完全分类并针对那几种情况制定优势策略做到算无遗策,那么交易不过是见招拆招随机应变而已。严格意义上讲,交易行为没有任何不可预见的意外,最多也就是突然跳水被止损掉这个是参与交易市场时就应该接受的,盘中任何的变化(也不过有限的几种,总不至于几十种吧?如果是请重新整理你的标准把分类缩小到十种以内)都不应该让你感到意外。我设计了交易计划表,一是让你自己彻底捋清楚你的系统细节,因为里面有交易类型、入场方式、平保条件、移损条件方式、保盈条件方式、清仓条件的分类,你必须自己要清楚交易的每一个环节;二是配合日志功能,记录下交易细节方便系统的否定之否定反馈升级。陈安之:失败绝不是成功之母,只有检讨才是成功之母,失败的人缺乏检讨他还会继续失败。安东尼罗宾:假如一年中每个月你给自己一次检讨的机会,你一年有12次修正错误的机会;假如你每天给自己一次检讨的机会,那么一年你有365次检讨的机会;假如你每天早晚各检讨一次,你一年有700多次修正错误的机会;假如你吾日三省吾身,那么你一年有超过1000次修正错误的机会,你成功的几率增加了10000%!!!

____所以一定要把交易计划表和日志作为每日的常规项目去做,不管你起点有多低,不管你有多不灵光,愚者千虑必有一得,坚持实践,坚持反省修正,再差的系统经过N轮进化以后都会无限接近真理,坚持理论实践相结合,理论指导实践实践反馈修正理论,否定之否定螺旋上升,真理必将出现。这样一看,跟图片日志和计划表功能比起来画线部分尽管功能强大也不过是小技尔。实际上成功的路径前人早就讲清楚了,不论是荀子劝学篇还是马克思主义毛泽东思想都是如出一辙。顺逆、时节、法度、常戒。辨趋势,别顺逆,待天时,制关节,知变通,有法度,常自省,守戒律。最后用诸葛亮兵法《将苑》里的语句来阐述上述四个方面。

【顺逆】《将苑 智用篇》夫为将之道必顺天因时依人以立胜也。故天作时不作而人作是谓逆时,时作天不作而人作是谓逆天,天作时作而人不作是谓逆人。智者不逆天,亦不逆时,亦不逆人也。

【时节】《将苑 机形篇》夫以愚克智逆也,以智克愚顺也,以智克智机也。其道有三:一曰事二曰势三曰情。事机作而不能应非智也,势机动而不能制非贤也,情机发而不能行非勇也。善将者必因机而立胜

【法度】《将苑 将刚篇》善将者其刚不可折其柔不可卷,故以弱制强以柔制刚。纯柔纯弱其势必削,纯刚纯强其势必亡。不柔不刚合道之常

【常戒】《将苑 谨候篇》夫败军丧师未有不因轻敌而致祸者,故师出以律,失律则凶


推荐产品
TPSpro CopyOrders
Roman Podpora
5 (1)
This copier was originally developed for the professional order management of a team of traders and therefore, first of all, a risk manager was built into it. For simple operation, you need to configure the following settings: For the master! 1. Select the program type ''Program mode'' - master 2. Enter a new name for the ''Folder name'' folder, in which the EA will record information on working with orders. The name must be the same for both master and slave!!! 3. In the ''Feedback from
VPO Profile MT4
Kyra Nickaline Watson-gordon
5 (2)
Definition : VPO is a Volume Price Opportunity. Instead of using bars or candles with an Open, High, Low, and Close price, each "bar" in a Market Profile is represented by horizontal bars against the price It is called Market Profile terminology. In other words volume-price-opportunity (VPO) profiles are histograms of how many volumes were traded at each price within the span of the profile. By using a VPO chart, you are able to analyze the amount of trading activity, based on volume, for eac
Auto Trade Copier
Vu Trung Kien
4.71 (92)
自动交易复制器旨在以 100% 的准确度在多个 MT4/MT5 账户/终端之间复制交易。提供商和接收方账户必须位于同一台 PC/VPS 上。使用此工具,您可以将交易复制到同一台 PC/VPS 上的接收方账户。所有交易操作都将从提供商复制到接收方,不会有任何延迟。此版本仅适用于 MT4 账户。对于 MT5 账户,您必须使用 MT5 的自动交易复制器。参考: 参考: 对于 MT4 接收器,请下载“Trade Receiver Free” 这里 . 对于 MT5 接收器,请下载“Trade Receiver Free MT5”  这里 . 对于同一台 PC/VPS 上的 MT5 提供商,请检查“Auto Trade Copier MT5” 这里 . 如果您需要通过互联网在不同的 PC/VPS 上进行账户复制,请查看“Trade Copier Pro” 这里 . 如果您需要通过互联网在不同的 PC/VPS 账户之间进行复制,且接收方数量不限,请查看“无限交易复制器专业版” 这里 . 以下是重点功能 在 MT4 和 MT5 账户之间复制。 一个提供商可以将交易复制到多个接收者的账户。 一
Quantum Volume Point of Control Indicator
QUANTUM TRADING SOFTWARE LIMITED
5 (2)
The Quantum VPOC indicator has been developed to expand the two dimensional study of volume and price, to a three dimensional one which embraces time. The volume/price/time relationship then provides real insight to the inner workings of the market and the heartbeat of sentiment and risk which drives the price action accordingly. The Quantum VPOC indicator displays several key pieces of information on the chart as follows: Volume Profile - this appears as a histogram of volume on the vertical pr
用於自動訂單和風險管理的實用程序。讓您從利潤中獲得最大收益並限制您的損失。由執業交易員為交易員創建。該實用程序易於使用,適用於交易者手動打開的任何市場訂單或在顧問的幫助下。可以按幻數過濾交易。該實用程序可以同時處理任意數量的訂單。 具有以下功能: 1. 設置止損和止盈水平; 2. 通過追踪止損位平倉; 3. 設定盈虧平衡水平。 該實用程序可以: 1. 分別處理每個訂單(為每個訂單單獨設置級別) 2. 處理一籃子單向訂單(所有訂單的水平設置相同,買入和賣出分開) 3. 處理一籃子多向訂單(所有訂單的級別都設置為通用的,BUY 和 SELL 一起) 選項: STOPLOSS - 如果不使用 =-1,則以點為單位止損; TAKEPROFIT - 以點為單位獲利,不與 -1 一起使用; TRAILING_STOP - 價格變動的點數,如果不使用 =-1; TRAILING_STEP - 每一步利潤將增加的點數; BREAKEVEN_STOP - 將訂單轉移到盈虧平衡點的點數,如果不使用 =-1; BREAKEVEN_ST
PZ Trend Trading
PZ TRADING SLU
4.8 (5)
许多盈利交易者不仅知道如何识别市场趋势,而且也能把握趋势建立后的交易机会。 Pz 趋势交易 指标设计用来在趋势行情中尽可能的赚取利润。 已建立的趋势提供了一揽子交易机会,但大多数趋势交易指标完全忽视了它们,让交易者在趋势行情时完全不知道该如何做!一般趋势指标只通知有关的趋势变化,但根本不足以得到卓越的回报. Pz 趋势交易 指标比一般趋势指标显示多达 20 倍的交易 , 因为它注重所谓的市场时机。它不仅显示当前的市场趋势,也有回调,内柱线的突破和调整。它令您在趋势回调之后介入,安全的柱线内突破金字塔加仓,以及发现潜在的反转,和已知的调整。 趋势改变 一个趋势改变在市场方向变化时发生。趋势变化在图表上用带数字的彩色圆圈显示。蓝色 (1) 信号为上涨开始, 而红色 (1) 信号为下跌开始。趋势变化并非评估当前价格动作的结果, 它意味着交易设置是不定时地。如果您正确使用本指标, 在趋势变化时, 您将将已经入场 (参看下面的调整)。 回调 但凡趋势在运动中,行情上下抖动,盈利者收割利润,且其它参与者入场。趋势回调代表好的买入机会,通常是由主力获利离场导致。如果行情在回调后回归上行, 指
PipFinite Razor Scalper
Karlo Wilson Vendiola
4.44 (50)
Pipfinite creates unique, high quality and affordable trading tools. Our tools may or may not work for you, so we strongly suggest to try the Demo Version for MT4 first. Please test the indicator prior to purchasing to determine if it works for you. We want your good reviews, so hurry up and test it for free...we hope you will find it useful. Combo Razor Scalper with Trend Laser Strategy: Scalp in the direction of the trend Watch Video: (Click Here) Features Scalping indicator using a confir
Blahtech Market Profile
Blahtech Limited
4.61 (18)
Was: $249  Now: $99   Market Profile defines a number of day types that can help the trader to determine market behaviour. A key feature is the Value Area, representing the range of price action where 70% of trading took place. Understanding the Value Area can give traders valuable insight into market direction and establish the higher odds trade. It is an excellent addition to any system you may be using. Blahtech Limited presents their Market Profile indicator for the MetaTrader community. Ins
Fast Trade Copier
Vladimir Gribachev
4.2 (5)
The trade copier is designed for a fast and accurate copying of orders between the MetaTrader 4 terminals. The trade copier copies trades from the Master account to the Slave account by writing information to the total file, which is located in the common directory of the MetaTrader 4 terminals. This allows the trade copier to either customize various schemes for receiving and transmitting trade signals by changing the file name. Reading and writing the copier file is performed by timer. The tra
KopierMaschine - локальный копировщик сделок между различными счетами MetaTrader 4 и MetaTrader 5 в любом направлении расположенных на одном компьютере с интуитивно понятным интерфейсом. Направления копирования: MT4 --> MT5 MT4 --> MT4 MT5 --> MT5 MT5 --> MT4 для копирования между терминалами MetaTrader 4 и MetaTrader   5 необходимо приобрести версию продукта KopierMaschine  для  MetaTrader   5 Особенности Программа работает в двух режимах Master и Slave На один подчиненный счет можно копирова
Master scalping M1
Nataliia Marchuk
Master Scalping M1 is an innovative indicator that uses an algorithm to quickly and accurately determine the trend.The indicator calculates the time of opening and closing positions, the indicator's algorithms allow you to find the ideal moments to enter a deal (buy or sell an asset), which increase the success of transactions for most traders. Benefits of the indicator: Easy to assemble, does not overload the chart with unnecessary information. Can be used as a filter for any strategy. Works on
Trade with Gann on your side!! MASTER CIRCLE 360 CIRCLE CHART, originally created by Gann admitted that this is “The Mother of all charts”. It is one of the last studies that this great trader left for us. The numeric tab le is apparently quite simple like all the tables and is based on square numbers, the SQUARE OF 12 and is by evolution, one of the most important square numbers. Here we can find CYCLE, PRICE AND TIME thanks to angles and grades, to show past and future support and resistance.
PipFinite Energy Beam
Karlo Wilson Vendiola
3.94 (17)
Pipfinite creates unique, high quality and affordable trading tools. Our tools may or may not work for you, so we strongly suggest to try the Demo Version for MT4 first. Please test the indicator prior to purchasing to determine if it works for you. We want your good reviews, so hurry up and test it for free...we hope you will find it useful. Combo Energy Beam with Swing Control Strategy: Confirm swing pullback signals Watch Video: (Click Here) Energy Beam with Trend Laser Strategy: Confirm Tr
Account Fund Income Trend Line Indicator 1. This indicator is used to automatically draw a curve and a histogram of the profit amount of the trading order that has been closed in the current account and the account balance after the position,and the three data of the transaction volume, which is applicable to all cycles of the chart.2. The three data can be exported into CSV files by date, which is convenient for data analysis of third-party software.  3. The indicator contains an external para
Infinity Trend Pro
Yaroslav Varankin
1 (1)
This is a trend indicator without redrawing Developed instead of the binary options strategy (by the color of the Martingale candlestick) Also works well in forex trading When to open trades (binary options) A signal will appear in the place with a candle signaling the current candle It is recommended to open a deal for one candle of the current timeframe M1 and M5 When a blue dot appears, open a deal up When a red dot appears, open a trade down. How to open trades on Forex. When a signal is rec
Trendiness Index
Libertas LLC
5 (3)
"The trend is your friend" is one of the best known sayings in investing, because capturing large trendy price movements can be extremely profitable. However, trading with the trend is often easier said than done, because many indicators are based on price reversals not trends. These aren't very effective at identifying trendy periods, or predicting whether trends will continue. We developed the Trendiness Index to help address this problem by indicating the strength and direction of price trend
MT4/5通用交易库(  一份代码通用4和5 ) #ifdef __MQL5__      #define KOD_TICKET ulong      #define KOD_MAGIC   long #else        #define KOD_TICKET long      #define KOD_MAGIC   int #endif class ODLIST; #import "K Trade Lib Pro 4.ex4"       //祝有个美好开始,运行首行加入    void StartGood() ;    //简单开单    long OrderOpen( int type, double volume, int magic, string symbol= "" , string comment= "" , double opprice= 0 , double sl= 0 , double tp= 0 , int expiration= 0 , bool slsetmode= false , bool tpsetmode= false );    //复杂开单
Noize Absorption Index MT4
Ekaterina Saltykova
5 (1)
Noize Absorption Index - is the manual trading system that measures the difference of pressure between bears forces and bulls forces. Green line - is a noize free index that showing curent situation. Zero value of index shows totally choppy/flat market.Values above zero level shows how powerfull bullish wave is and values below zero measures bearish forces.Up arrow appears on bearish market when it's ready to reverse, dn arrow appears on weak bullish market, as a result of reverse expectation. S
Matrixs
Andriy Sydoruk
Matrix is a Forex arrow indicator. Displays signals simply and clearly! The arrows show the direction of the transaction, and are colored accordingly, which can be seen in the screenshots. As you can see, trading with such an indicator is easy. I waited for an arrow to appear in the desired direction - I opened a deal. An arrow formed in the opposite direction - closed the deal. The indicator also displays the lines with the help of which the arrow signals are formed, taking into account the int
斐波那契折返和扩展画线工具 适用于MT4平台的斐波那契折返和扩展画线工具,适合于使用黄金分割交易的交易者 优点:没有多余的线,没有过长的线,易于观察发现交易的机会 试用版: https://www.mql5.com/zh/market/product/35884 主要功能: 1.可以直接画出多组斐波那契折返,可以看出重要折返点之间的关系; 2.可以画出斐波那契扩展,比率有三种0.618,1,1.618 3.画出的斐波那契折返和扩展均可左右移动,有数值显示,方便观察 4.可通过数字键切换周期 使用指南和功能键: 1.按 [ 或R画折返,按需要画折返,最多云持8组折返; 2.按 ] 或E画扩展; 3.按 \ 删除当前周期下的所有扩展和折返,其余周期的不受影响 4.如何左右移动折返和扩展 (1)点击第一组折返的F5字符,可以左右移动折返; (2)点击COP的字符 ,可以左右移动扩展; 5. (1)点击第一组折返的F5字符,按del 可以删除这组折返; (2)点击COP的字符, 按del 可以删除这组扩展; 6.修改折返和扩展(随着市场的运行
A "Volume Profile" is an advanced charting indicator that displays total volume traded at every price level over a user specified time period. The main components of the volume profile are POC ( Point Of Control - the price level, at which the maximum number of contracts were executed during a selected period), VAH ( Value Area High - the highest price in the Value Area) and VAL ( Value Area Low - the lowest price in the Value Area). When we settled on the original indicator, we spent a lot o
TWO PAIRS SQUARE HEDGE METER INDICATOR Try this brilliant 2 pairs square indicator It draws a square wave of the relation between your two inputs symbols when square wave indicates -1 then it is very great opportunity to SELL pair1 and BUY Pair2 when square wave indicates +1 then it is very great opportunity to BUY pair1 and SELL Pair2 the inputs are : 2 pairs of symbols         then index value : i use 20 for M30 charts ( you can try other values : 40/50 for M15 , : 30 for M30 , : 10 for H1 ,
Gann Square of 144
Taras Slobodyanik
4.33 (6)
江恩箱(或江恩方)是一种基于 W.D. Gann 的“市场预测的数学公式”文章的市场分析方法。 该指标可以绘制三种正方形模型:90、52(104)、144。有六种网格变体和两种弧形变体。 您可以在一张图表上同时绘制多个方块。 参数 Square — 选择方形模型: 90 — 90 的平方(或 9 的平方); 52 (104) — 52(或 104)的平方; 144 — 144的万能平方; 144 (full) — 正方形的“完整”版本,结合了其他正方形的线条。 据我们所知,W.D.江恩并没有这样的加价; for Arcs — 圆弧的简化正方形; Grid — 网格的变体: 4x4 (52) — 4 x 4 网格,52 个标记; 5x5 (40); 8x8 (90); 8x8 (104); 8x8 (144); 16x16 (144); 36x36 (144); disable — 禁用网格; Arcs — 弧线的变体: 4x4; 5x5; disable — 禁用弧; 开始时的方形参数: Length of Square, Bars (X-axis) — 正方形的长度(以条
Indicator function Buy and sell according to the index color change It is best to use 1H for testing   About update questions In order to be more suitable for market fluctuations, the company regularly updates the indicators   Product cycle and trading time applicable to indicators Applicable mainstream currency pair EUR/USD GBP/USD NZD/USD AUD/USD USD/JPY USD/CAD USD/CHF Applicable mainstream cross currency pair EUR/JPY EUR/GBP EUR/CHF EUR/CAD EUR/NZD AUD/CAD AUD/NZD AUD/CHF AUD/JPY GBP/JPY GB
Scalping Sakurai
Volodymyr Zubov
Scalper indicator designed for accurate entry into trade transactions. Designed for intraday and medium-term trading on any instrument. The indicator does not redraw and does not lag. There is a possibility of visual and sound notification of the appearance of a signal to enter. The indicator also sends signals to digital buffers, which makes it possible to create automated trading systems based on it.
Currency Power Meter
Vu Trung Kien
4.74 (19)
Currency Power Meter shows the power of major currencies against each other. The indicator shows the relative strength of currency/pair at the current moment in a period of time (H4, daily, weekly, monthly). It is useful for day traders, swing traders and position traders with suitable period options. Currency power is the true reason of market trend: The strongest currency against the weakest currency will combine into a most trending pair. As we know, trend makes money and all traders love tre
EZT Trade History This is a great tool to analyze past trades or follow current ongoing trades, especially when you using an EA to manage your transactions. You will see the exact candle where the trade was opened and closed. Collapsible floating panel on the chart, free to move anywhere with your mouse. When you using multiple EA’s with different magic numbers, you have 5 options to separate those trades, so you will know which EA opened specific transactions. You can set the day limits how fa
Signal Strength Meter
Naim El Hajj
4.17 (6)
The Signal Strength Meter is a Multi-Currency, Dual Timeframe Interactive Indicator, which calculates the strength of buy and sell signals, and displays a score for each symbol on a display board. Get a 7-Day Free Trial Version:  Click  Here  (Full Access to The Indicator for 7 Days) Check Video Below For Complete Demonstration, and User Manual here . Key Features: Allows you to see multiple currency signals from one chart Analyses the signals from more than a dozen classic indicators Identi
Indicator function This index buys and sells according to the color, using time is one hour,Please run the test on a 30-minute cycle It is best to use 1H for testing   About update questions In order to be more suitable for market fluctuations, the company regularly updates the indicators   Product cycle and trading time applicable to indicators Applicable mainstream currency pair EUR/USD GBP/USD NZD/USD AUD/USD USD/JPY USD/CAD USD/CHF Applicable mainstream cross currency pair EUR/JPY EUR/GBP E
History Pattern Search
Yevhenii Levchenko
该指标建立当前报价,可以与历史报价进行比较,并在此基础上进行价格走势预测。指示器有一个文本字段,用于快速导航到所需日期。 选项: 符号 - 选择指标将显示的符号; SymbolPeriod - 选择指标从中获取数据的时段; IndicatorColor - 指示器颜色; HorisontalShift - 由指标绘制的报价移动指定的柱数; Inverse - true 反转引号,false - 原始视图; ChartVerticalShiftStep - 图表垂直移动(键盘上的向上/向下箭头); 接下来是文本字段的设置,您可以在其中输入日期,您可以通过按“回车”立即跳转到该日期。 接下来是文本字段的设置,您可以在其中输入日期,您可以通过按“回车”立即跳转到该日期。
该产品的买家也购买
TPSpro RFI Levels
Roman Podpora
4.85 (20)
Reversal First Impulse levels (RFI)    INSTRUCTIONS        RUS       -       ENG              R ecommended to use with an indicator   -   TREND PRO -  Version MT5 A key element in trading is zones or levels from which decisions to buy or sell a trading instrument are made. Despite attempts by major players to conceal their presence in the market, they inevitably leave traces. Our task was to learn how to identify these traces and interpret them correctly. Main functions: Displaying active zones
Atomic Analyst
Issam Kassas
5 (3)
首先值得强调的是,该交易指标是非重绘、非延迟的指标,这使其成为手动和机器人交易的理想选择。 用户手册:设置、输入和策略。 Atomic Analyst是一种PA价格行动指标,利用价格的力量和动量来寻找市场上更好的机会。配备了高级过滤器,可帮助去除噪音和假信号,并提高交易潜力。使用多层复杂的指标,Atomic Analyst扫描图表,并将复杂的数学计算转化为任何初学者都能理解并用来做出一致交易决策的简单信号和颜色。 “Atomic Analyst”是专为新手和经验丰富的交易者量身定制的综合交易解决方案。它将高级指标和一流功能融合为一体的交易策略,使其成为所有类型交易者的多功能选择。 日内交易和剥头皮策略:专为快速准确的日内交易和短期交易而设计。 日内和摆动交易策略:可用作追求价格大幅波动的日内和摆动交易者的可靠工具。 多货币和市场:凭借其可靠的精度,在不同的工具和市场上运作。 多个时间框架:可在多个时间框架上使用,性能良好。 稳定性:所有指标均不重绘、不重绘和不滞后,确保可靠的信号。 信号清晰度:提供箭头信号,用于清晰的入场和出场点。 实时警报:通过交易入场、SL和TP警报通知交
TPSproTREND PrO
Roman Podpora
4.78 (18)
TPSpro TRENDPRO  - is a trend indicator that automatically analyzes the market and provides information about the trend and each of its changes, as well as giving signals for entering trades without redrawing! The indicator uses each candle, analyzing them separately. referring to different impulses - up or down impulse. Exact entry points into transactions for currencies, crypto, metals, stocks, indices!  -  Version MT5               DETAILED DESCRIPTION                R ecommended to use with
Scalper Inside PRO
Alexey Minkov
4.74 (58)
An exclusive indicator that utilizes an innovative algorithm to swiftly and accurately determine the market trend. The indicator automatically calculates opening, closing, and profit levels, providing detailed trading statistics. With these features, you can choose the most appropriate trading instrument for the current market conditions. Additionally, you can easily integrate your own arrow indicators into Scalper Inside Pro to quickly evaluate their statistics and profitability. Scalper Inside
目前八折优惠! 对任何新手或专家交易者来说都是最好的解决方案! 这个仪表板软件适用于28种货币对。它基于我们的两个主要指标(高级货币强度28和高级货币冲动)。它对整个外汇市场提供了一个伟大的概述。它显示高级货币强度值,货币运动速度和28个外汇对在所有(9)时间段的信号。想象一下,当你可以使用图表上的单一指标观察整个市场,以确定趋势和或剥头皮的机会时,你的交易将得到改善 我们已经在这个指标中建立了一些功能,使你更容易识别强势和弱势货币,同时识别和确认潜在的交易。该指标以图形方式显示货币的强势或弱势是增加还是减少,以及它在所有时间段的表现。 增加的新功能是动态市场斐波那契水平,它适应当前的市场条件变化,这是一个已经在我们的高级货币强度28和高级货币冲动指标中使用的成熟的加分项。 在交易时,总是将弱势货币和强势货币配对,这个新指标将帮助你做到这一点。 用户手册:点击这里  https://www.mql5.com/en/blogs/post/708783 特点  显示每个时间段的ACS28和GAP-speed(冲动)的货币强度值。 列:颜色代码以7种颜色
FX Volume
Daniel Stein
4.6 (35)
通过 mql5 和 Telegram 上 的 " 晨间简报 "获取每日市场更新,包括详细信息和屏幕截图 ! 外汇交易量(FX Volume)是第一个也是唯一一个从经纪商角度真正洞察市场情绪的交易量指标。 直接在您的图表上看到这些信息是真正改变游戏规则和突破性的交易解决方案。 受益于独特的市场数据洞察,如 比率(Ratios )显示货币多头和空头头寸的比率(百分比 比率变化 显示所选时间段内的多头比率及其百分比变化 总交易量 显示货币的总交易量(多头和空头),以手为单位 多头 交易量显示货币所有多头头寸的交易量 空头 交易量显示所有货币空头头寸的交易量 净多头 显示净多头交易量,即所有多头头寸减去所有空头头寸(以手为单位)。 净多头百分比 显示货币净多头交易量的变化 请阅读我们的基本教程 -> "如何使用外汇交易量进行交易 " 获取更多信息,如常见问题、交易技巧和教程视频,请访问我们的 外汇交易量公共信息频道 请 安装并运行 SI Connect 以建立与我们数据中心的持续连接 背景信息 我们都知道,外汇是一个分散的市场。这就是为什么我们必须打破常规思维,开发一个独
Enigmera
Ivan Stefanov
5 (3)
ENIGMERA:市场核心 https://www.enigmera.com 简介 该指标和交易系统是金融市场的一种非凡方法。ENIGMERA 利用分形周期精确计算支撑位和阻力位。它能显示真实的累积阶段,并给出方向和目标。 该系统无论在趋势中还是在修正中都能发挥作用。 它是如何运行的? ENIGMERA 由三条线组成:支撑/阻力线、目标线和偏离线。与一般市场指标将过去的数据推断为现在和未来的情况不同,该系统能提供当前的完整情况。如果你处于支撑位,这意味着真正的支撑;如果你处于阻力位,这意味着真正的阻力。如果突破某一水平,则表示趋势发生变化。没有重绘。 由于市场在不断变化,ENIGMERA 不断调整其评估工具,定期修改策略。  这保证了每种情况都能得到全面评估。这一市场指标的独特性显而易见,其能力不言而喻。  ENIGMERA 为金融分析师和咨询师提供服务,他们需要可靠的见解与客户分享,也为投资者提供服务,他们需要最精确和最可靠的保证。 该系统能够达到最佳精度,使交易者能够自信、清晰地评估他们的选择。 ENIGMERA 将 20 年的交易专长和知识整合到一个综合软件
GOLD Impulse with Alert
Bernhard Schweigert
4.56 (9)
这个指标是我们2个产品 Advanced Currency IMPULSE with ALERT  +   Currency Strength Exotics 的一个超级组合。 它适用于所有时间框架,并以图形方式显示8种主要货币和一种符号的强势或弱势冲动! 该指标专门用于显示任何符号的货币强度加速,如黄金、异国货币对、商品、指数或期货。这是它的第一个指标,任何符号都可以被添加到第9行,以显示黄金、白银、石油、DAX、US30、MXN、TRY、CNH等的真实货币强度加速(冲动或速度)。 建立在新的基础算法上,它使识别和确认潜在的交易更加容易。这是因为它以图形方式显示了一种货币的强势或弱势是否正在加速,并测量了这种加速的速度--把它想象成你汽车中的速度表。当你加速时,事情显然会发生得更快,这在外汇市场上也是一样的,即如果你配对的货币正在向相反的方向加速,你就会发现一个潜在的有利可图的交易。 动态市场斐波那契28水平被用作警报触发器,将适应市场活动。如果冲动击中黄色触发线,你将收到警报。然后你就知道作为一个交易员应该做什么。货币对和方向已经给出。只需点击警报按钮,就可以
ON Trade Optuma Astro
Abdullah Alrai
5 (4)
当然可以!以下是您提供的文本的中文翻译: 引入 MT4 天文指标:您的终极天体交易伙伴 您准备好将交易体验提升到天文高度了吗?不用再寻找,就在我们的革命性 MT4 天文指标中。这个创新工具超越了传统的交易指标,利用复杂的算法提供无与伦比的天文洞察力和精确计算。 指尖上的宇宙信息: 瞻仰一个详尽的面板,展示了一宝藏般的天文数据。了解行星的地理/太阳心坐标,太阳/地球距离,亮度,伸长度,星座,黄道和赤道坐标,甚至是水平坐标——每个细节都经过精心计算并呈现得美轮美奂。指标生成的垂直线对应于时间值,为您的交易旅程提供了宇宙的视角。 行星线条与关系: 在您的图表上欣赏行星线条的魔力,具有可自定义的比例和角度。通过直观的控制面板轻松切换每个行星线条的可见性。通过连结、六分、四分、三分、对冲和逆行等指标,发现行星关系的艺术。在您选择的时间范围内探索这些宇宙构造,使您能够识别重要的交易机会。 揭示甘恩的智慧: 通过受甘恩启发的平方垂直线揭示潜在的反转时机。这种创新修改将甘恩历经考验的原则带入现实,帮助您提前了解市场的转向和趋势。 月亮引导: 在您的图表上优雅地导航月相,因为新月和满月点缀其间。月亮周期
Please send me Direct message on MQL5 CHAT after purchasing the Indicator for Training and Installation Support There are some additional files that is important to use with the Indicator . So be sure to contact me after purchasing the Indicator So that I can add you for training and support . If you find any difficulty with installation then send me Direct message here So that I can connect with you via Anydesk or Teamview for the product installation. " Smart Order Block Indicator " to find
Currency Strength Exotics
Bernhard Schweigert
4.88 (33)
目前8折优惠! 对任何新手或专家交易者来说都是最好的解决方案! 这个指标是专门用来显示任何符号的货币强度,如异国货币对、商品、指数或期货。它是同类产品中的第一个,任何符号都可以添加到第9行,以显示黄金、白银、石油、DAX、US30、MXN、TRY、CNH等的真实货币强度。这是一个独特的、高质量的、负担得起的交易工具,因为我们已经纳入了一些专有的功能和一个新的公式。想象一下,你的交易将如何改善,因为你能够准确地确定新趋势或剥头皮机会的触发点? 用户手册:点击这里   https://www.mql5.com/en/blogs/post/708876 它适用于所有时间框架。你将很快能够看到TREND! 根据新的基础算法设计,它使识别和确认潜在交易变得更加容易。这是因为它以图形方式显示了8种主要货币和一种符号的强弱。 该指标显示了8种主要货币(澳元加元瑞士法郎欧元英镑日元新西兰美元)的强弱线,再加上一个符号! 该指标显示了符号的真实价值。例如:对于XAUUSD(黄金):价格以美元报价。如果黄金在上涨,你怎么能知道是黄金的强势还是美元的弱势?只有当黄金走强时,我们才会进行
ECM Channel MT4
Paulo Rocha
5 (1)
ECM Elite Channel is a volatility-based indicator, developed with a specific time algorithm, which consists of finding possible corrections in the market. This indicator shows two outer lines, an inner line (retracement line) and an arrow sign, where the channel theory is to help identify overbought and oversold conditions in the market. The market price will generally fall between the boundaries of the channel. If prices touch or move outside the channel, it's a trading opportunity. The
Indicator : RealValueIndicator Description : RealValueIndicator is a powerful tool designed specifically for trading on the EURUSD pair. This indicator analyzes all EUR and USD pairs, calculates their real currency strength values, and displays them as a single realistic value to give you a head start on price. This indicator will tell you moves before they happen if you use it right. RealValueIndicator allows you to get a quick and accurate overview of the EURUSD currency pair tops and bottoms,
Introduction to X3 Chart Pattern Scanner X3 Cherart Pattern Scanner is the non-repainting and non-lagging indicator detecting X3 chart patterns including Harmonic pattern, Elliott Wave pattern, X3 patterns, and Japanese Candlestick patterns. Historical patterns match with signal patterns. Hence, you can readily develop the solid trading strategy in your chart. More importantly, this superb pattern scanner can detect the optimal pattern of its kind. In addition, you can switch on and off individu
TrendMaestro
Stefano Frisetti
5 (3)
note: this indicator is for METATRADER4, if you want the version for METATRADER5 this is the link:  https://www.mql5.com/it/market/product/108106 TRENDMAESTRO ver 2.4 TRENDMAESTRO recognizes a new TREND in the bud, he never makes mistakes. The certainty of identifying a new TREND is priceless. DESCRIPTION TRENDMAESTRO identifies a new TREND in the bud, this indicator examines the volatility, volumes and momentum to identify the moment in which there is an explosion of one or more of these data a
XQ Indicator MetaTrader 4
Marzena Maria Szmit
3.67 (3)
Step into the realm of Forex trading with confidence and precision using XQ, a cutting-edge Forex indicator designed to elevate your trading game to unprecedented heights. Whether you're a seasoned trader or just stepping into the world of currency exchange,   XQ Forex Indicator   empowers you with the insights and signals needed to make informed trading decisions. The signal conditions are a combination of three indicators, and XQ Forex Indicator only display  medium and long-term trends . The
Quantum Trend Sniper Indicator MT4
Bogdan Ion Puscasu
4.6 (40)
介绍   量子趋势狙击指标 ,突破性的 MQL5 指标,正在改变您识别和交易趋势反转的方式!由拥有超过13年交易经验的资深交易员团队开发,     量子趋势狙击指标   旨在通过其创新的方式以极高的准确度识别趋势反转,将您的交易之旅推向新的高度。 ***购买量子趋势狙击指标,即可免费获得量子突破指标!*** 当量子突破指标识别出趋势反转时,它会向您发出警报和信号箭头,并建议您三个止盈水平。 它既适合新手交易者,也适合专业交易者。 量子 EA 通道:       点击这里 MT5版本:       点击这里 建议: 时间范围:  所有时间范围。为了获得最佳结果,我们建议在 M15、M30 和 H1 时间范围内使用它。 货币对:欧元兑美元、英镑兑美元、澳元兑美元、欧元兑英镑, EURAUD, XAUUSD 账户类型:ECN、Raw 或 Razor,点差极低 经纪时间:任意 经纪商:IC Markets、Pepperstone with Raw 和 Razor 的点差最低 建议止损:50 点 建议止盈水平:20 点、50 点和 1
Max Paynex
Abdulkarim Karazon
Max Payne 是一个反转/趋势信号指标,以箭头的形式给出信号,该指标在同一柱收盘时给出信号,该指标可以在图表上以不同周期多次下降,以获得信号的双重/三重确认 该指标具有高度可调性,可以适应任何交易风格,同时它不会重新绘制或背面绘制,购买后您将获得屏幕截图中显示的完整系统以及使用的模板。 ----------------- 如何交易: 等到您在同一柱上获得三次确认,同时趋势过滤器(购买后您将获得的佩恩趋势)与方向一致 开仓并将止损设置为买入交易的黄金箭头(模板)下方和卖出交易的黄金箭头(模板)上方,您的退出信号是第一个相反的白点信号(模板)。 ----------------- 参数 : 信号周期:箭头周期 滤波器:信号滤波器 距离:箭头距蜡烛的距离 计数柱:显示多少历史信号 警报 --------------------------------------
Gold Channel XAUUSD
Paulo Rocha
5 (2)
Gold Channel is a volatility-based indicator, developed with a specific timing algorithm for the XAUUSD pair, which consists of finding possible corrections in the market. This indicator shows two outer lines, an inner line (retracement line) and an arrow sign, where the theory of the channel is to help identify overbought and oversold conditions in the market. The market price will generally fall between the boundaries of the channel. If prices touch or move outside the channel it is a tra
SNR LEVEL INDICATOR Accurate Snr level indicator will only display Fresh Levels that are close to the Current Market Price. This indicator is very accurate in mapping Support & resistance levels. there is an alert feature when the price TOUCHES the SNR LEVEL, WHEN CLOSE CANDLE BREAK/REJECT SNR LEVEL. INDICATOR MARKING :: - SUPPORT LEVEL == V SHAPE - RESISTANCE LEVEL == APEX LEVEL - GAP RESISTANCE & GAP SUPPORT == OPEN CLOSE CANDLE - SUPPORT BECAME RESISTANCE & RESISTANCE BECAME SUPPORT INDIC
All in One Trade
Alexey Minkov
4.48 (27)
The All-in-One Trade Indicator (AOTI) determines daily targets for EURUSD, EURJPY, GBPUSD, USDCHF, EURGBP, EURCAD, EURAUD, AUDJPY, GBPAUD, GBPCAD, GBPCHF, GBPJPY, AUDUSD, and USDJPY. All other modules work with any trading instruments. The indicator includes various features, such as Double Channel trend direction, Price channel, MA Bands, Fibo levels, Climax Bar detection, and others. The AOTI indicator is based on several trading strategies, and created to simplify market analysis. All-in-One
Volatility Trend System - a trading system that gives signals for entries. The volatility system gives linear and point signals in the direction of the trend, as well as signals to exit it, without redrawing and delays. The trend indicator monitors the direction of the medium-term trend, shows the direction and its change. The signal indicator is based on changes in volatility and shows market entries. The indicator is equipped with several types of alerts. Can be applied to various trading
NAM Order Blocks
NAM TECH GROUP, CORP.
5 (1)
MT4多時限訂單塊檢測指示器。 特徵 -在圖表控制面板上完全可自定義,提供完整的交互。 -隨時隨地隱藏和顯示控制面板。 -在多個時間範圍內檢測OB。 -選擇要顯示的OB數量。 -不同的OB用戶界面。 -OB上的不同過濾器。 -OB接近警報。 -ADR高低線。 -通知服務(屏幕警報|推送通知)。 概括 訂單塊是一種市場行為,它指示從金融機構和銀行收取訂單。著名的金融機構和中央銀行帶動了外匯市場。因此,交易者必須知道他們在市場上正在做什麼。當市場建立訂單塊時,它會像發生大多數投資決策的範圍一樣移動。 訂單建立完成後,市場將朝著上升和縮小的方向發展。訂單大宗交易策略的關鍵術語是它包括機構交易者正在做的事情。由於它們是主要的價格驅動因素,因此包括機構交易在內的任何策略都可以。 您將在任何時間範圍內實時看到訂單塊,使用我們的控制面板,您將能夠在所選的歷史記錄週期內檢測常規,拒收和未大寫的訂單塊。 現在您可以接收到訂單塊接近警報,我們在MT4上顯示屏幕通知,並將通知推送到您的手機!
"The Squeeze indicator attempts to identify periods of consolidation in a market. In general the market is either in a period of quiet consolidation or vertical price discovery. By identifying these calm periods, we have a better opportunity of getting into trades with the potential for larger moves. Once a market enters into a "squeeze," we watch the overall market momentum to help forecast the market direction and await a release of market energy." Modified TTM Squeeze Indicator is a modifica
Entry Points Pro
Yury Orlov
4.7 (225)
这是一款 MT4 的趋势指标,可提供准确的入场交易信号,且无重绘或延迟。 它可应用在任何金融资产:外汇、加密货币、贵金属、股票、指数。 最好的结果出现在 M15+ 的时间帧内。 指标的 MT5 版本 重要! 购买后请联系我,以便获取详细指南和奖励。 视频 (6:22) - 一个信号赢取的利润等于指标价格的三倍。 视频 (4:44) - 它如何在测试器中工作,我的提示和技巧。 视频 (1:44) - 有关它如何处理加密货币和指数的几句话。 大多数交易者在 Entry Points Pro 指标的帮助下,在第一个交易周内就改善了他们的交易结果。 Entry Points Pro 指标的益处 入场信号无重绘或延迟 如果信号出现,并得到确认(如果信号所在烛条已收盘),则它不会再消失;不像是重绘指标,它会导致重大的财产损失,因为它们可以在显示信号后再将其删除。 无差错开仓 指标算法可令您找到入场交易(买入或卖出资产)的理想时机,从而提高每位交易者的成功率。 Entry Points Pro 可操作任何资产 它允许您在 MT4 平台上交易任何经纪商提供的加密货币、股票、
Gann Swing Structure
Kirill Borovskii
5 (1)
This indicator is based on the mathematics of the great trader W.D. Ganna. With its help, you can easily find strong levels by analyzing swings to find the optimal entry point. The indicator works on all instruments and all timeframes. The indicator is fully manual and has control buttons. All you need to do is press the NEW button, a segment will appear, which you can place on any movement, swing or even 1 candle that you want to analyze. By placing the segment, press the OK button. A grid (th
This indicator scans for you up to 30 trading instruments and up to 8 timeframes for occurrences of the high probability reversal patterns: Double Tops/Bottoms with fake breakouts . Please read also the blog post " Professional Trading With Double Tops/Bottoms And Divergences! " which explains the concepts behind the ULTIMATE Double Top/Bottom indicator and how you can use a professional top-down approach. You can get alerts via MetaTrader 4, email and push notifications at the moment when a sig
Quantum Breakout Indicator PRO
Bogdan Ion Puscasu
4.96 (26)
介绍     Quantum Breakout PRO   ,突破性的 MQL5 指标,正在改变您交易突破区域的方式!   Quantum Breakout PRO 由拥有超过 13 年交易经验的经验丰富的交易者团队开发,旨在通过其创新和动态的突破区域策略将您的交易之旅推向新的高度。 量子突破指标将为您提供带有 5 个利润目标区域的突破区域的信号箭头,以及基于突破框的止损建议。 它既适合新手交易者,也适合专业交易者。 量子 EA 通道:       点击这里 MT5版本:   点击这里 重要的!购买后请私信我领取安装手册。 建议: 时间范围:M15 货币对:GBPJPY、EURJPY、USDJPY、NZDUSD、XAUUSD 账户类型:ECN、Raw 或 Razor,点差极低 经纪商时间:GMT +3 经纪商:IC Markets、Pepperstone with Raw 和 Razor 的点差最低 规格: 不重漆! 最多 5 个建议利润目标区域 建议止损水平 可定制的盒子。您可以设置自己的 Box Time Start 和 Box Time E
Pair Trading Station MT4
Young Ho Seo
3.67 (3)
How to use Pair Trading Station Pair Trading Station is recommended for H1 time frame and you can use it for any currency pairs. To generate buy and sell signal, follow few steps below to apply Pair Trading Station to your MetaTrader terminal. When you load Pair Trading Station on your chart, Pair Trading station will assess available historical data in your MetaTrader platforms for each currency pair. On your chart, the amount of historical data available will be displayed for each currency pai
The indicator " ZigZag on Trend " is an assistant in determining the direction of price movement, as well as a calculator of bars and points. It consists of a trend indicator, which follows the price direction by the trend line presented in the form of a zigzag and a counter calculating the number of bars traversed in the direction of the trend and the number of points on the vertical scale. (calculations are carried out by the opening of the bar) The indicator does not redraw. For convenience,
作者的更多信息
注意️测试模式并不能完全正常运行 所以那个免费模拟是个摆设 和实际效果相差甚远 实际效果比GIF图片里面要流畅不存在卡顿和性能问题 十年前的i3都没有任何压力 如果需要测试可以下载MT4版进行测试,MT4版链接  https://www.mql5.com/zh/market/product/109093?source=Site+Market+My+Products+Page ____由于MT4的画线功能比较基础,迈达克官方也无意改进升级,但是后起之秀TradingView的出现极大拓展了画线分析部分的功能(当然TV的优势远不止于此),甚至国内的很多看盘软件的画线功能也比MT4原生的画线功能要强大。当然市面上传播的画线工具肯定也是有很多的包括五年前我写的一些相对简单的工具。但是现存的所有加起来也无法和便捷画线工具第三版相提并论,这是MT史上最强的画线工具没有之一,这是使用画线工具的朋友给出的评价。本工具初版5-6千行代码,经过一年的升级优化写到第三版已经超过2万行代码(当然空行大括号和注释的占比也不会很低估计在10-20%左右我的代码很规范 每一个变量都不会瞎命名也不会对只用
一、复合画线对象 (1)带箭头线段 (2)连续线段(折线) (3)平行四边形 (4)多边形 (5)盈亏比测量工具  二、画线过程中Z键回退 支持Z键回退的画线类型:连续线段、通道、平行四边形、多边形、斐波扩展。 三、 自动吸附 (1)画线开始之前单击锁定按钮切换自动吸附开关 (2)画线中可用快捷键Ctrl键切换自动吸附开关 四、水平向右延伸 画趋势线线段或者矩形时单击线型按钮或者快捷键C开关水平延伸。 五、画线显示周期 单击“多/单”按钮已及线型按钮设置单周期/全周期/指定周期显示。 六、画线停止 (1)原位置二次单击 (2)按钮单击 (3)右侧价格轴单击 (4)连续线段特殊处理 原位置单击停止不带箭头 单击右侧价格轴停止带箭头 单击按钮停止带 箭头 七、对象选中 单击对象选中,图表左上角显示选中对象信息并播放单击对象音频,对象锁定与否音效不同。 八、选中对象锁定解锁 单击锁定/解锁按钮。 九、对象复制 选中对象(趋势线和矩形)时单击“多/单”按钮复制,或者快捷键V复制。 十、选中对象删除 单击删除按钮删除。 十一、批量删
第一部分:特性 集成画线和波浪标记功能 画线过程中自动吸附(即自动搜索高/低) 同时绘制折线和斐波那契回调和 斐波那契扩展 计算区间跨度( 简称Qjt )的比率 通过单击连续删除对象 批量删除画线对象 显示/隐藏画线和波浪标记 快速将当前图表作为图片保存到本地某个文件夹 通过点击价格轴的特定区域或按热键W显示/隐藏主面板 按热键Q切换面板 自动隐藏主面板 通过点击 价格轴 的特定区域绘制价格检测范围 通过热键Z和X快速切换到上下周期 第二部分:绘图 (1) .画线类型 折线 Fibo 水平趋势线 区间线 时空网格 (2).设置线条颜色、样式和宽度 要设置线的颜色内置或样式和宽度,只需点击某些按钮 当按下第二行中间一个颜色按钮时,调出颜色选择面板设置自定义颜色 (3) .开始画线 如果你没有按下任何绘图类型按钮(HL/Rng/Net/Fibo),当你选择线条颜色按钮或线条样式按钮或线条宽度按钮时,它将默认绘制折线 当您正在绘制折线或区间线时,您可以按Fibo按钮,它将同时绘制 斐波那契回调和 斐波那契扩展 如果您想绘制可以精确定位 吸附 在最高价和最低价的画线,您可以在绘制时按下A
功能列表: 界面类型:常规模式和刷单模式; 交易量确定三个模式:绝对手数、风险金额和风险比率; 数字面板快速输入手数或风险金额; 固定盈亏比止损止盈线; 选中订单批量平仓或选中订单批量修改止损止盈; 单笔风险校验与总风险控制; 持仓移损保盈减仓等出场管理; 报警价格列表; 价格观测区; 搭配便捷画线指标3.65及以上版本实现组合配对画线开平; 支持中英文两种界面语言; 其他图表便捷操作。 出场管理模块注意事项: 盈利点数--三个级别要可以只启用一个或两个,但是数值顺序必须严格遵循递增顺序。 保盈点数和移损点数--只能设置其中一种,如果两者都设置会以保盈点数为准。 移损点数--如果要用某周期的N倍ATR替代可以用负数表示,例如-105表示M1周期5倍ATR  -205表示M5周期5倍ATR -305表示M15周期5倍ATR 移损点数--如果设置的-888则会以信号指标的指标线作为止损值(并非所有的信号指标都能作为移损指标) 减仓比例--如果设置的负数则会在达到盈利点数条件或者突破价格条件时直接减仓,而如果设置的是正数则会在信号指标出现信号以后才会减仓。 上破价格-- 三个级别要可以只
鹿希武趋势交易法专用波浪标记工具 0.主界面显示隐藏 单击最右侧价格轴右下角1/10处显示隐藏主界面,或者默认快捷键Q键显示隐藏主界面。 1.区间跨度查找 单击主浪高点或低点自动查找区间跨度,如果存在内外区间重叠单击按钮<<或>>进行左右调整,或者完成后手动拖拽调整。如果存在失败浪,可以在展开面板的情况下,用系统自带趋势线画区间跨度。带区间跨度的趋势线会自动保持水平,删除对应的区间跨度文本可以使其不自动恢复水平。 2.区间级别计算 单击Rate按钮选择计算区域,必须包含住选中区间跨度标记,自动计算区间级别关系。 3.波浪三级别标记 标记过程中支持Z键回退,同位置单击两次结束标记,或者单击Stop按钮停止标记,或者单击最右侧价格轴停止标记。 4.快捷切换上下周期 默认Z键切换小一级周期,X键切换大一级周期。 5.对象连续删除 默认T键开启/关闭连续删除模式,在连续删除模式下,单击需要删除的对象即可快捷删除该对象,可通过单击中心“连续删除”文字关闭连续删除模式也可通过T键结束连续删除模式。 6.清除标记 默认C键清除所有标记对象。
筛选:
无评论
回复评论
版本 3.88 2024.06.02
大幅更新