Italo Triangle Indicator MT5
- 指标
- Italo Santana Gomes
- 版本: 1.0
- 激活: 5
BUY INDICATOR AND GET EA FOR FREE AS A BONUS + SOME OTHER GIFTS!
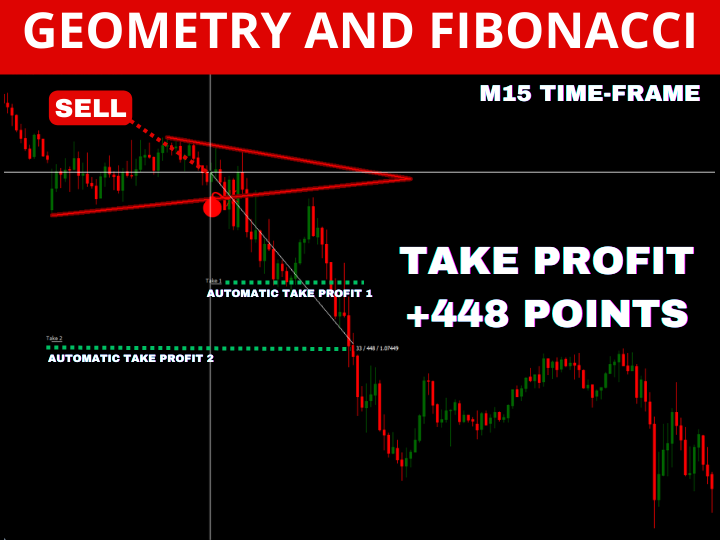
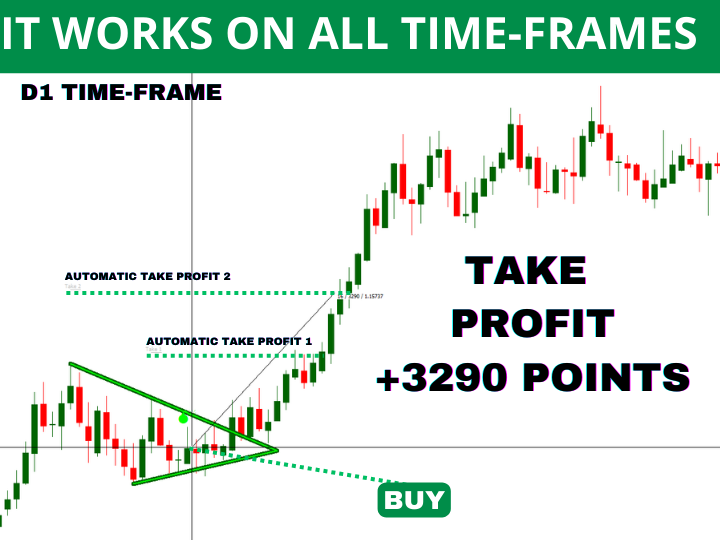
ITALO TRIANGLE INDICATOR is the best triangle indicator ever created, and why is that? Using Geometry and Fibonacci the Indicator works on all time-frames and assets, indicator built after 7 years of experience on forex and many other markets. You know many triangle indicators around the internet are not complete, does not help, and it's difficult to trade, but the Italo Triangle Indicator is different, the Italo Triangle Indicator shows strong buy, sell and neutral triangles, showing the pattern when market is going to trend and in which Fibonacci levels the market is going to go for you to take profit safely, all of that in one simple and clear Indicator!
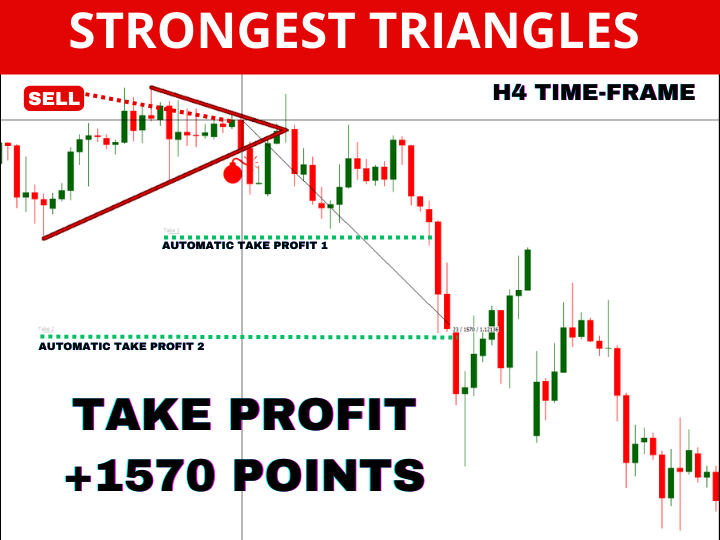
Italo Triangle Indicator is profitable and stable, and it will show you the real trends and breakouts, using geometry and objective Fibonacci to search for the best triangles on the chart, take profit levels and filter out all bad signals. The Italo Triangle Indicator has an Edge over the market, this means you will predict where the next trend It's going to be with the highest probability every single time.
You will have on your hands a predictor of market movement in a very precise way.
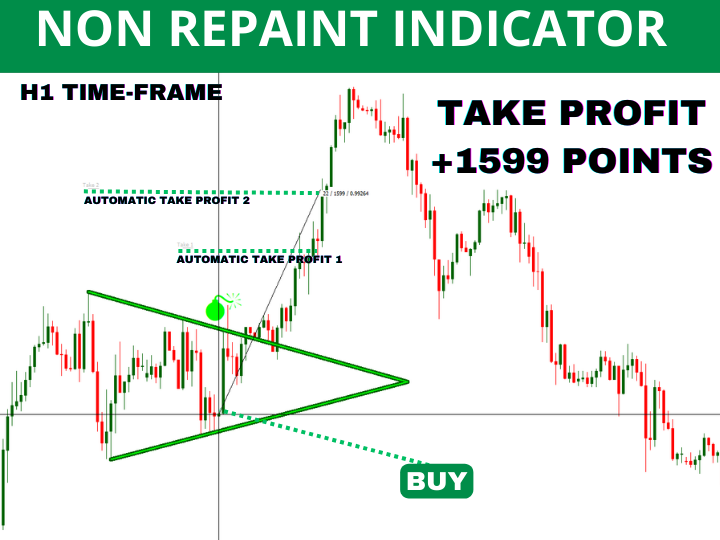
The Indicator does not repaint, the Italo Triangle Indicator was made to make you a successful trader.
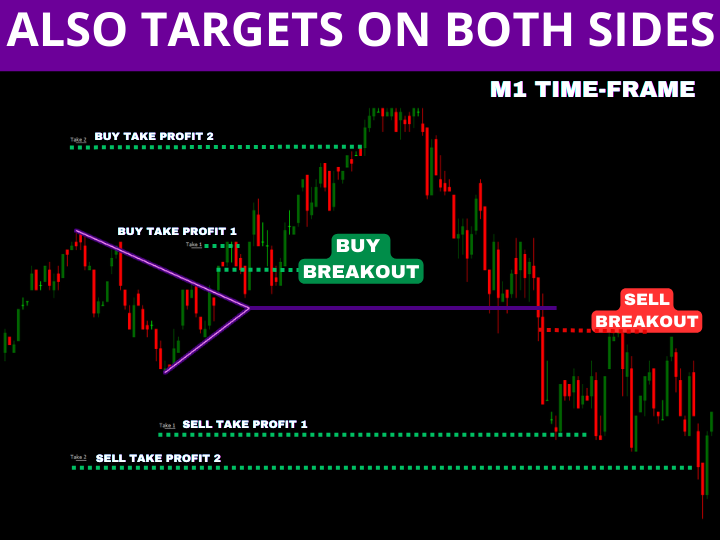
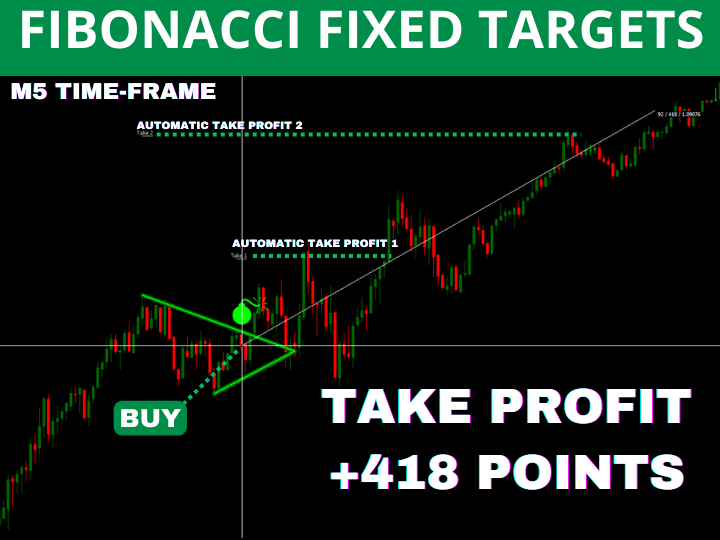
The Indicator shows on the mode "Bullish and Bearish" a green or red triangle pattern with a signal showing the pattern is complete and the market is going to move strongly after that, you will see the "Take 1" and "Take 2" already place on the chart, those are take profits based on objective Fibonacci with a high probability of being touched. On the mode "Neutral Pattern" you will have the option to see a purple triangle pattern where you can trade both sides, with "Take 1" and "Take 2" above and bellow the triangle. You can trade immediately after the signal or wait for a triangle breakout to serving as a confirmation to enter the market.
Now you have the perfect triangle indicator, you will see and trade with confidence since you know in front of you is the best objective triangle pattern tool to enter the market, with take profits based on Fibonacci, with this combination you have more probability than any other trader on the market to predict its movement and achieve what you want!
MT4 Version: https://www.mql5.com/en/market/product/108728
IMPORTANT! Contact me after the purchase to get the bonuses!
Benefits of Italo Triangle Indicator
- Unique Algorithm that uses Geometry and Objective Fibonacci
- Predict Trends and Breakouts
- Filter False Signals
- Show the strongest triangles for buy and sell with two take profit levels at the same time
- Time-frames: All
- Assets: All
- Easy to use, does not overload charts with unnecessary information
- Does not repaint
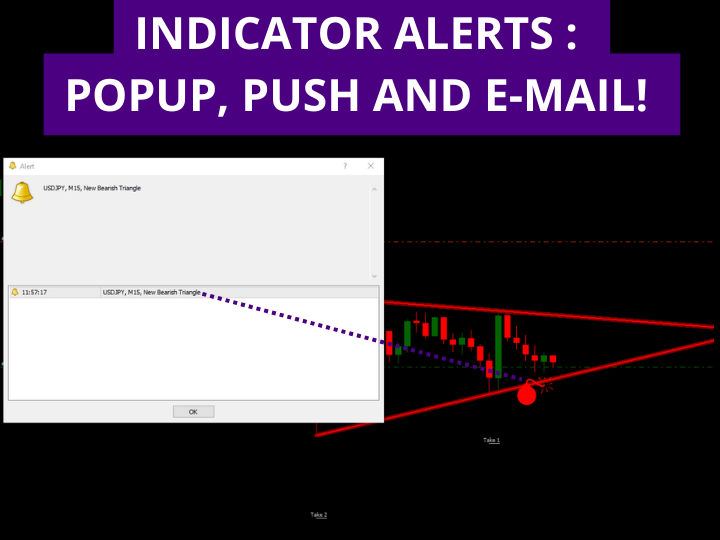
- Alerts on the charts when the signal appears showing the triangle pattern is complete. (Also push alerts and e-mail alerts if you like)
- Customization: Take Profit color and levels, width of lines and signal
- Excellent product support
Important Parameters
- Triangle mode: "Bullish and Bearish" that will give you buy or sell signals, and "Neutral Pattern" that will give you the option to trade both sides of the pattern.
- Show only latest pattern: If "true" you will have on the chart only the last buy and sell triangles. If "false" the indicator will search for all patterns on the chart.
- Bars to search: It will work only if the option above is "true", the indicator will seach all patterns for the number of bars you put here.
- Show take profit?: If "true" you will have "Take 1" and "Take 2" on the chart.
- Take Profit Level (Fibonacci Based): Here you can change for the Fibonacci number you like, the recommend numbers are: 161.8 ; 261.8 and 423.6.
- Show Signal, Signal Size, Pattern Width and Neon: These are options where you can customize visual features of the indicator.
- Alerts Settings: Here you can choose 3 alerts "Popup alert on the chart", "Push notifications in your phone" and "Notification in your e-mail" when the signal appears and the triangle pattern in complete.
I will always help you if you have any questions
For any questions related to the purchase, installation, backtesting and use of the Indicator you can send me a private message on my profile here on mql5: