Candlestick Patterns with Alerts MT5
- 指标
- Peter Mueller
- 版本: 1.2
- 更新: 23 三月 2024
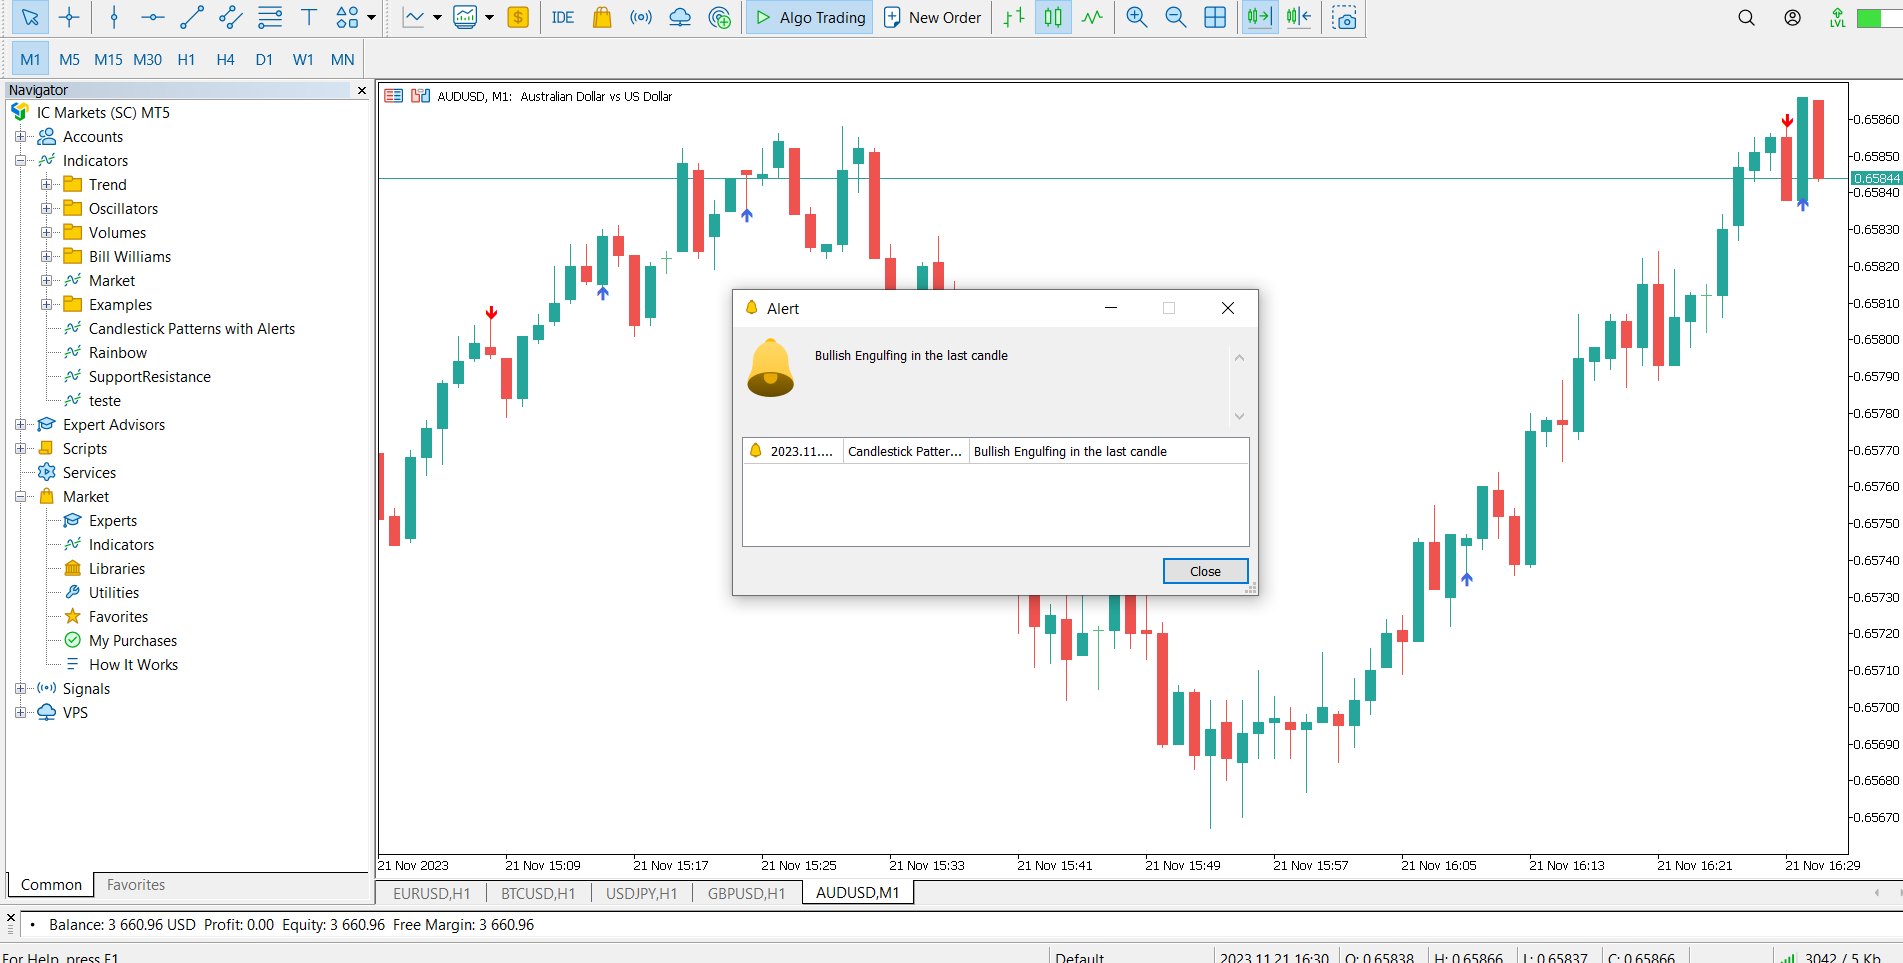
With this easy to set up indicator you can display and set alerts for the following candlestick formations: Bull Breakout, Bear Breakout, Hammer, Pin, Bullish Engulfing, Bearish Engulfing.
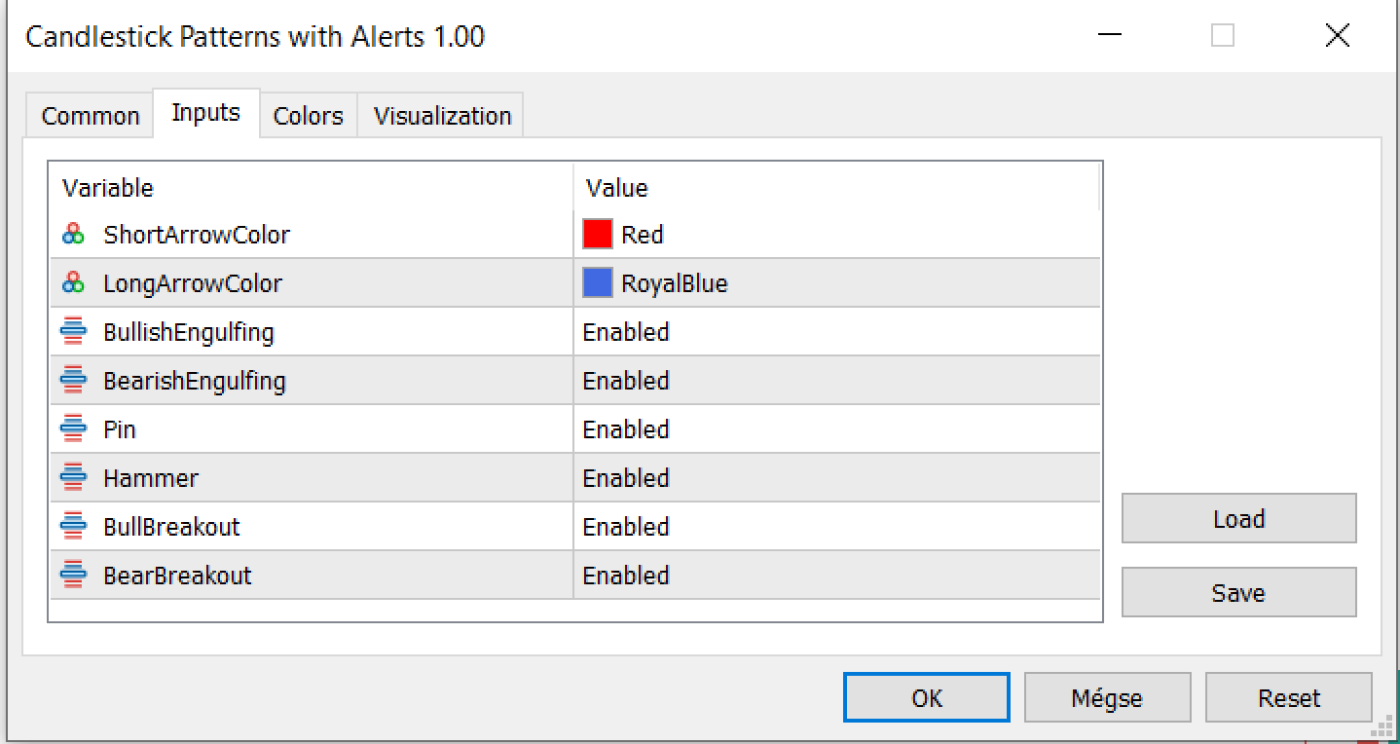
Input parameters:
- ShortArrowColor: The color of the Arrows, displaying a Bearish candle formation
- LongArrowColor: The color of the Arrows displaying a Bullish candle formation
- BullishEngulfing: Disabled/Enabled/EnabledwithAlert
- BearishEngulfing: Disabled/Enabled/EnabledwithAlert
- Pin: Disabled/Enabled/EnabledwithAlert
- Hammer: Disabled/Enabled/EnabledwithAlert
- BullBreakout: Disabled/Enabled/EnabledwithAlerts
- BearBreakout: Disabled/Enabled/EnabledwithAlert
- Morning Star: Disabled/Enabled/EnabledwithAlerts
- Evening Star: Disabled/Enabled/EnabledwithAlerts
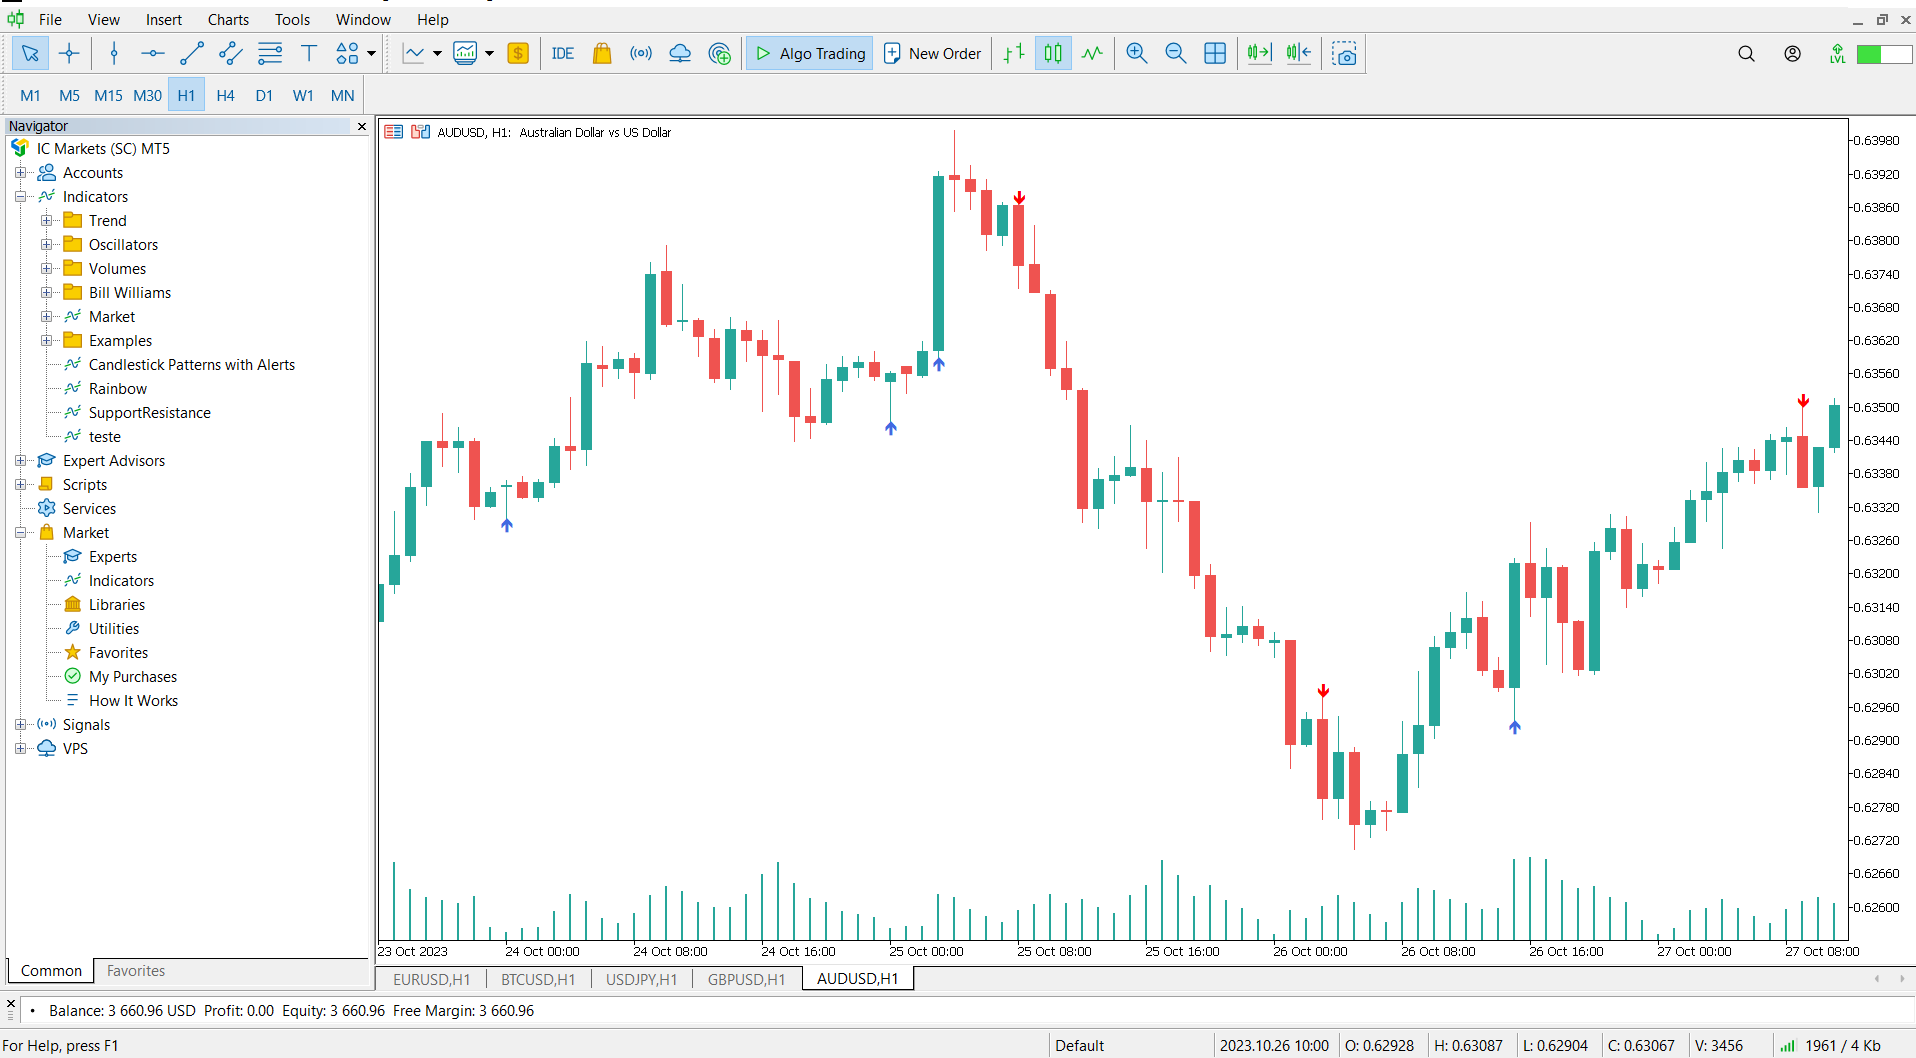
The indicator will display the enabled formations with arrows below/above the candle where the formation happened. If you disable a formation, no arrows for that formation will be drawn on the chart. If you enable the pattern, there will be arrows appearing, where the candlestick formation happened. If you select "EnabledwithAlert", the indicator will send an alert, whenever there is a new candle on the chart and the formation happened on the last candle. Whenever you drag the mouse over any arrow displayed by the indicator, the formation will be shown in the description of the arrow.
If you are a manual trader and you'd like to see a game changer tool, that is easy to use, enables you to create powerful grid and hedging strategies, check out ManHedger.


Every price action trader needs this indicator on their charts. What's more this indicator is Free! 5 Stars.