Black horse indicator MT5
- 指标
- Shengzu Zhong
- 版本: 1.22
- 更新: 2 六月 2024
- 激活: 10
Black horse 指标的目标是找出价格走势与VWAP指标之间的背离。它使用过滤器来排除许多虚假的背离,提供高质量、准确的信号。
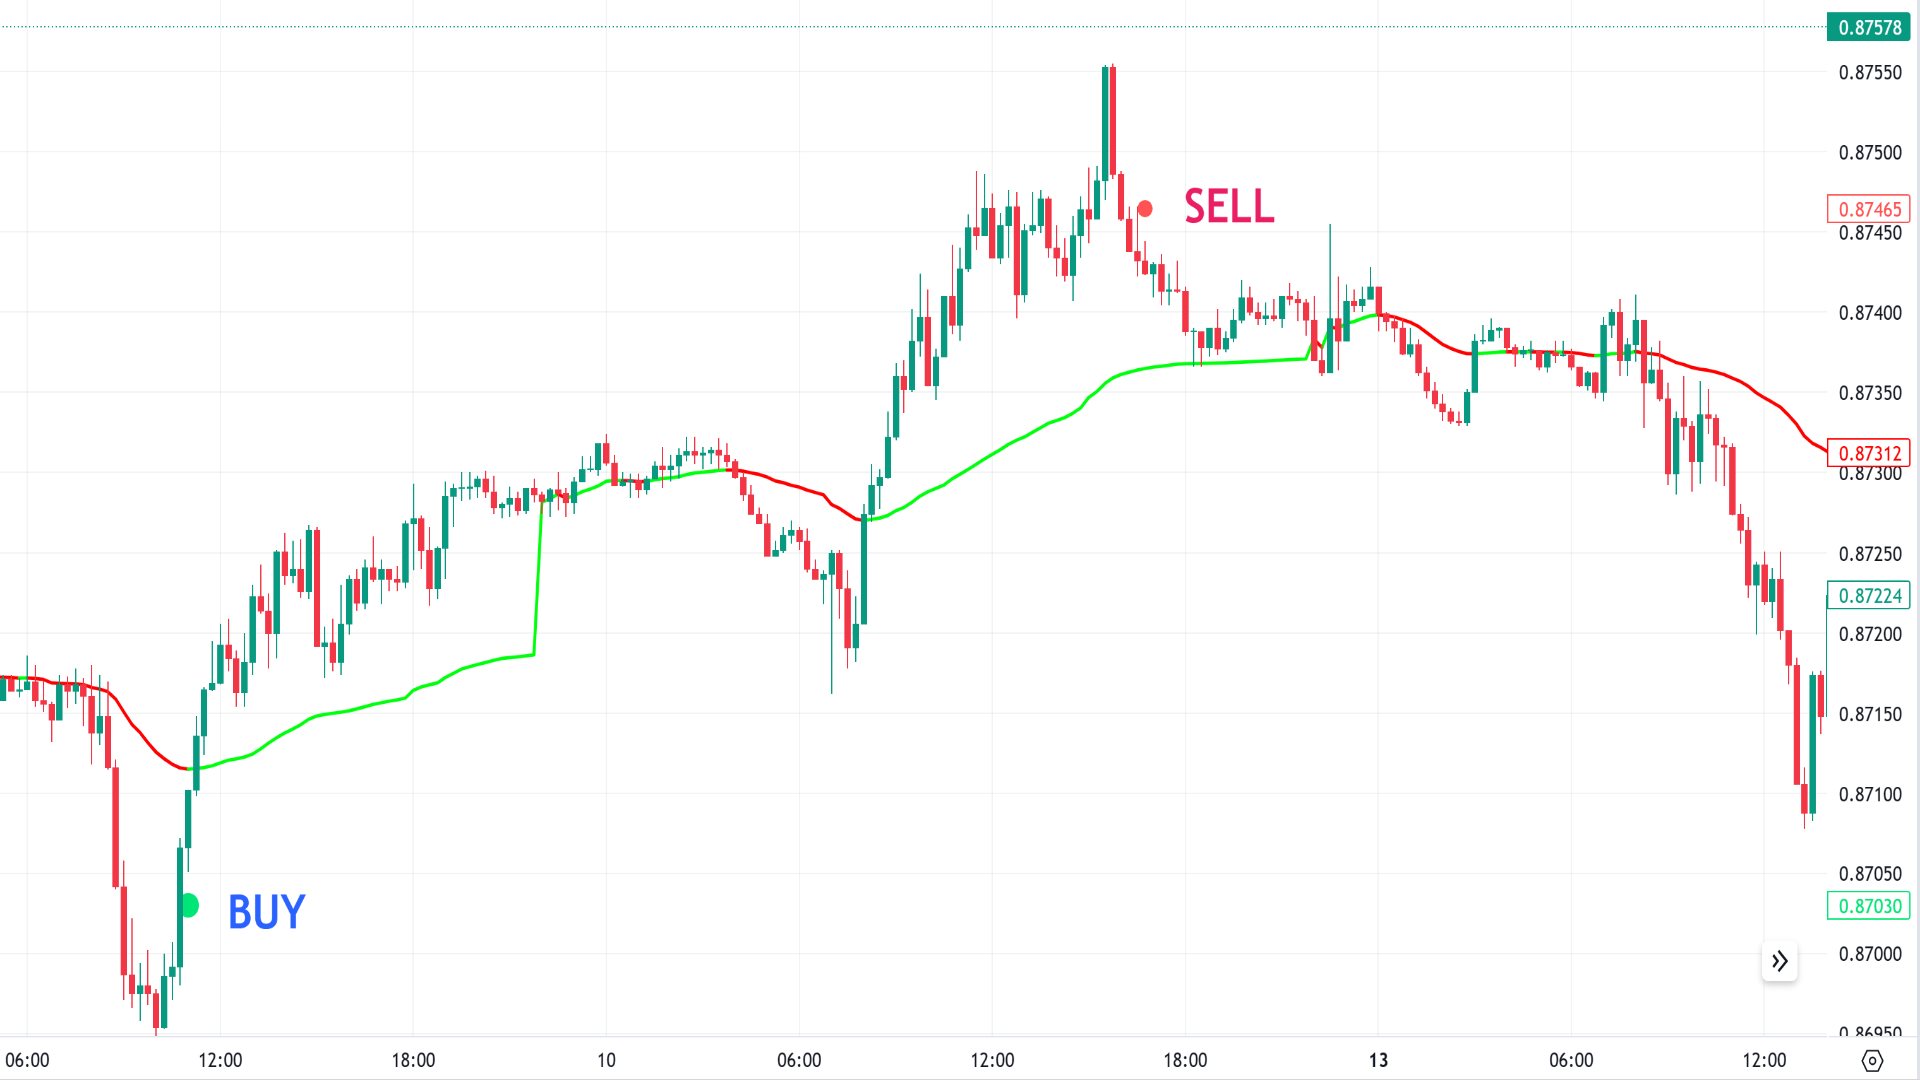
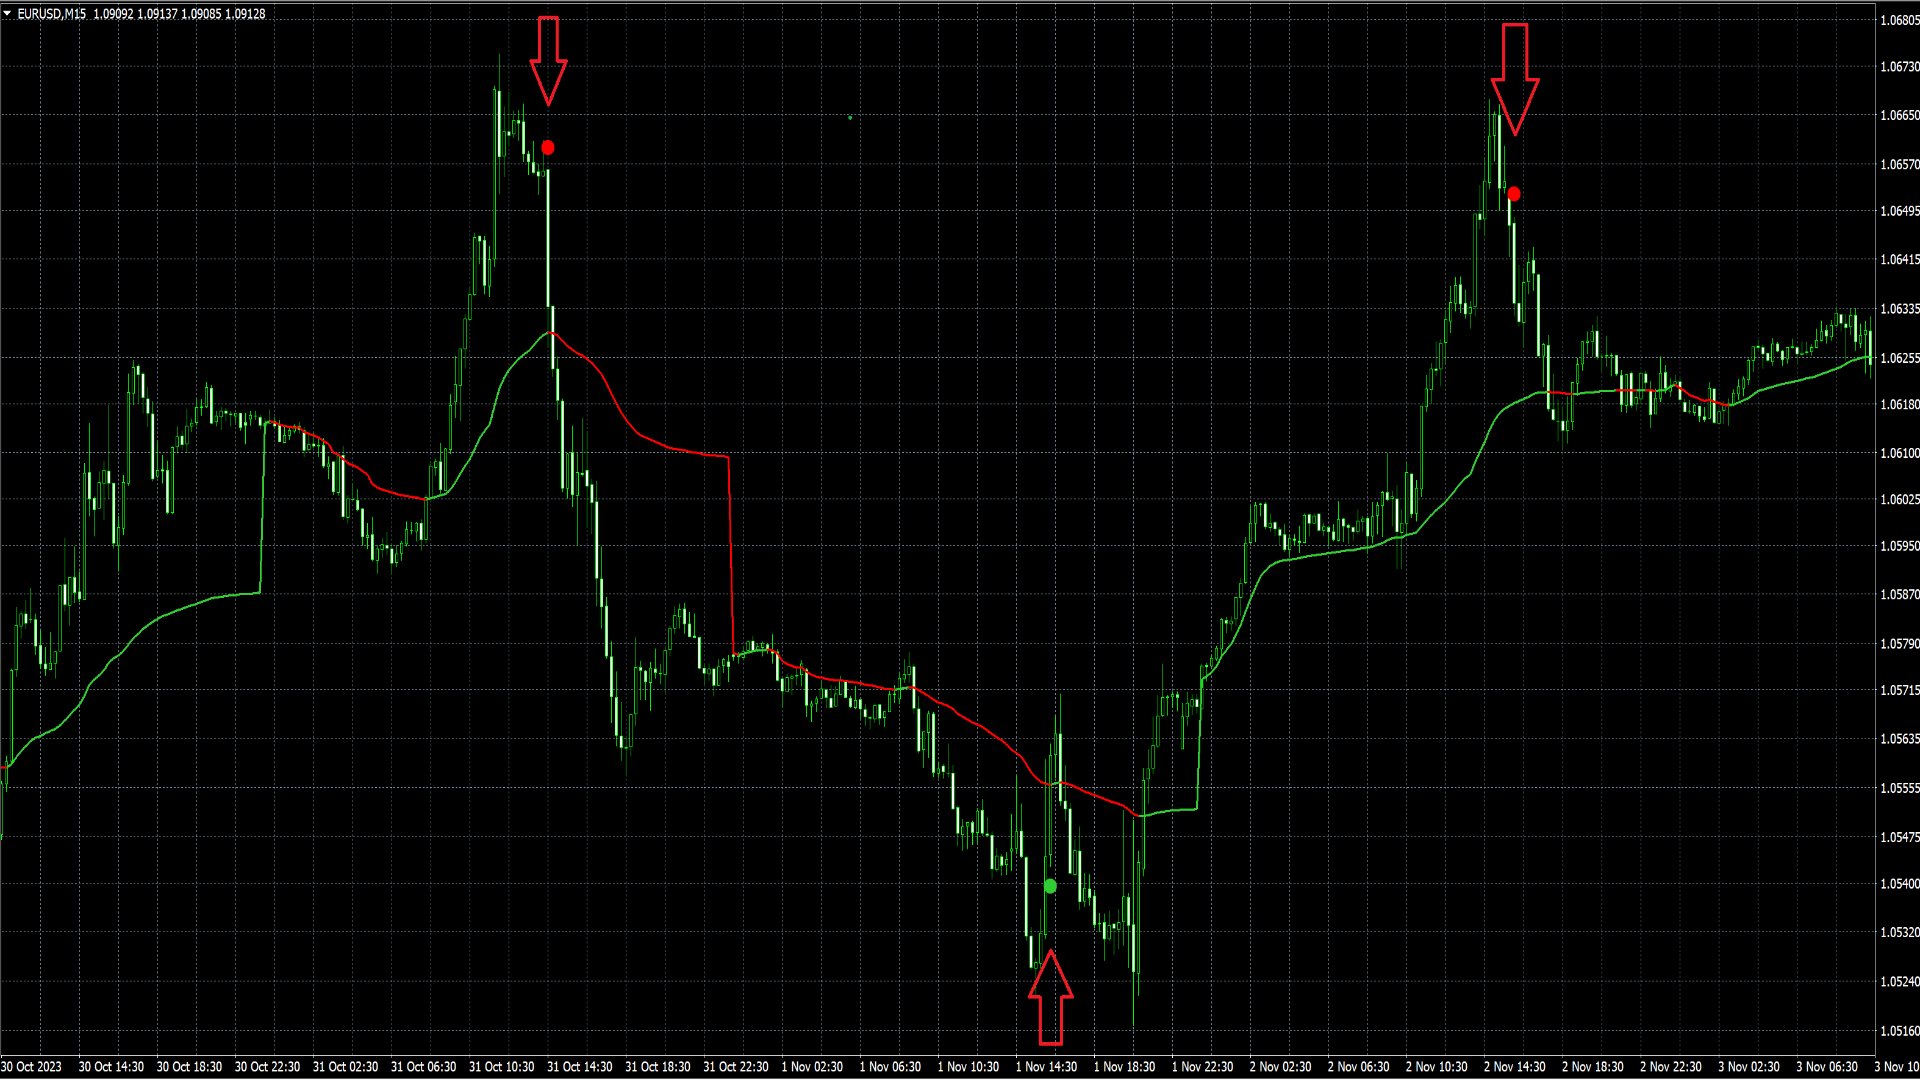
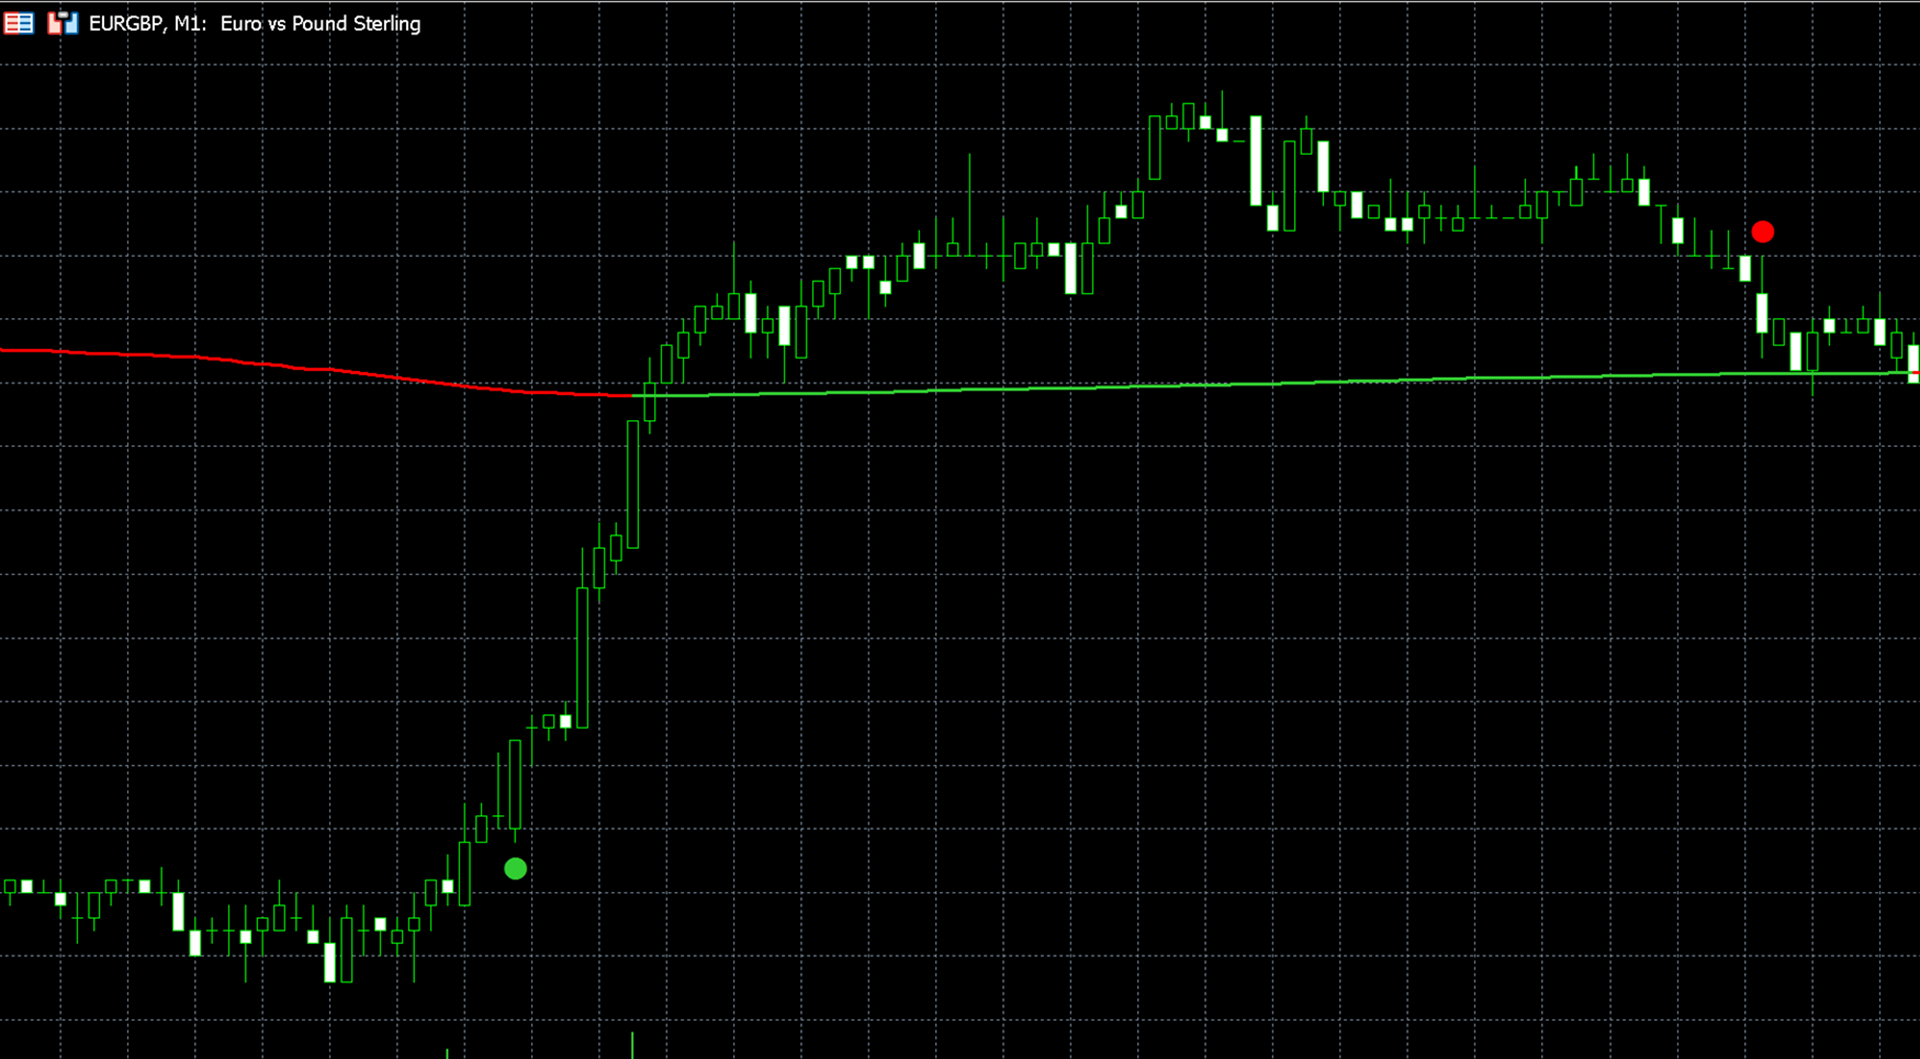
红色点位于蜡烛上方,表示看跌的背离,而绿色点位于蜡烛下方,表示看涨的背离。
背离的主要过滤器聚焦在ATR(平均真实范围)和过去蜡烛的价格变动,直到回顾期结束。当回顾期内的价格变动足够急剧,超过ATR倍数乘以ATR时,将确定存在背离。
由于计算的特性,在处理较高时间框架时,建议将ATR倍数和回顾期设置得较低。在较高的时间框架上,价格波动往往更为平滑,例如15分钟图表,急剧的价格波动发生的频率较低,通常包含在较少的蜡烛中,而这些蜡烛通常出现在较低的时间框架上。较不波动的股票,如HSBC,也应使用较低的ATR倍数和较短的回顾期。
在“视觉设置”下,您可以更改VWAP线的颜色,显示交替的VWAP颜色,调整背离信号的大小,并显示或隐藏VWAP线。