MACD ZigZag AI Divergence Alert
- 指标
- Xiaoyu Huang
- 版本: 1.0
- 激活: 20
这个指标采用经典的MACD和Zigzag结合用于检测价格和指标的背离,并采用先进的人工智能技术检测背离的有效性。MACD是指标之王,Zigzag也是非常有用的指标,这个指标把两个指标结合起来,发挥两个指标的优势。检测背离存在概率的问题,通常背离了又背离,所有我们试图通过先进的人工智能技术判断背离的有效性,过滤掉无效的背离,然后通过多种方式提醒用户。
促销价:59$
功能
1.MACD形式的Zigzag指标
2.检测价格和MACD指标背离
3.通过AI技术检测背离的有效性
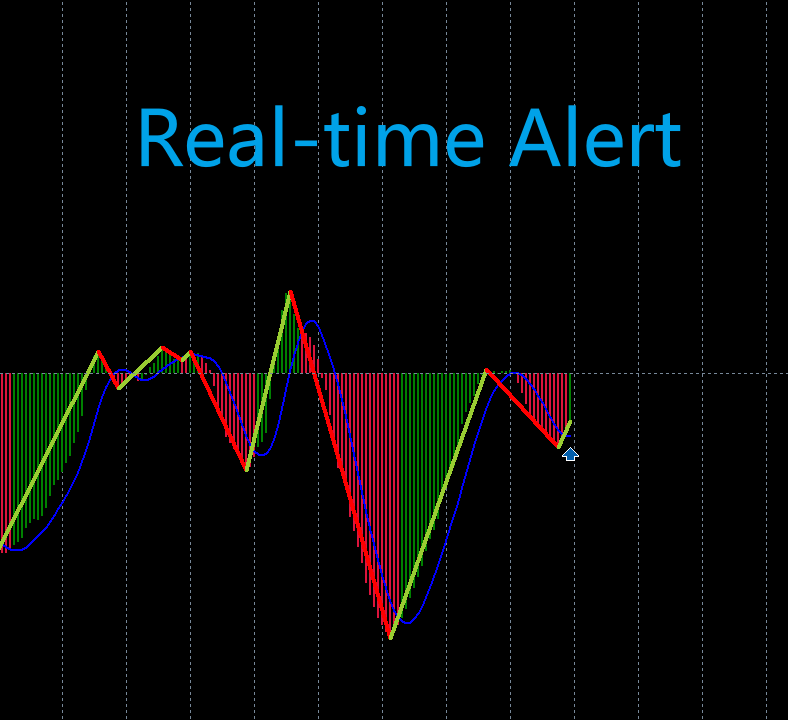
4.背离信号预警提醒
5.背离信号手机提醒
6.背离信号邮件提醒
7.使用于多个周期
8.使用强大的ONNX(Open Neural Network Exchange)模型格式
使用
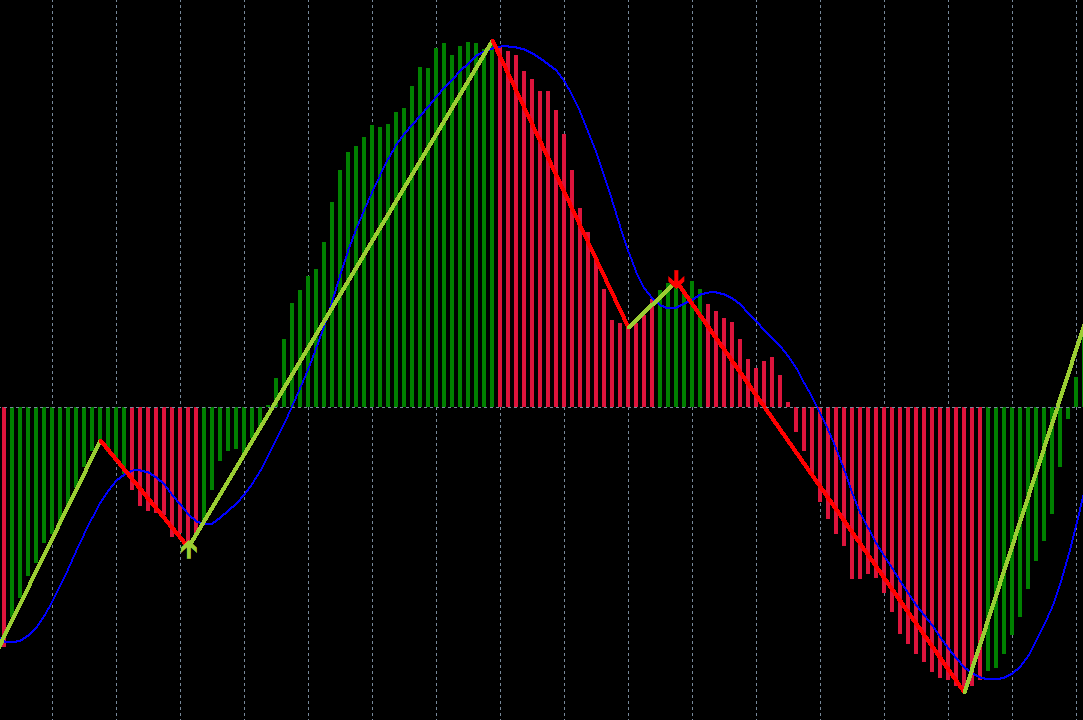
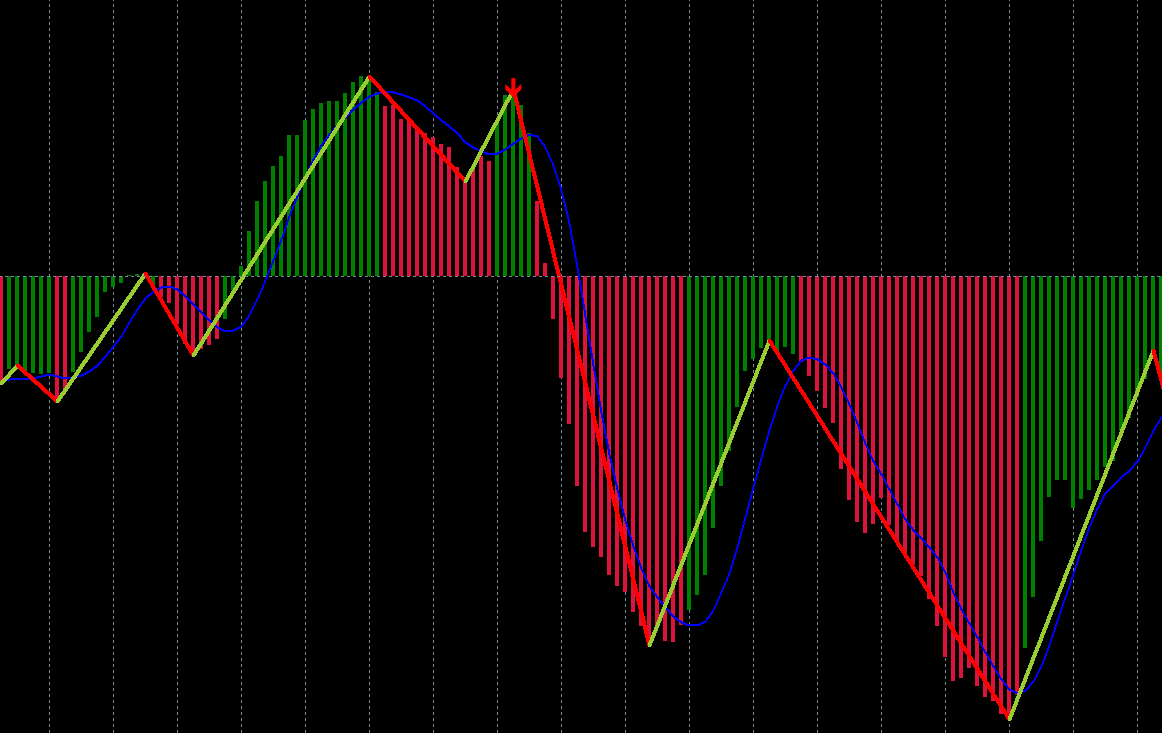
底背离:
单MACD在下面交叉时,指标会检测出是否底背离,画出向上的箭头,并提醒
顶背离:
单MACD在上面交叉时,指标会检测出是否顶背离,画出向下的箭头,并提醒
输入参数
Fast EMA period = 12;
Slow EMA period = 26;
Signal SMA period = 9;
Applied price = PRICE_CLOSE;
MaxCalculateBars = 2000;
UseAlertNotify = true;
UseMetaQuotesIDNotify = true;
UseMailNotify = true;
NofityPreMessage = "MACD Zigzig ";
SubWindow = 1;
标签:MACD,Zigzag,AI,Divergence,顶背离,底背离,价格行为,头皮策略,复合指标,智能指标,背离识别,盘整交易,人工智能