Transaction Speed
- 指标
- Ivan Stefanov
- 版本: 1.0
- 激活: 5
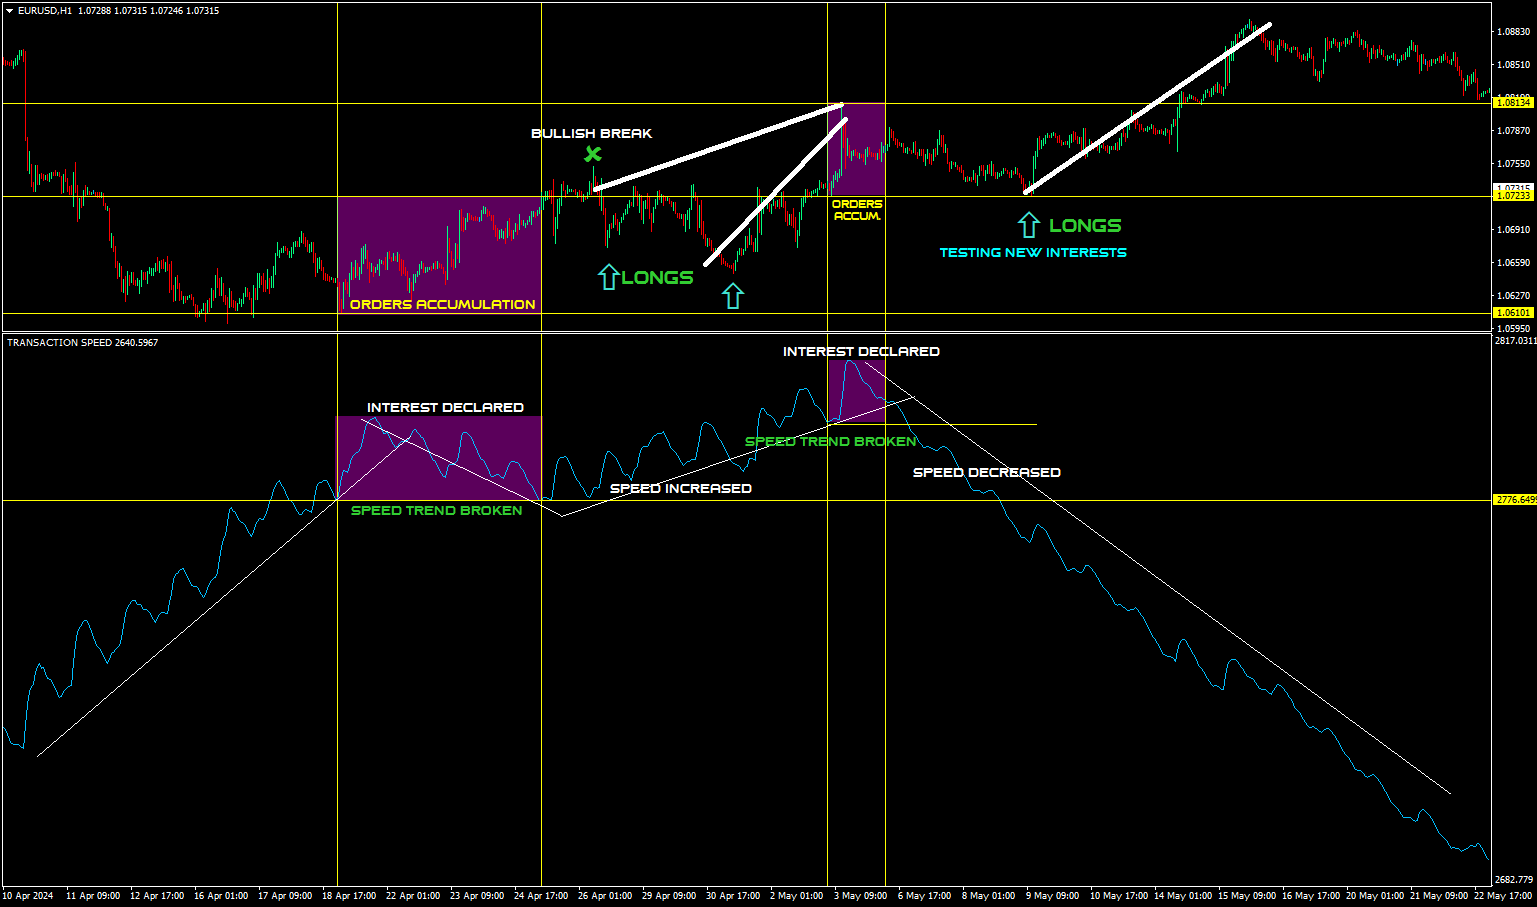
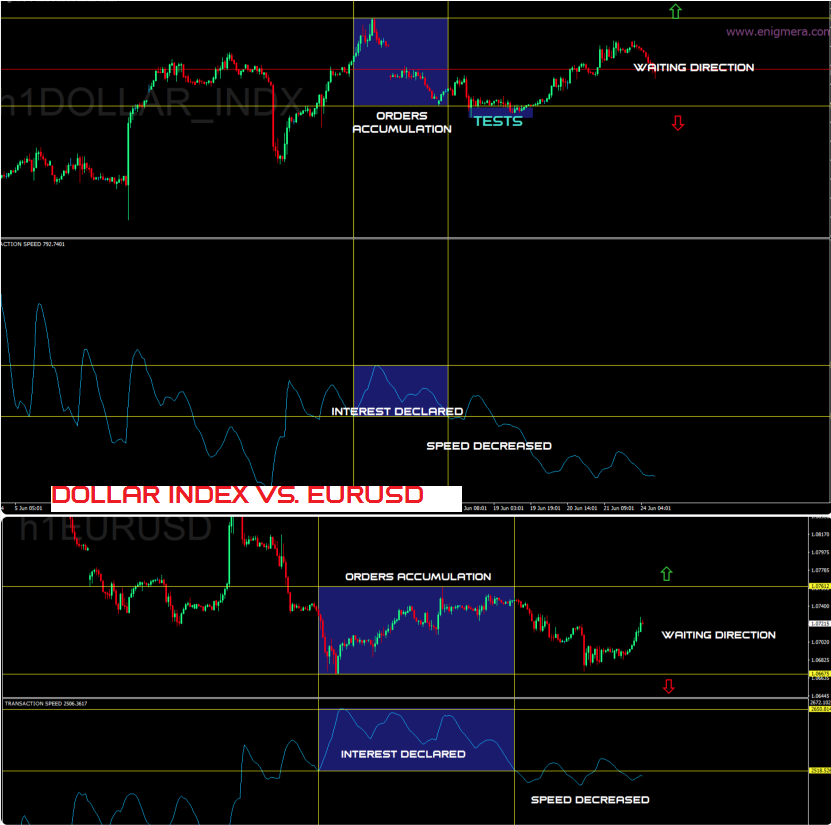
这是最赚钱的指标。它的表现非常出色。无论市场上有什么兴趣,你都能看到。
几乎在所有情况下,它都只会给你一个长期的市场观点,但不要被愚弄,以为它是受事件约束的。不是这样的。它能找到市场上最大的利益所在,并将其展示给你。别忘了,最大的资金(利益)每天都不会在市场上出现。这是您没有遇到过的情况。月租金可能会给您一到两个信号,仅此而已。但当我们谈论大资金时,他们就是这样行事的。
如果您想了解更多,请点击这里。
这是最赚钱的指标。它的表现非常出色。无论市场上有什么兴趣,你都能看到。
几乎在所有情况下,它都只会给你一个长期的市场观点,但不要被愚弄,以为它是受事件约束的。不是这样的。它能找到市场上最大的利益所在,并将其展示给你。别忘了,最大的资金(利益)每天都不会在市场上出现。这是您没有遇到过的情况。月租金可能会给您一到两个信号,仅此而已。但当我们谈论大资金时,他们就是这样行事的。
如果您想了解更多,请点击这里。