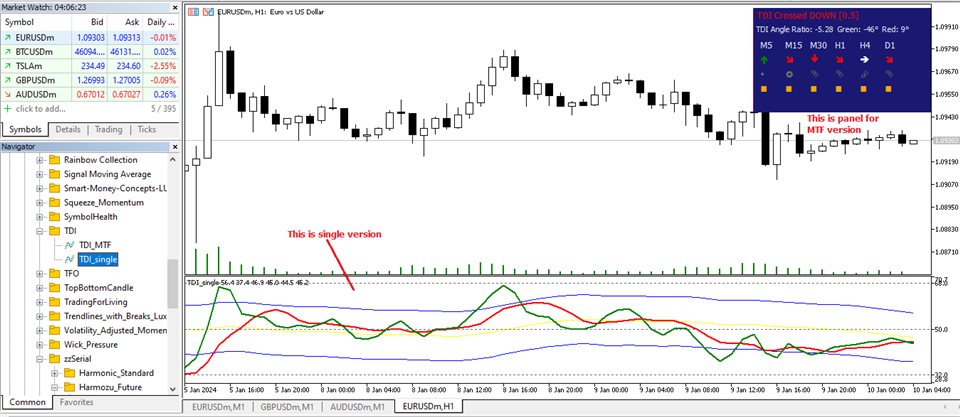
Tdi panel multi timeframe and signal
- 指标
- Minh Truong Pham
- 版本: 1.0
- 激活: 5
Traders Dynamic Index (TDI) MetaTrader indicator — a comprehensive but helpful indicator that uses RSI (Relative Strength Index), its moving averages, and volatility bands (based on Bollinger Bands) to offer traders a full picture of the current Forex market situation. Here is single timeframe product. Once puscharse this indicator, you free to use MTF scanner (free at here)
The Traders Dynamic index TDI indicator is the next generation of the popular Trader Dynamic index indicator developed by Dean Malone and released in 2005 the TDI includes the addition of divergence signals and multiple crossover alerts. By combining the original Traders Dynamic index with divergence signal and alerts, traders get a highly responsive indicator that shows direction, Market Sentiment, continuation, and turning point in one indicator.
The Lines of the TDI:
Green= Current Price Sentiment.
Red=Crossover for Entry & Exit.
Yellow=Overall Market Sentiment.
Blue=Increasing/Decreasing Volatility.
TOP
4 TDI Strategies
1. TDI SIGNAL
+ Trend & Angle Strategy
The beauty of the TDI is in its simplicity to plot the direction of market sentiment in relation to price action. This strategy is the "everyday" strategy for all TDI users regardless if of the type of trader: scalper on a 1-minute or 5-minute chart, active or swing trader on intraday charts, or position trader on a Daily chart. To trade the TDI Signal, look to trade the Green line crossing the Red line with good angle in the trend direction of the Yellow line.
+ Break down of the strategy
1.Look for Green line & Red line crossovers.
2.At crossover, look for "strong angle" in the direction of the overall trend (Yellow Market Base Line).
3. Compare direction of Price and TDI Green line. Higher probable trade when both are moving in the same direction
4. Enter trade if Price action and TDI align.
5. Exit trade when Green line crosses over Red, Blue or Yellow lines in the opposite direction.
2. SP REVERSAL
SP Reversal (Swing/ Position Reversal Strategy)
Note: this is a counter trend type trade. The market tends to cycle up and down in a normal trading range the majority of time. At times, the market will make extreme moves beyond its normal range referred to as Overbought" and "Oversold" areas. When the market is in these extreme areas, there is an expectation for the market to move back into its normal trading range. Thus, traders look for reversal trades. Using the TDI, monitor the Yellow (MB) line on a 4-hour or Daily chart. When the MBL hits or extends beyond the 32 level or 68 level, look for a reversal trade setup that could run for days or weeks
+ Break down of the straight
1. Monitor 4-hour and Daily charts.
2. Look for Yellow Market Base Line to hit the 32 or 68 level... and possibly move beyond the 32 or 68 levels.
3. Wait for Yellow to close below the 68 level or close above the 32 level
4. Compare Price action to TDI.
5. Enter trade when Green, Red, & Yellow lines crossover in direction of reversal.
6. Exit trade when Green line closes after crossover of Yellow line
3. TDI Hook
TDI Hooklcounter trend setup) (intraday reversal signal). The TDI Hook is another counter-trend strategy designed to catch intraday reversals when the market extends beyond the Volatility Band and either below the 32 level or above the 68 level. The name of this strategy derives from the bending Curve shape of the Green line, much like a fish hook, as it moves back towards the 50 level. Monitor the Yellow line for overall trend sentiment and be watchful for price continuation before a reversal occurs. Price can be stubborn and move against sentiment and when it is exhausted it may than turn.
+ Breakdown of Strategy
1. Look for the Green Line to move beyond the 32 level or the 68 level...and beyond the Blue Volatility band.
2. Monitor for a hook formation across the Blue Volatility band.. "hook down" if above 68 level and a "hook up" if below the 32 level.
3. Look for either Divergence or potential Continuation. **Divergence may only be a slight pull back.
4. Enter trade with a tight Stop Loss above previous High or below previous Low.
5. Exit trade at Green & Red crossover, Fibonacci level, or Stop Loss
4. Squeeze
The Squeeze strategy is a breakout trade. It derives its name when the Blue Volatility lines compress or "squeeze" together due to price consolidating into a tight narrow range with low market volatility. The location of the Volatility Band squeeze most often determines a favorable trade direction. If the squeeze occurs near the 68 level, look to trade Short. If the squeeze occurs near the 32 level, look to trade Long. If the squeeze occurs near the 50 level, be aware of economic events that can influence the direction of price action.
+ Breakdown of Strategy
1. Look for Blue Volatility lines to compress or "squeeze" together.
2. Identify the placement of Green, Red, & Yellow lines to determine potential break direction.
3. Enter a trade when Green line breaks one of the Blue Volatility lines in the direction of the Red or Yellow lines.
4. Exit trade when Green line crosses Blue Volatility line towards centre
For mor info, please read here.


