• 概述
  • 评论
  • 评论
  • 新特性

MultiFractal

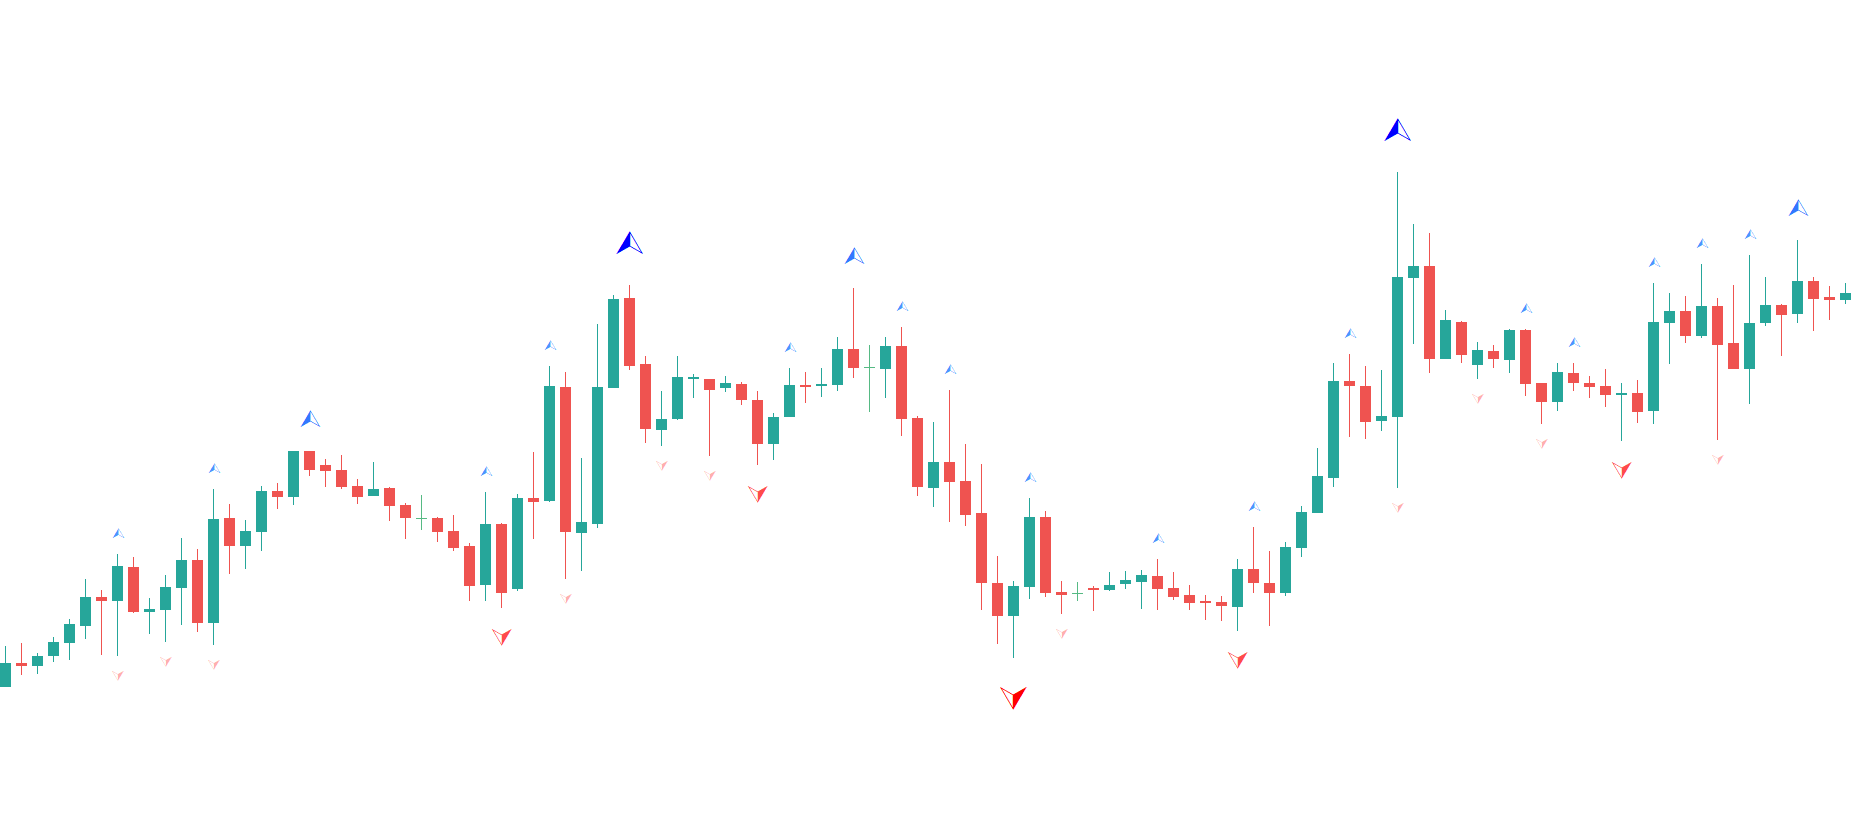
多重分形是一種改良的比爾威廉斯分形指標,輔以高階分形,其大小相差四倍,類似於改變時間範圍。

與原廠終端指示器相比的優點:

  • 方便
  • 能見度
  • 資訊內容

此指標很方便,因為您在工作時無需切換到不同的時間範圍。

可見度 - 在一張圖表中,您可以看到從小到中、大市場走勢的圖表結構。

資訊內容 - 直觀地我們獲得有關圖形的更多資訊。

現在,所有基於或基於多重分形指標的交易策略都將具有附加訊號。
此外,如您所知,分形可以充當支撐位和阻力位。 並且在一些交易策略中,顯示流動性水準。
交易者經常使用分形來確定價格變動的方向、支撐位和阻力位,並設定停損單。
如果價格無法突破先前的分形並在先前的分形後面鞏固,那麼市場就形成了橫盤。

祝您在交易中獲得豐厚的利潤。

推荐产品
Swing Breakout Sequence | SBS presents a comprehensive trading strategy designed to help traders identify and capitalize on market swings and breakouts. The Swing Breakout Sequence (SBS) strategy is built around a series of well-defined steps to optimize trading decisions and improve profitability. Key Components of the SBS Strategy: Breakout Identification : The initial step involves identifying potential breakouts in the market. This is a crucial phase where traders look for key levels where t
Contact me for instruction, any questions! Introduction The Elliott Wave in technical analysis describes price movements in the financial market that are related to changes in trader sentiment and psychology. The 5 W Pattern (Known as 3 Drives) is an Elliott Wave pattern that is formed by 5 consecutive symmetrical moves up or down. In its bullish form, the market is making 5 drives to a bottom before an uptrend forms. In a bearish 5-drive, it is peaking before the bears take over.  5W Pattern S
The rubdfx divergence indicator is a technical analysis tool that compares a security's price movement. It is used to identify potential changes in the price trend of a security. The indicator can be applied to any type of chart, including bar charts and candlestick charts. The algorithm is based on MACD, which has been modified to detect multiple positive and negative divergences. Settings  ___settings___ * fastEMA * slowEMA * signalSMA *Alerts:   True/False     #Indicator Usage B
Market Entropy
Elian Isaac Rodrigues Oliveira
The Market Entropy indicator was created to measure the order of price changes over time. consists of two lines and a histogram where the lines are responsible for measuring the price movement and the histogram measures the strength of the analyzed movement. It can be used to find a trend (Image 2) or price reversal (Image 3). Blue Line: Buy Entropy Red Line: Sell Entropy Historgram: Market Entropy Interpretation: Buy Line above the Sell Line indicates that in the analyzed period buyers wer
Golden Swings
Arnold Byarufu
"GoldenSwing" is a comprehensive MetaTrader 5 indicator meticulously crafted by Southern Star Trading, designed to enhance your trading strategies with precision swing high and swing low identification. Harnessing the power of swing analysis, this indicator provides traders with invaluable insights into market reversals and trend continuations, enabling them to make informed trading decisions. With its advanced algorithm, GoldenSwing detects significant swing highs and swing lows in real-time
This indicator scans the 1-3 Trendline pattern . The indicator is a 100 % non repaint low risk breakout system . The patterns are formed around swing high and swing lows which make them a low risk pattern with high reward. PATTERN BACKGROUND The 1-3 Trendline Breakout pattern is formed by four(4) points which are composed of three (3) primary points and the pattern neck. A trendline is always formed by the point 1 and the neck of the pattern . When price breaks out of the trendline formed ,
Технический индикатор Universal Oscillator является комбинацией торговых сигналов самых популярных и широко используемых осцилляторов. Индикатор представлен гистограммами, а также линиями fast и slow MA, что позволяет расширить список получаемых торговых рекомендаций и работать как по тренду, так и в боковом движении рынка. Таким образом, гистограммы позволяют определить момент пробоя ценовых значений и движение в новой фазе рынка, а линии указывают на зоны перекупленности и перепроданности.  Ос
Linear Regressions Convergence Divergence is an oscillator indicator of a directional movement plotted as a difference of two linear regressions with lesser and greater periods. This is a further development of the ideas implemented in the standard MACD oscillator. It has a number of advantages due to the use of linear regressions instead of moving averages. The indicator is displayed in a separate window as a histogram. The signal line is a simple average of the histogram. The histogram value a
Liga
Andriy Sydoruk
The indicator connects the price in a cyclical-wave relationship. Thus, all intersection points will be optimal points at which the movement changes taking into account the indicator period. Crossing points can be used as potential market reversal points. But do not forget that the approach must be complex, the indicator signals require additional information to enter the market. Suitable for forex, futures and binary options without redrawing. It gives a lot of signals, which requires additi
FREE
The indicator is similar to https://www.mql5.com/en/market/product/12330 . However, it considers the MQL5 platform features. Peaks and bottoms are calculated based solely on external bars. After a swing is formed, the indicator does not redraw providing opportunities for traders working on horizontal level breakthroughs. Traffic can be reduced by changing the amount of calculated bars in the MinBars variable (default value is 500). All you need is to select the output options, so that you can se
Introduction "Smart money" is money invested by knowledgeable individuals at the right time, and this investment can yield the highest returns. The concept we focus on in this indicator is whether the market is in an uptrend or downtrend. The market briefly takes a weak and reversal trend with "Minor BoS" without being able to break the major pivot. In the next step, it returns to its main trend with a strong bullish move and continues its trend with a "Major BoS". The "order bloc
Trend Complete
Oleksii Ferbei
The Trend Complete indicator is a signal indicator and has interesting properties. It should be taken into account that this indicator reflects extremes and should be used as an additional one, and another instrument should be used for the entry point. Searches for and displays pivot points on the price chart. Trend indicators are one of the main tools for analyzing trends in the Forex market. The indicator is able to transmit all types of signals to the user: messages, E-mail and Push! The g
神奇九转, 顾名思义就是每当出现数字9时,行情就很大的几率会发生逆转,这时应该注意止盈。是一个很有效的指标。 在序列显示和形成过程中,一旦出现不符合触发条件的情况,则前面序列数字消失,本次九转序列结构不存在。如果连续九天都达到触发条件,九转序列结构形成,价格走势可能发生反转。 九转序列可分为上升九转结构和下降九转结构,也就是九转序列在买多和买空以及判断各种走势反转是都可以使用。 九转序列买入建仓,即下降九转序列结构形成时,价格走势将要发生转变,考虑建仓买入。 买入条件:连续出现九根K线,并且满足收盘价都低于前一根K线收盘价,当第8、9根K线满足上述条件时,九转序列形成,投资者准备买入建仓。 使用分时九转时需要注意两点: 1、极端行情时(连续上涨或下跌),九转序列失效; 2、当九转序列完全形成时,再进场操作(尤其不用刚出现数字8或9就入场,一定要完全形成之后才可以。)
Fib Auto Trendline
Nhlanhla Brilliant Mashavha
INTRODUCTION The  Fib Autotrendline   is a basic tool that analysts use to find out when a security's trend is reversing. By determining the   support and resistance areas , it helps to identify significant changes in price while filtering out short-term fluctuations, thus eliminating the noise of everyday market conditions. It is an excellent tool for any trader who follows indicators that use   swing highs  and   swing lows . How to Use the fib Auto Trendline Indicator The Fib Auto Trendline
With this easy to set up indicator you can display and set alerts for the following candlestick formations: Bull Breakout, Bear Breakout, Hammer, Pin, Bullish Engulfing, Bearish Engulfing. Input parameters: ShortArrowColor: The color of the Arrows, displaying a Bearish candle formation LongArrowColor: The color of the Arrows displaying a Bullish candle formation BullishEngulfing: Disabled/Enabled/EnabledwithAlert BearishEngulfing: Disabled/Enabled/EnabledwithAlert Pin:  Disabled/Enabled/Enabledw
FREE
DWMACD
Roman Sukhorukov
DWMACD - Divergence Wave MACD . The indicator displays divergences by changing the color of the MACD histogram. The indicator is easy to use and configure. For the calculation, a signal line or the values ​​of the standard MACD histogram can be used. You can change the calculation using the UsedLine parameter. It is advisable to use a signal line for calculation if the histogram often changes directions and has small values, forming a kind of flat. To smooth the histogram values ​​set the signa
The indicator determines the state of the market: trend or flat. The state of the market is determined by taking into account volatility. The flat (trading corridor)is displayed in yellow. The green color shows the upward trend. The red color shows the downward trend. The height of the label corresponds to the volatility in the market. The indicator does not redraw . Settings History_Size   - the amount of history for calculation. Period_Candles  - the number of candles to calculate the
This indicator watch the Fibonacci retracement for levels and timeframes selected by the trader. In the workload of day trading, having your eyes on all the timeframes to validate some information, for Fibonacci traders, is really time consuming and requires constant focus.  With this in mind, this tool allows you to have your attention on other trading details while this one monitors the retracements of each timeframe in real time. In the charts, this indicator data (retracement %, age of the r
An customize Indicator by which you can have Triple moving averages at close prices and send push notification on each crossing.  This indicator is especially useful when you are doing manual trading. Notes: Cation: forex trading is a very risky business,...              don't invest the money you cannot bear to lose.             the probability of losing is high ... more high aaaand exponentially high.... something like EMA enjoy losing with us...
FourierREM
Tomas Belak
Indicator Name : Fourier Transform Curve Indicator Description : The Fourier Transform Curve Indicator for MetaTrader 5 is a powerful tool that leverages Fourier analysis to depict curves directly on your price chart. It is designed to provide valuable insights into the underlying harmonic components of the price data. Parameters : Input Candle Count : This parameter allows you to specify the number of candles to include in the Fourier transformation calculation. A higher value will capture lon
FibExtender
Syed Oarasul Islam
This Indicator draws Fibonacci Extension levels in two different ways. You can select whether to draw Fibonacci Extension levels based on your favourite ZigZag settings or you can let the indicator to draw Fibonacci Extension  level based on given number of Bars or Candles.  You can also set Mobile and Email notification for your favourite Extension  levels individually. With this indicator you will not have to feel lonely as the it can generate Voice alerts, which will keep you focused on your
This is a well-known ZigZag indicator. But it differs by the fact that its plot is based on values of the middle line which is set by a user. It can display Andrews’ Pitchfork and standard or Bobokus Fibo levels. NO REPAINTING. Parameters Period МА — middle line period. Default value is 34. Minimum value is 4. Maximum value is set at your discretion. Used to calculate price — type of price used for the midline calculations. The averaging method — type of smoothing for the middle line. Turning
Renko System
Marco Montemari
This indicator can be considered as a trading system. It offers a different view to see the currency pair: full timeless indicator, can be used for manual trading or for automatized trading with some expert advisor. When the price reaches a threshold a new block is created according to the set mode. The indicator beside the Renko bars, shows also 3 moving averages. Features renko mode median renko custom median renko 3 moving averages wicks datetime indicator for each block custom notificatio
Price Stelar
Ignacio Agustin Mene Franco
Price Stellar! is a bot that has the strategy of grabbing rebounds on the roofs or floors of the Yellow channel, accompanying an ema to hunt the bullish or bearish trend, It can be seen very clearly in the photo what the strategy is about works for all seasons to scalp and long works for all forex pairs and for the pairs of synthetic indices ! from now to enjoy good profit World Investor.
Trend and Signals MT5  indicator scans  30 trading Instruments (Forex, Metals and Indices).     It uses special algorithm on the  current market   based on   Pure Price Action   and display the overall trend and signal on the dashboard. When signals are produced the indicator sends alert and notification. Strategy for Signals This indicator uses the daily timeframe to determine the direction of the trend. The hourly timeframe is used to identify possible entries. Main trend and is determined by
Gekko MACD Plus
Rodrigo Galeote
3 (3)
Type: Oscillator This is Gekko's Cutomized Moving Average Convergence/Divergence (MACD), a customized version of the famous MACD indicator. Use the regular MACD and take advantage of several entry signals calculations and different ways of being alerted whenever there is potential entry point. Inputs Fast MA Period: Period for the MACD's Fast Moving Average (default 12); Slow MA Period: Period for the MACD's Slow Moving Average (default 26); Signal Average Offset Period: Period for the Signal
Fibonacci sequence is defined by integer sequence: 0, 1, 1, 2, 3, 5, 8, 13, 21, 34, 55, 89, 144, ... By definition, it starts from 0 and 1, the next number is calculated as a sum of two previous numbers. Instead of the standard moving average, the indicator uses the following calculation of average price: Bar0 + Bar1 + Bar2 + Bar3 + Bar5 + Bar8 + Bar13 + Bar21 + ... Input parameters: fiboNum - numbers in the following integer sequence for Fibo Moving Average 1. 5 on default. fiboNum2 - numbers i
The new update makes this indicator a complete tool for studying, analyzing and operating probabilistic patterns. It includes: On-chart Multi-asset percentage monitor. Configurable martingales. Twenty-one pre-configured patterns, including Mhi patterns and C3. An advanced pattern editor to store up to 5 custom patterns. Backtest mode to test results with loss reports. Trend filter. Hit operational filter. Martingale Cycles option. Various types of strategies and alerts. Confluence between patter
Hunter trend
Yaroslav Varankin
Hunter Trend: Arrow Indicator for Binary Options Trading Hunter Trend is an arrow indicator designed for trading binary options (turbo options) on the M1 timeframe, allowing for short-term trading opportunities. How to Trade with this Tool: Signals may appear when a candlestick forms. Once such a signal appears, wait for the closure of that candlestick. Upon the opening of a new candlestick, open a trade for 1-2 candlesticks in the indicated direction. In this case, for 1-2 minutes. A blue dot
该产品的买家也购买
Atomic Analyst MT5
Issam Kassas
5 (14)
首先值得强调的是,该交易指标是非重绘、非延迟的指标,这使其成为手动和机器人交易的理想选择。 用户手册:设置、输入和策略。 Atomic Analyst是一种PA价格行动指标,利用价格的力量和动量来寻找市场上更好的机会。配备了高级过滤器,可帮助去除噪音和假信号,并提高交易潜力。使用多层复杂的指标,Atomic Analyst扫描图表,并将复杂的数学计算转化为任何初学者都能理解并用来做出一致交易决策的简单信号和颜色。 “Atomic Analyst”是专为新手和经验丰富的交易者量身定制的综合交易解决方案。它将高级指标和一流功能融合为一体的交易策略,使其成为所有类型交易者的多功能选择。 日内交易和剥头皮策略:专为快速准确的日内交易和短期交易而设计。 日内和摆动交易策略:可用作追求价格大幅波动的日内和摆动交易者的可靠工具。 多货币和市场:凭借其可靠的精度,在不同的工具和市场上运作。 多个时间框架:可在多个时间框架上使用,性能良好。 稳定性:所有指标均不重绘、不重绘和不滞后,确保可靠的信号。 信号清晰度:提供箭头信号,用于清晰的入场和出场点。 实时警报:通过交易入场、SL和TP警报通知交
首先,值得强调的是,这个交易系统是一个非重绘、非重画和非滞后的指标,这使得它非常适合手动和机器人交易。 在线课程,手册和下载预设。 “智能趋势交易系统 MT5”是专为新手和经验丰富的交易者量身定制的综合交易解决方案。它结合了超过 10 个优质指标,具有 7 多个强大的交易策略,使其成为适用于各种市场条件的多功能选择。 趋势跟随策略:提供精确的入场和止损管理,以有效地跟随趋势。 反转策略:识别潜在的趋势反转,使交易者能够利用区域市场的机会。 剃头策略:专为快速准确的日内交易和短期交易而设计。 稳定性:所有指标都不会重绘、不会重画和不会滞后,确保可靠的信号。 定制:支持自定义策略,以满足个人交易偏好。超过 7 种策略和组合可帮助您找到最佳策略。 信号清晰度:提供箭头信号,以指示清晰的入场和退出点。 实时警报:通过交易进出警报使交易者保持了解。 深入分析:提供更高时间框架的趋势分析和实时交易监控。 自适应颜色编码:利用蜡烛颜色编码来显示成交量、趋势和反转蜡烛信号。通过蜡烛颜色分析市场方向。 “智能趋势交易系统 MT5”赋予交易者必要的工具,以便在各种市场条件下做出明智和战略性的交易决策。无论
Quantum Trend Sniper
Bogdan Ion Puscasu
5 (43)
介绍   量子趋势狙击指标 ,突破性的 MQL5 指标,正在改变您识别和交易趋势反转的方式!由拥有超过13年交易经验的资深交易员团队开发,     量子趋势狙击指标   旨在通过其创新的方式以极高的准确度识别趋势反转,将您的交易之旅推向新的高度。 ***购买量子趋势狙击指标,即可免费获得量子突破指标!*** 当量子突破指标识别出趋势反转时,它会向您发出警报和信号箭头,并建议您三个止盈水平。 它既适合新手交易者,也适合专业交易者。 量子 EA 通道:       点击这里 MT4版本:       点击这里 建议: 时间范围: 所有时间范围。为了获得最佳结果,我们建议在 M15、M30 和 H1 时间范围内使用它。 货币对:欧元兑美元、英镑兑美元、澳元兑美元、欧元兑英镑、, EURAUD,  XAUUSD 账户类型:ECN、Raw 或 Razor,点差极低 经纪时间:任意 经纪商:IC Markets、Pepperstone with Raw 和 Razor 的点差最低 建议止损:50 点 建议止盈水平:20 点、50 点和
TPSpro RFI Levels MT5
Roman Podpora
5 (8)
Reversal First Impulse levels (RFI)      INSTRUCTIONS        RUS       -       ENG              R ecommended to use with an indicator   -   TREND PRO -  Version MT4                 A key element in trading is zones or levels from which decisions to buy or sell a trading instrument are made. Despite attempts by major players to conceal their presence in the market, they inevitably leave traces. Our task was to learn how to identify these traces and interpret them correctly. Main functions:: Di
首先,值得强调的是,这个交易工具是非重绘、非重画和非滞后的指标,非常适合专业交易。 在线课程,用户手册和演示。 智能价格行动概念指标是一个非常强大的工具,既适用于新手,也适用于经验丰富的交易者。它将超过20个有用的指标合并到一个指标中,结合了高级交易思想,如内圈交易员分析和智能资金概念交易策略。该指标侧重于智能资金概念,提供有关大型机构交易方式的见解,帮助预测它们的动向。 它在流动性分析方面尤其擅长,有助于理解机构的交易方式。它擅长预测市场趋势,并仔细分析价格波动。通过将您的交易与机构策略对齐,您可以更准确地预测市场走向。该指标多才多艺,擅长分析市场结构,识别重要的订单区块,并识别各种模式。 它擅长识别BOS和CHoCH等模式,理解动量的转变,并突出显示供需强劲的关键区域。它还擅长发现强大的不平衡,并分析价格创造更高高点或更低低点的模式。如果您使用斐波那契回撤工具,该指标可以满足您的需求。它还可以识别相等的高点和低点,分析不同的时间框架,并通过仪表板显示数据。 对于使用更高级策略的交易者,该指标提供了工具,如公平价值差指标和优惠和折扣区域的识别。它特别关注高时间框架订单
Trend Screener Pro MT5
STE S.S.COMPANY
4.88 (64)
使用趋势筛选指标释放趋势交易的力量:由模糊逻辑和多货币系统提供支持的终极趋势交易解决方案! 使用趋势筛选器(由模糊逻辑提供支持的革命性趋势指标)提升您的趋势交易。 它是一个强大的趋势跟踪指标,结合了超过 13 种高级工具和功能以及 3 种交易策略,使其成为使您的 Metatrader 成为趋势分析器的多功能选择。 限时优惠:趋势筛选指标终身仅需 50 美元。 ( 原价 125$ ) (优惠延长) 体验趋势筛选器 100% 无需重新绘制的准确性,确保您的交易决策不受过去价格变化的影响。 释放多时间框架和多货币功能的多功能性,使您能够以无与伦比的信心在外汇、商品、加密货币和指数领域进行交易。 利用 Trend Screener 的综合策略套件增强您的交易: - 趋势跟踪策略和趋势延续策略 :趋势筛选器的趋势跟踪策略提供清晰的趋势延续信号,让您有效捕捉趋势走势并管理风险。 - 反转策略和早期入场点策略 :趋势筛选器的反转策略可检测市场方向的潜在变化,使您能够预测趋势反转并利用疲弱的市场趋势。通过早期入场点,您可以在潜在的趋势变化之前定位自己 获取可观的利润。 - 倒卖策略: 趋势筛选器的倒卖
FX Volume MT5
Daniel Stein
4.94 (17)
通过 mql5 和 Telegram 上 的 " 晨间简报 "获取每日市场更新,包括详细信息和屏幕截图 ! 外汇交易量(FX Volume)是第一个也是唯一一个从经纪商角度真正洞察市场情绪的交易量指标。 直接在您的图表上看到这些信息是真正改变游戏规则和突破性的交易解决方案。 受益于独特的市场数据洞察,如 比率(Ratios )显示货币多头和空头头寸的比率(百分比 比率变化 显示所选时间段内的多头比率及其百分比变化 总交易量 显示货币的总交易量(多头和空头),以手为单位 多头 交易量显示货币所有多头头寸的交易量 空头 交易量显示所有货币空头头寸的交易量 净多头 显示净多头交易量,即所有多头头寸减去所有空头头寸(以手为单位)。 净多头百分比 显示货币净多头交易量的变化 请阅读我们的基本教程 -> "如何使用外汇交易量进行交易 " 获取更多信息,如常见问题、交易技巧和教程视频,请访问我们的 外汇交易量公共信息频道 请 安装并运行 SI Connect 以建立与我们数据中心的持续连接 背景信息 我们都知道,外汇是一个分散的市场。这就是为什么我们必须打破常规思维,开发一个独
Gold Stuff mt5
Vasiliy Strukov
4.89 (179)
Gold Stuff mt5 是专为黄金设计的趋势指标,也可用于任何金融工具。 该指标不会重绘,也不会滞后。 推荐时间框架 H1。 购买后立即联系我以获得设置和个人奖励!   你可以在我的个人资料中找到它。   重要! 购买后立即与我联系,以获得说明和奖金!   您可以免费收到我们的强力支持和趋势扫描指标的副本,请私信。大部头书!   设置 绘制箭头 - 打开关闭。 在图表上绘制箭头。 警报 - 打开关闭声音警报。 电子邮件通知 - 打开关闭。 电子邮件通知。 Puch-notification - 打开关闭。 推送通知。 接下来,调整色域。 Gold Stuff mt5 是专为黄金设计的趋势指标,也可用于任何金融工具。 该指标不会重绘,也不会滞后。 推荐时间框架 H1。 购买后立即联系我以获得设置和个人奖励!   设置 绘制箭头 - 打开关闭。 在图表上绘制箭头。 警报 - 打开关闭声音警报。 电子邮件通知 - 打开关闭。 电子邮件通知。 Puch-notification - 打开关闭。 推送通知。 接下来,调整色域。
FX Power MT5 NG
Daniel Stein
5 (5)
通过 mql5 和 Telegram 上 的晨间简报获取每日市场更新,包括详细信息和屏幕截图 ! FX Power MT5 NG 是我们长期以来非常受欢迎的货币强度计算器 FX Power 的下一代产品。 这款下一代强度计算器能提供什么?您所喜爱的原版 FX Power 的所有功能 附加功能 黄金/XAU 强度分析 更精确的计算结果 可单独配置的分析周期 可自定义计算限制,以获得更好的性能 为希望查看更多信息的用户提供特殊的多实例设置 无尽的图形设置,可在每个图表中设置您最喜欢的颜色 无数的通知选项,让您再也不会错过任何重要信息 采用 Windows 11 和 macOS 风格的全新圆角设计 神奇的移动指标面板 FX Power 主要功能 所有主要货币的完整强势历史 所有时间框架内的货币强弱历史 所有经纪商和图表的计算结果完全相同 100% 可靠的实时计算 -> 无重绘 可通过下拉列表选择分析时段 通过自定义模式单独配置分析时段 可在一个图表中使用多个实例 可移动 FX Power 显示屏(通过拖放) 适用于高分辨率 QHD、UHD 和 4K 显示器 自动终端配置 针对平板电脑
XQ Indicator MetaTrader 5
Marzena Maria Szmit
5 (1)
Step into the realm of Forex trading with confidence and precision using XQ, a cutting-edge Forex indicator designed to elevate your trading game to unprecedented heights. Whether you're a seasoned trader or just stepping into the world of currency exchange, XQ Forex Indicator empowers you with the insights and signals needed to make informed trading decisions. The signal conditions are a combination of three indicators, and XQ Forex Indicator only display  medium and long-term trends . The ind
Entry Points Pro for MT5
Yury Orlov
4.55 (160)
这款指标用于 MT5,可提供准确的入场交易信号,且无重绘。 它可应用在任何金融资产:外汇、加密货币、贵金属、股票、指数。 它将提供极其精准的评估,并告诉您何时开仓和平仓的最佳时机。 观看 视频 (6:22),其中包含一个仅处理单一信号的示例,该信号即可值回指标购价! 大多数交易者在 Entry Points Pro 指标的帮助下,在第一个交易周内即改善了他们的交易结果。 订阅我们的 Telegram 群 ! Entry Points Pro 指标的益处。 入场信号无重绘 如果信号出现,并得到确认,则它不会再消失;不像是重绘指标,它会导致重大的财产损失,因为它们可以在显示信号后再将其删除。 无差错开仓 指标算法可令您找到入场交易(买入或卖出资产)的理想时机,从而提高每位交易者的成功率。 Entry Points Pro 可操作任何资产 它允许您在 MT5 平台上交易任何经纪商的加密货币、股票、贵金属、指数、大宗商品和货币。 提供任何方向的信号 Entry Points Pro 指标提供针对任意价格走势的入场交易信号 - 上涨、下跌或横盘(横向)。
ICT, SMC, SMART MONEY CONCEPTS, SMART MONEY, Smart Money Concept, Support and Resistance, Trend Analysis, Price Action, Market Structure, Order Blocks, BOS/CHoCH,   Breaker Blocks ,  Momentum Shift,   Supply&Demand Zone/Order Blocks , Strong Imbalance,   HH/LL/HL/LH,    Fair Value Gap, FVG,  Premium  &   Discount   Zones, Fibonacci Retracement, OTE, Buy Side Liquidity, Sell Side Liquidity, BSL/SSL Taken, Equal Highs & Lows, MTF Dashboard, Multiple Time Frame, BigBar, HTF OB, HTF Market Structure
成為突破者,隨著價格反轉,市場結構會改變利潤。 訂單突破者指示器可以識別趨勢或價格走勢何時接近枯竭並準備好逆轉。它會提醒您市場結構的變化,通常會在發生逆轉或重大回調時發生。 該指標使用專有計算來確定突破和價格動能。每當在可能的耗盡點附近形成新的高點時,指標就會繪製最後一個生成該高點的順序塊。然後,它將隨價格移動隨價格跟隨定單。然後,當價格轉向相反方向並突破該訂單塊時,它會提醒您,從而創建新的市場結構並開始趨勢或重大回調的可能逆轉。 訂單塊是在創建高/低之前的最後一個相反的彩色蠟燭,並且當價格跌破這些關鍵區域以下時,這表明趨勢可能會發生短期或長期反轉。 特徵 提醒您關鍵耗盡點的市場結構變化 價格接近耗盡水平時自動提取訂單塊 在一個方向繼續移動時,在價格後面跟踪定單,以提醒您最佳的反轉輸入 將顏色更改為純色塊,以顯示何時發生市場結構中斷。 適用於所有交易品種和時間範圍 內置集成的彈出窗口和電子郵件警報 策略和如何與定單破壞者指標進行交易 當斷路器塊發生時,您有兩個選擇。 看左邊!我們正在尋求供應/需求或支撐/阻力位嗎?市場結構轉變(逆轉)通常發生在價格重新測試舊水平或
Bill Williams Advanced
Siarhei Vashchylka
5 (6)
Bill Williams Advanced is designed for automatic chart analysis using Bill Williams' "Profitunity" system. The indicator analyzes four timeframes at once. Manual (Be sure to read before purchasing) Advantages 1. Automatically analyzes the chart using the "Profitunity" system of Bill Williams. The found signals are placed in a table in the corner of the screen. 2. Equipped with a trend filter based on the Alligator indicator. Most of the system signals are recommended to be used only accordi
AW Trend Predictor MT5
AW Trading Software Limited
4.78 (58)
一个系统中趋势和故障水平的组合。先进的指标算法过滤市场噪音,确定趋势、进入点以及可能的退出水平。指标信号记录在统计模块中,您可以选择最合适的工具,显示信号历史的有效性。该指标计算获利和止损标记。 手册和说明 ->   这里 / MT4 版本 ->   这里 如何使用指标进行交易: 使用趋势预测器进行交易只需三个简单的步骤: 第 1 步 - 开仓 收到买入信号,成功率超过 70% 第 2 步 - 确定止损 通过相反的信号选择中继线 第 3 步 - 定义止盈策略 策略一:达到 TP1 时平仓 策略 2:达到 TP1 时平仓 50%,达到 TP2 时平仓剩余 50% 策略三:在趋势反转时平仓 好处: 从不重绘结果,信号严格位于蜡烛收盘时 它可以在顾问中使用 获利和止损标记 对交易策略或独立策略的重要补充 市场噪音过滤算法 适用于任何工具 统计模块: 为了更好地选择配对,请使用内置的统计计算。 计算交易 - 给出统计数据的信号总数 成功评级 - 达到 TP1 的信号百分比,或反转那些正获利的信号时的百分比 TakeProfit1 Hit - 达到 TP1 的信号百分比 TakeProfit2
TrendMaestro5
Stefano Frisetti
note: this indicator is for METATRADER4, if you want the version for METATRADER5 this is the link:  https://www.mql5.com/it/market/product/108106 TRENDMAESTRO ver 2.4 TRENDMAESTRO recognizes a new TREND in the bud, he never makes mistakes. The certainty of identifying a new TREND is priceless. DESCRIPTION TRENDMAESTRO identifies a new TREND in the bud, this indicator examines the volatility, volumes and momentum to identify the moment in which there is an explosion of one or more of these data a
介绍     Quantum Breakout PRO   ,突破性的 MQL5 指标,正在改变您交易突破区域的方式!由拥有超过13年交易经验的资深交易员团队开发,     量子突破 PRO     旨在通过其创新和动态的突破区域策略将您的交易之旅推向新的高度。 量子突破指标将为您提供带有 5 个利润目标区域的突破区域的信号箭头,以及基于突破框的止损建议。 它既适合新手交易者,也适合专业交易者。 量子 EA 通道:       点击这里 重要的!购买后请私信我领取安装手册。 建议: 时间范围:M15 货币对:GBPJPY、EURJPY、USDJPY、NZDUSD、XAUUSD 账户类型:ECN、Raw 或 Razor,点差极低 经纪商时间:GMT +3 经纪商:IC Markets、Pepperstone with Raw 和 Razor 的点差最低 规格: 不重漆! 最多 5 个建议利润目标区域 建议止损水平 可定制的盒子。您可以设置自己的 Box Time Start 和 Box Time End。 接触 如果您有任何疑问或需要帮
The 1 2 3 Pattern Scanner MT5
Reza Aghajanpour
5 (14)
** All Symbols x All Timeframes scan just by pressing scanner button ** ***Contact me after purchase to send you instructions and add you in "123 scanner group" for sharing or seeing experiences with other users. After 17 years of experience in the markets and programming, Winner indicator is ready. I would like to share with you! Introduction The 123 Pattern Scanner indicator with a special enhanced algorithm is a very repetitive common pattern finder with a high success rate . Interestingly,
Quantum Heiken Ashi PRO MT5
Bogdan Ion Puscasu
4.5 (8)
Quantum Heiken Ashi PRO 简介 Heiken Ashi 蜡烛旨在提供对市场趋势的清晰洞察,以其过滤噪音和消除虚假信号的能力而闻名。告别令人困惑的价格波动,迎接更流畅、更可靠的图表表示。 Quantum Heiken Ashi PRO 的真正独特之处在于其创新公式,它将传统烛台数据转换为易于阅读的彩色条。红色和绿色条分别优雅地突出了看跌和看涨趋势,让您能够以非凡的精度发现潜在的进入和退出点。 量子 EA 通道:       点击这里 MT4版本:       点击这里 这一卓越的指标具有以下几个关键优势: 增强清晰度:通过平滑价格波动,Heiken Ashi 金条可以更清晰地反映市场趋势,使您更容易识别有利的交易机会。 减少噪音:告别经常导致错误信号的不稳定价格变动。 Quantum Heiken Ashi 指标可过滤噪音,使您能够做出更明智的交易决策 无缝集成:Heiken Ashi 指标专为 MetaTrader 开发,可无缝集成到您的交易平台中。它用户友好、高度可定制,并且与您的其他交易指标和过滤器兼容 无论您是寻求新优势的经验丰富的交易者,
Golden Gate Algo MT5
James David Lane
4 (6)
40% 圣诞优惠!价格将于1月1日涨至$250! 推出GoldenGate Entries:前沿交易解决方案! 发现与GoldenGate Entries(GGE)一同进行交易的革命性方法,这是一款设计用于提升您交易体验的先进指标。GGE提供了一套全面的功能,以赋予用户在交易决策中的精准和信心。 交易对:任意(外汇 - 商品 - 股票 - 股票 - 加密货币) 时间框架:15分钟至H1 主要特点: 买入和卖出箭头指示:接收伴随弹出警报的买入和卖出箭头指示,确保您随时保持了解。 GoldenGate_Algo:通过GoldenGate_Algo深入了解市场状况,这是一款强大的工具,用于评估市场是否处于“超卖”或“超买”状态。 当前趋势分析:通过访问您正在查看的时间框架上的当前趋势,保持领先地位,使您能够将交易与市场当前方向对齐。 内置枢轴点:使用内置的枢轴点轻松识别关键市场点,提供有价值的支撑和阻力水平。 蜡烛扫描器:分析蜡烛形态和图案,找到最佳的入场点并过滤掉低概率的入场。 完全定制:通过完整的定制选项,完全掌控您的交易体验,允许您个性化从
TPA True Price Action indicator reveals the true price action of the market makers through 100% non-repainting signals strictly at the close of a candle! TPA shows entries and re-entries, every time the bulls are definitely stronger than the bears and vice versa. Not to confuse with red/green candles. The shift of power gets confirmed at the earliest stage and is ONE exit strategy of several. There are available now two free parts of the TPA User Guide for our customers. The first "The Basics"
Blahtech Market Profile MT5
Blahtech Limited
5 (8)
Was: $249  Now: $99   Market Profile defines a number of day types that can help the trader to determine market behaviour. A key feature is the Value Area, representing the range of price action where 70% of trading took place. Understanding the Value Area can give traders valuable insight into market direction and establish the higher odds trade. It is an excellent addition to any system you may be using. Inspired by Jim Dalton’s book “Mind Over Markets”, this indicator is designed to suit the
Legacy of Gann for MT5
Pavel Zamoshnikov
5 (6)
The indicator very accurately determines the levels of the possible end of the trend and profit fixing. The method of determining levels is based on the ideas of W.D.Gann, using an algorithm developed by his follower Kirill Borovsky. Extremely high reliability of reaching levels (according to K. Borovsky  - 80-90%) Indispensable for any trading strategy – every trader needs to determine the exit point from the market! Precisely determines targets on any timeframes and any instruments (forex, met
Auto Order Block with break of structure based on ICT and Smart Money Concepts (SMC) Futures Break of Structure ( BoS )             Order block ( OB )            Higher time frame Order block / Point of Interest ( POI )    shown on current chart           Fair value Gap ( FVG ) / Imbalance   -  MTF      ( Multi Time Frame )    HH/LL/HL/LH  -  MTF      ( Multi Time Frame )  Choch  MTF      ( Multi Time Frame )  Volume Imbalance     ,  MTF          vIMB Gap’s Power of 3 Equal High
Easy Buy Sell Signal Alert
Franck Martin
4.86 (7)
Easy By Sell is a market indicator for opening and closing positions. It becomes easy to track market entries with alerts. It indicates trend reversal points when a price reaches extreme values ​​and the most favorable time to enter the market. it is as effective as a Fibonacci to find a level but it uses different tools such as an algorithm based on ATR indicators and Stochastic Oscillator. You can modify these two parameters as you wish to adapt the settings to the desired period. My othe
Fractal Advanced MT5
Siarhei Vashchylka
5 (3)
Fractal Advanced - displays Fractal and Alligator indicators on the price chart. Has wide options for settings and customization. It is also equipped with alerts and a hotkey system. Manual (Be sure to read before purchasing) | Version for MT4 Advantages 1. The indicator does not fill the entire chart with fractals, but allows you to display only relevant signals. 2. The number of fractals is adjusted by scrolling the mouse while holding down the Shift key. 3. Instantly show/hide the Alligator
首先值得强调的是,这个交易系统是一个不重绘、不重画和不滞后的指标,这使它非常适合专业交易。 在线课程,用户手册和演示。 “智能支撑和阻力交易系统”是专为新手和经验丰富的交易者量身定制的先进指标。它赋予交易者在外汇市场上精确和自信的能力。这个综合系统结合了7+种策略、10个指标和各种交易方法,包括日内交易策略、波段交易策略、支撑和阻力策略、蜡烛图模式策略、VWAP策略、多时间段趋势策略等。它提供箭头信号、入场和出场点、交易警报、更高时间框架的趋势分析、实时交易监控以及见解深刻的趋势和成交量蜡烛染色。通过自动支撑和阻力检测,这是一个多面手的指标,帮助交易者在不同的市场条件下做出明智的决策。 “智能支撑和阻力交易系统”是一个强大的技术分析方法,融合了一套高端和强大的指标和工具。在其核心,这个系统识别关键的支撑和阻力水平,这些水平作为潜在市场反转或延续的关键区域。该系统无缝集成了多时间框架趋势面板,增强了交易者在不同时间框架下评估当前趋势方向的能力。此外,蜡烛图模式检测器扫描价格图表以获取重要的蜡烛图模式,为潜在的市场走势提供宝贵的见解。此外,VWAP(成交量加权平均价格)的加入
Gartley Hunter Multi
Siarhei Vashchylka
5 (7)
Gartley Hunter Multi - An indicator for searching for harmonic patterns simultaneously on dozens of trading instruments and on all possible timeframes. Manual (Be sure to read before purchasing) | Version for MT4 Advantages 1. Patterns: Gartley, Butterfly, Shark, Crab. Bat, Alternate Bat, Deep Crab, Cypher 2. Simultaneous search for patterns on dozens of trading instruments and on all possible timeframes 3. Search for patterns of all possible sizes. From the smallest to the largest 4. A
IX Power MT5
Daniel Stein
5 (3)
IX Power 终于将 FX Power 的无与伦比的精确性带到了非外汇交易符号中。 它能准确判断您喜爱的指数、股票、商品、ETF 甚至加密货币的短期、中期和长期趋势强度。 您可以 分析 终端提供的 一切 。试试吧,体验一下您在交易时如何把握 时机 。 IX Power 主要功能 100% 精确的非重绘计算结果 - 适用于您终端中的所有交易符号 下拉式选择预配置以及可单独配置的强度分析周期 通过电子邮件、消息和手机通知的无数种通知选项 可访问的 EA 请求缓冲区 可自定义计算限制,以获得更好的性能 为希望查看更多信息的用户提供特殊的多实例设置 无尽的图形设置,让您在每个图表中都能找到最喜欢的颜色 采用 Windows 11 和 macOS 风格的圆角新面板设计 神奇的移动指标面板,可在子窗口和主图表之间无缝移动 适用于高分辨率 QHD、UHD 和 4K 显示器,并针对平板电脑和触摸屏进行了优化 IX Power 参数 最重要的参数不言自明,但我们很快会在另一篇文章中为您提供所有 IX Power 参数的完整说明。 使用别名 "参数可为技术交易符号
作者的更多信息
Market Noise MT4
Ivan Butko
5 (1)
Market Noise 市場噪音是確定價格圖表上的市場階段的指標,並且還可以在累積或派發階段發生時區分清晰平滑的趨勢運動和嘈雜的平坦運動。 每個階段都適合自己的交易類型:趨勢適合趨勢追蹤系統,平坦適合激進型交易。 當市場噪音開始時,您可以決定退出交易。 同樣,反之亦然,一旦噪音結束,您就需要關閉激進的交易系統。 有人可以使用兩種類型的交易策略進行交易,從一種策略切換到另一種策略。 因此,該指標在交易決策領域中扮演了好助手的角色。 任何價格變動都可以分為兩個部分 - 選定時間段內的總體價格變動以及該時間段內以價格波動形式出現的噪音。 同時,不同時期的不同市場可以表現出噪音和趨勢成分之間廣泛的相互關係(圖1)。 價格變動的噪音水平越高,辨別潛在趨勢的方向和強度就越困難。 因此,在這種情況下有必要使用較慢的趨勢識別方法。 另一方面,在低噪音水平的市場中,主要趨勢很容易確定,並且更快的確定趨勢的方法是合理的,確保價格方向變化的交易訊號的滯後最小。 為了確定市場狀態,使用高級效率比 (ER),該比率基於特定時期內總價格變動與噪音市場變動總和的指數比較。效率比 (ER) 可以變化從0到1。
Fractals Dynamic
Ivan Butko
5 (1)
Fractals Dynamic Fractals Dynamic  –  是 Bill Williams 改進的免費分形指標,您可以在其中手動設定左側和右側的柱形數量,從而在圖表上建立獨特的模式。  现在所有基于或基于分形动态指标的交易策略都将有一个额外的信号。 此外,分形可以充当支撑位和阻力位。 在一些交易策略中,显示流动性水平。 为此,在这个版本的多分形和多帧指标 MultiFractal Levels 中引入了水平。 您会发现这个指标在任何价格图表上作为您交易的助手更具信息性,视觉性和实用性。 使用分形動態指標作為您交易系統的補充 也試試我在市面上的其他產品 https://www.mql5.com/ru/users/capitalplus/seller 祝您在交易中獲得豐厚的利潤!
FREE
Fractals Dynamic Fractals Dynamic  –  是 Bill Williams 改進的免費分形指標,您可以在其中手動設定左側和右側的柱形數量,從而在圖表上建立獨特的模式。  现在所有基于或基于分形动态指标的交易策略都将有一个额外的信号。 此外,分形可以充当支撑位和阻力位。 在一些交易策略中,显示流动性水平。 为此,在这个版本的多分形和多帧指标 MultiFractal Levels 中引入了水平。 您会发现这个指标在任何价格图表上作为您交易的助手更具信息性,视觉性和实用性。 使用分形動態指標作為您交易系統的補充 也試試我在市面上的其他產品   https://www.mql5.com/ru/users/capitalplus/seller 祝您在交易中獲得豐厚的利潤!
FREE
TimeBar
Ivan Butko
5 (1)
TimeBar TimeBar 是一個簡單的資訊指示器,顯示柱關閉之前的剩餘時間,以及柱打開以來經過的時間和當前時間。 為了便於感知,增加了兩種顯示方式:以圖形左上角註釋的形式,或以圖形物件的形式。 優點 字體選擇 字體大小。 您可以設定任何一項。 評論的時候太小了 您可以移動物體。 雙擊滑鼠可以選擇任何時間並移動到圖表上的任何位置,它將照常繼續更新 視覺警報。 您可以設定指定的秒數,直到目前柱關閉,達到該時間後,時間將變成設定中指定的警告顏色 設定 選擇顯示的時間 每次的顏色(對於圖形物件) 一則警報,通知您酒吧即將關閉 使用 TimeBar 指標作為您交易系統的補充 使用連結嘗試我在市場上的其他產品  https://www.mql5.com/ru/users/capitalplus/seller  
FREE
MinMax Levels MinMax Levels  –  是重要交易時段(日、週和月)的最高、最低和開盤價格水準的指標。 每個外匯市場參與者都在其交易系統中使用等級。 它們可以是進行交易的主要訊號,也可以是作為分析工具的附加訊號。  在該指標中,選擇日、週和月作為重要時段,因為它們是大型市場參與者的關鍵交易時段。 如您所知,價格從一個水平移動到另一個水平,了解相對於重要水平的價格位置有助於做出交易決策。  為了方便起見,新增了按鈕來啟用和停用這兩個等級本身,並折疊按鈕以釋放價格圖表工作視窗中的空間。  每個外匯市場參與者都在其交易系統中使用等級。 它們可以是進行交易的主要訊號,也可以是作為分析工具的附加訊號。  在該指標中,選擇日、週和月作為重要時段,因為它們是大型市場參與者的關鍵交易時段。 如您所知,價格從一個水平移動到另一個水平,了解相對於重要水平的價格位置有助於做出交易決策。  為了方便起見,新增了按鈕來啟用和停用這兩個等級本身,並折疊按鈕以釋放價格圖表工作視窗中的空間。 此指標的優點: 方便 能見度 資訊內容  最新等級  可自訂的級別 此指標很方便,因為您
Palantir
Ivan Butko
Palantir 指標根據使用者在設定中指定的點數來預測價格反轉。 您選擇感興趣的趨勢大小,指標將預測價格從最近的極值向相反方向移動指定點數的機率。 此指標的運行基於歷史趨勢的統計計算。 Palantir 根據設定中指定的大小分析歷史趨勢,收集統計資料並根據這些資料產生結果。 例如,您將趨勢大小設定為 500 點。 此指標分析修正幅度不超過 500 點的趨勢。 然後將最新(當前)趨勢與歷史趨勢進行比較,並顯示當前趨勢在歷史中佔據的位置。 指標讀數高於50%表示當前趨勢大於歷史趨勢的一半,反之亦然。 此外,50% 的水平是中位數,在該水平附近最常發生趨勢反轉。 70/80/90% 及以上的讀數也顯示趨勢強度較高。 考慮了最新的 300 個歷史趨勢。 預測趨勢的大小取決於載入的歷史記錄。 對於太大(數千點)的趨勢,可能根本沒有足夠的歷史報價。 因此,如果指標沒有足夠的歷史記錄用於計算,它將在日誌中通知您。 最佳趨勢大小等於平均每日價格波動率。 例如,歐元兌美元貨幣對最高可達 120.0 點。 小心! 高於平均值的值也可能表示強勁的趨勢;在這種情況下,指標讀數可能很高,但這不會反映市場
Market Noise 市場噪音是確定價格圖表上的市場階段的指標,並且還可以在累積或派發階段發生時區分清晰平滑的趨勢運動和嘈雜的平坦運動。 每個階段都適合自己的交易類型:趨勢適合趨勢追蹤系統,平坦適合激進型交易。 當市場噪音開始時,您可以決定退出交易。 同樣,反之亦然,一旦噪音結束,您就需要關閉激進的交易系統。 有人可以使用兩種類型的交易策略進行交易,從一種策略切換到另一種策略。 因此,該指標在交易決策領域中扮演了好助手的角色。 任何價格變動都可以分為兩個部分 - 選定時間段內的總體價格變動以及該時間段內以價格波動形式出現的噪音。 同時,不同時期的不同市場可以表現出噪音和趨勢成分之間廣泛的相互關係(圖1)。 價格變動的噪音水平越高,辨別潛在趨勢的方向和強度就越困難。 因此,在這種情況下有必要使用較慢的趨勢識別方法。 另一方面,在低噪音水平的市場中,主要趨勢很容易確定,並且更快的確定趨勢的方法是合理的,確保價格方向變化的交易訊號的滯後最小。 為了確定市場狀態,使用高級效率比 (ER),該比率基於特定時期內總價格變動與噪音市場變動總和的指數比較。效率比 (ER) 可以變化從0到1。
Currency Strength Dynamic 貨幣強弱動態是貨幣強弱的指標。 貨幣強度是指某種貨幣所屬的大多數或所有貨幣對的趨勢方向。 該指標基於 28 種最受歡迎的貨幣對(主要貨幣對和次要貨幣對)的移動平均線之間的差異讀數,類似於 MACD 指標。 優點 獨特的振盪計算方法 可用按鈕停用或啟用特定貨幣行 資訊表 2 種類型的警報:當指標線交叉時和當指標線交叉指定水平時。 繪製的條數是可選的。 讓我們詳細看看每一點: 獨特的振盪計算方法使指標不會長時間保持在最大值,而是提前退出它們,類似於熟悉的背離和收斂效果。 該方法還包括指定的計算週期和讀數的平滑程度,這使得讀數更加平滑。 計算中不包含不必要的混亂和不必要的冗餘公式,因此減少了終端的負載。 使用按鈕來停用或啟用特定貨幣行是最方便的功能之一,因為它可以讓您擺脫未使用的貨幣,或者只是在視覺上提高您的可見性。 資訊板是該指標的另一個便利功能;它不僅反映了線條的數值讀數,還反映了高級 TF 的讀數。 此外,還有最後走勢方向的箭頭,以及指示哪些貨幣交叉的垂直配對符號。 最後的運動箭頭記錄了倒數第二根柱上的運動 - 這是一個
MultiFractal Levels MultiFractal Levels – 這是經過修改的 Bill Williams 分形指標,增加了等級。 分形是根據設定中允許的所有 TF 建構的。 水平僅基於尚未經過價格測試的最新分形構建。 與原廠終端指示器相比的優點: 方便 能見度 資訊性 最新等級 可自訂的分形 可自訂的級別 此指標很方便,因為您在工作時無需切換到不同的時間範圍。 可見度 - 在一張圖表中,您可以看到從小到中、大市場走勢的圖表結構。 資訊內容-從視覺上我們獲得更多有關圖形的資訊。 自訂分形可以從兩側進行更改:可以在設定中指定左側和右側的條形數量。 可變更可自訂的水平:根據極值繪製,或根據訊號陰影(中央蠟燭)繪製為區域。 因此,如果舊 TF 的分形具有較大的陰影,則當前 TF 上的符號將很大。 現在,所有基於或基於多重分形指標的交易策略都將具有附加訊號。 此外,分形可以充當支撐位和阻力位。 並且在一些交易策略中,顯示流動性水準。 為此,引入了層次。 使用多重分形水平指標作為您交易系統的補充 也試試我在市面上的其他產品 https://ww
MinMax Levels MinMax Levels  –  是重要交易時段(日、週和月)的最高、最低和開盤價格水準的指標。 每個外匯市場參與者都在其交易系統中使用等級。 它們可以是進行交易的主要訊號,也可以是作為分析工具的附加訊號。  在該指標中,選擇日、週和月作為重要時段,因為它們是大型市場參與者的關鍵交易時段。 如您所知,價格從一個水平移動到另一個水平,了解相對於重要水平的價格位置有助於做出交易決策。  為了方便起見,新增了按鈕來啟用和停用這兩個等級本身,並折疊按鈕以釋放價格圖表工作視窗中的空間。  每個外匯市場參與者都在其交易系統中使用等級。 它們可以是進行交易的主要訊號,也可以是作為分析工具的附加訊號。  在該指標中,選擇日、週和月作為重要時段,因為它們是大型市場參與者的關鍵交易時段。 如您所知,價格從一個水平移動到另一個水平,了解相對於重要水平的價格位置有助於做出交易決策。  為了方便起見,新增了按鈕來啟用和停用這兩個等級本身,並折疊按鈕以釋放價格圖表工作視窗中的空間。 此指標的優點: 方便 能見度 資訊內容  最新等級  可自訂的級別 此指標很方便,因為您
筛选:
无评论
回复评论
版本 1.2 2023.11.05
Technical fixes