Maximum Minimum Strata
- 实用工具
- Harold Gilberto Marulanda
- 版本: 3.5
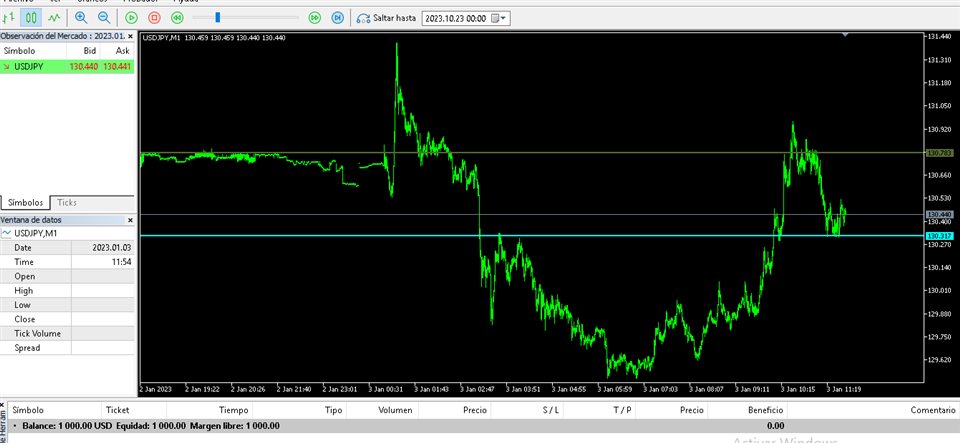
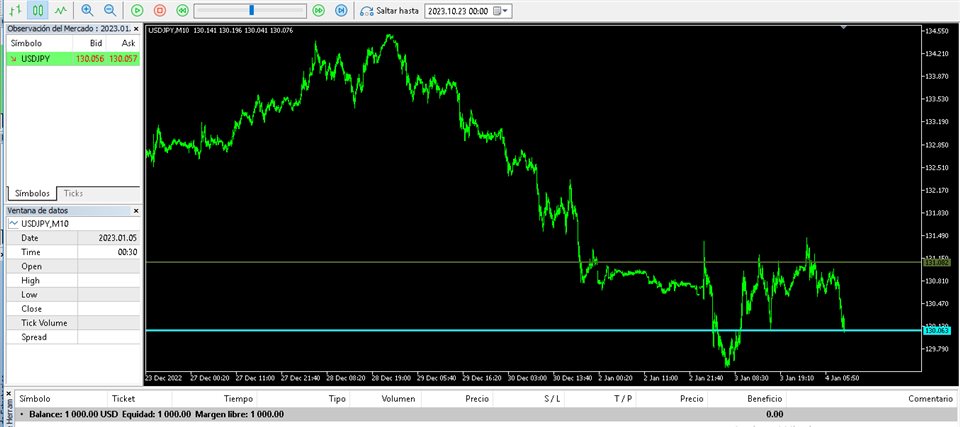
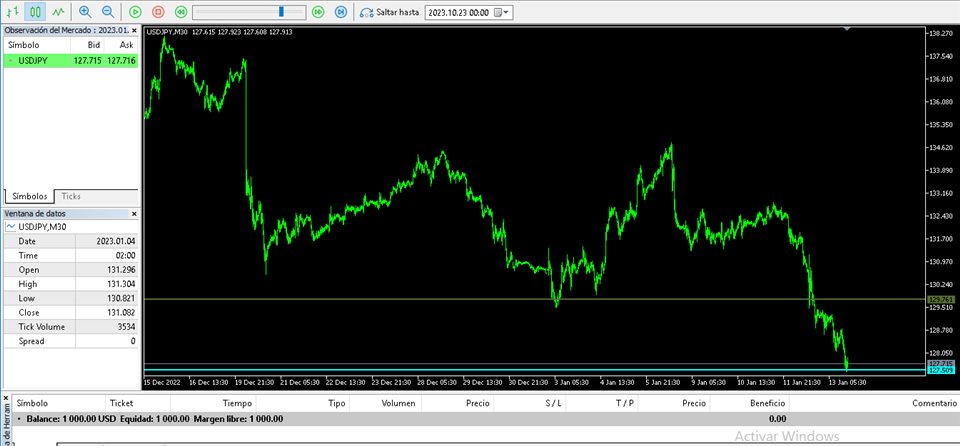
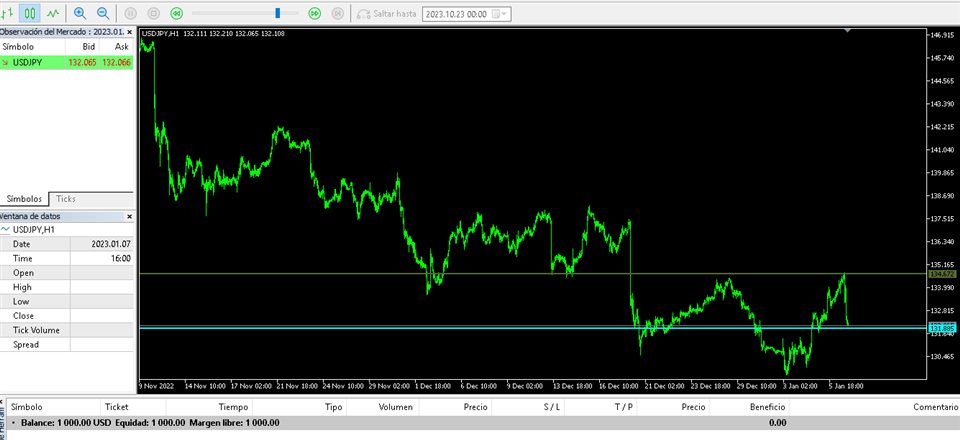
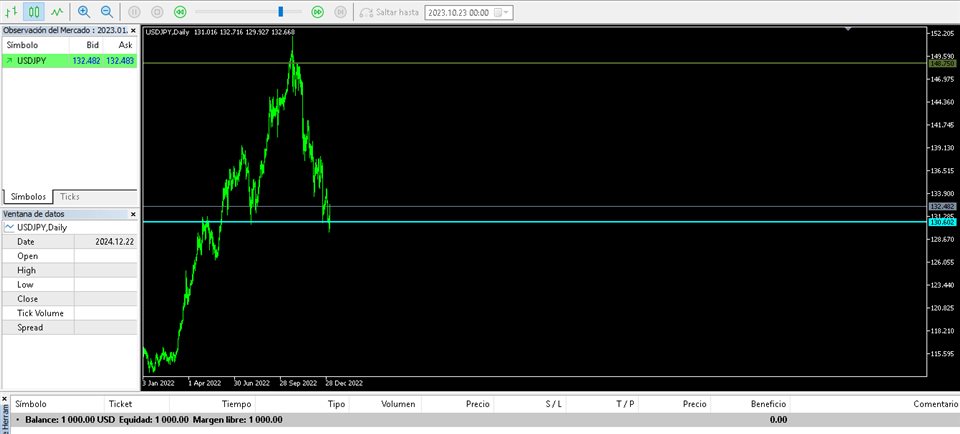
The Maximun Minimun Strata (100 bars and any period) is used to identify key levels on a price chart, which can be useful in technical analysis and decision making in trading:
Identify Key Levels: They help identify support and resistance levels on a price chart. The support level represents a minimum floor at which the price tends to bounce upwards, while the resistance level represents a maximum ceiling at which the price tends to bounce downwards.
Decision Making: Traders use these key levels to make informed trading decisions. For example, they can use support levels to set entry points for bullish trades and resistance levels to set entry points for bearish trades.
Risk Management: Support and resistance levels are also useful in risk management. Traders often place stop-loss orders near support and resistance levels to limit losses in case the price moves against their positions.
Trend Identification: Helps identify the direction of the current trend. When the price breaks a resistance level, it can suggest an uptrend, and when it breaks a support level, it can indicate a downtrend.
Confirmation of Signals: Support and resistance levels can be used to confirm signals generated by other technical indicators. For example, a buy signal backed by a bounce from a support level can be considered stronger.
Target Planning: Resistance levels can help traders identify points where they can consider taking profits on their bullish positions.
Volatility Analysis: These levels can also provide information about market volatility. If the support and resistance levels hold firm for an extended period, it may indicate that the market is in a consolidation range.
Analysis of Retracements and Extensions: Use these levels to identify possible retracements and extensions in the price. For example, once price breaks a resistance level, that previously resistant level can act as support on future rises.
