Psychological Oscillator MT5
- 指标
- Andrei Salanevich
- 版本: 1.1
- 激活: 5
心理振荡器MT5外汇指标是经典振荡器的一个很好的修改,这将帮助你在交易的MetaTrader5。
有关指标的信息
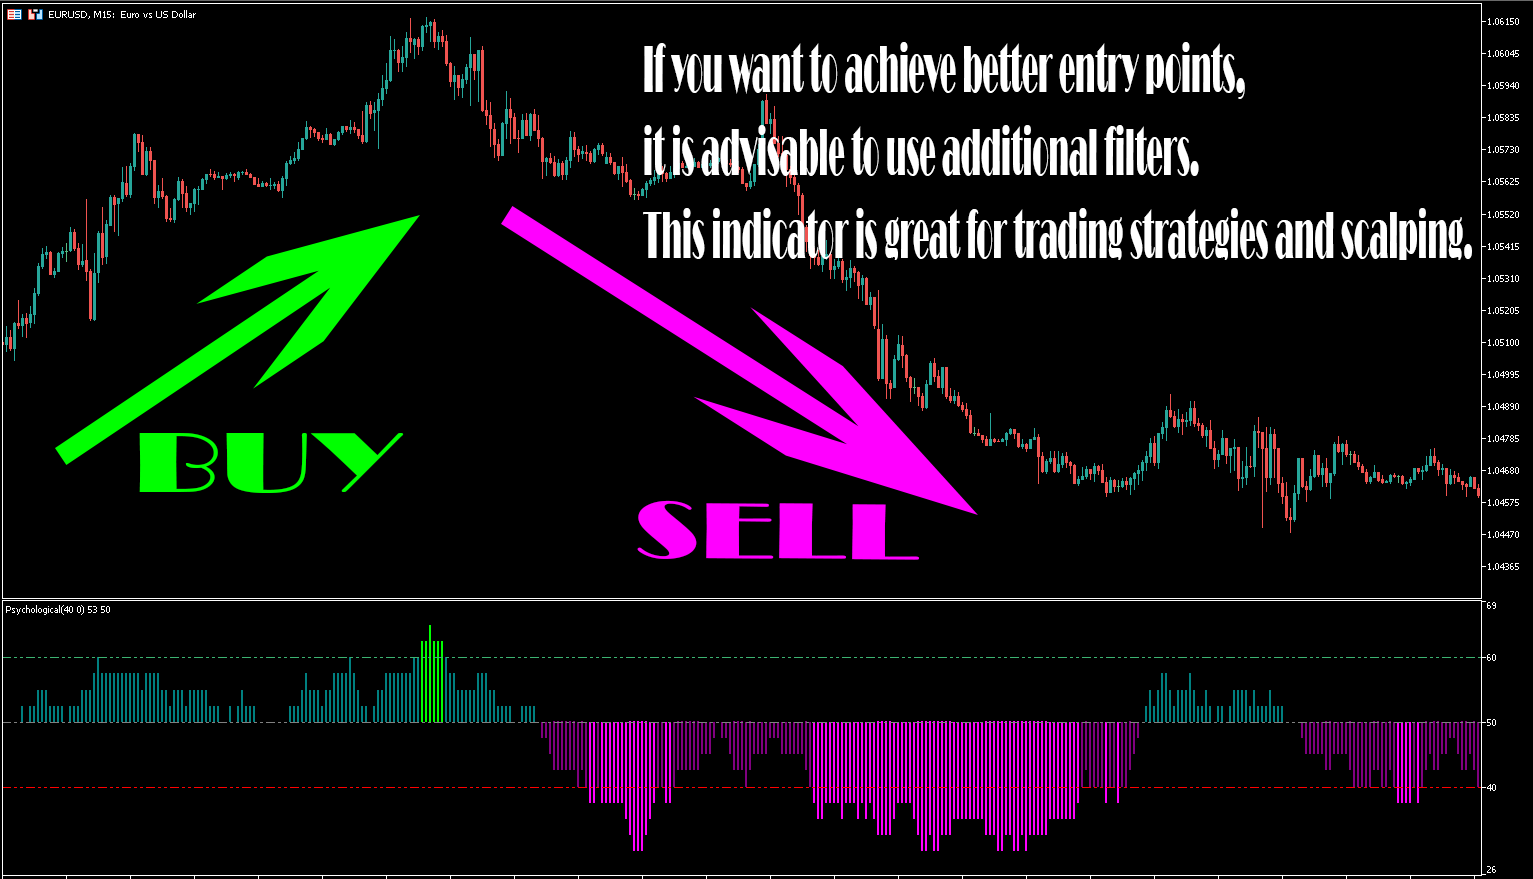
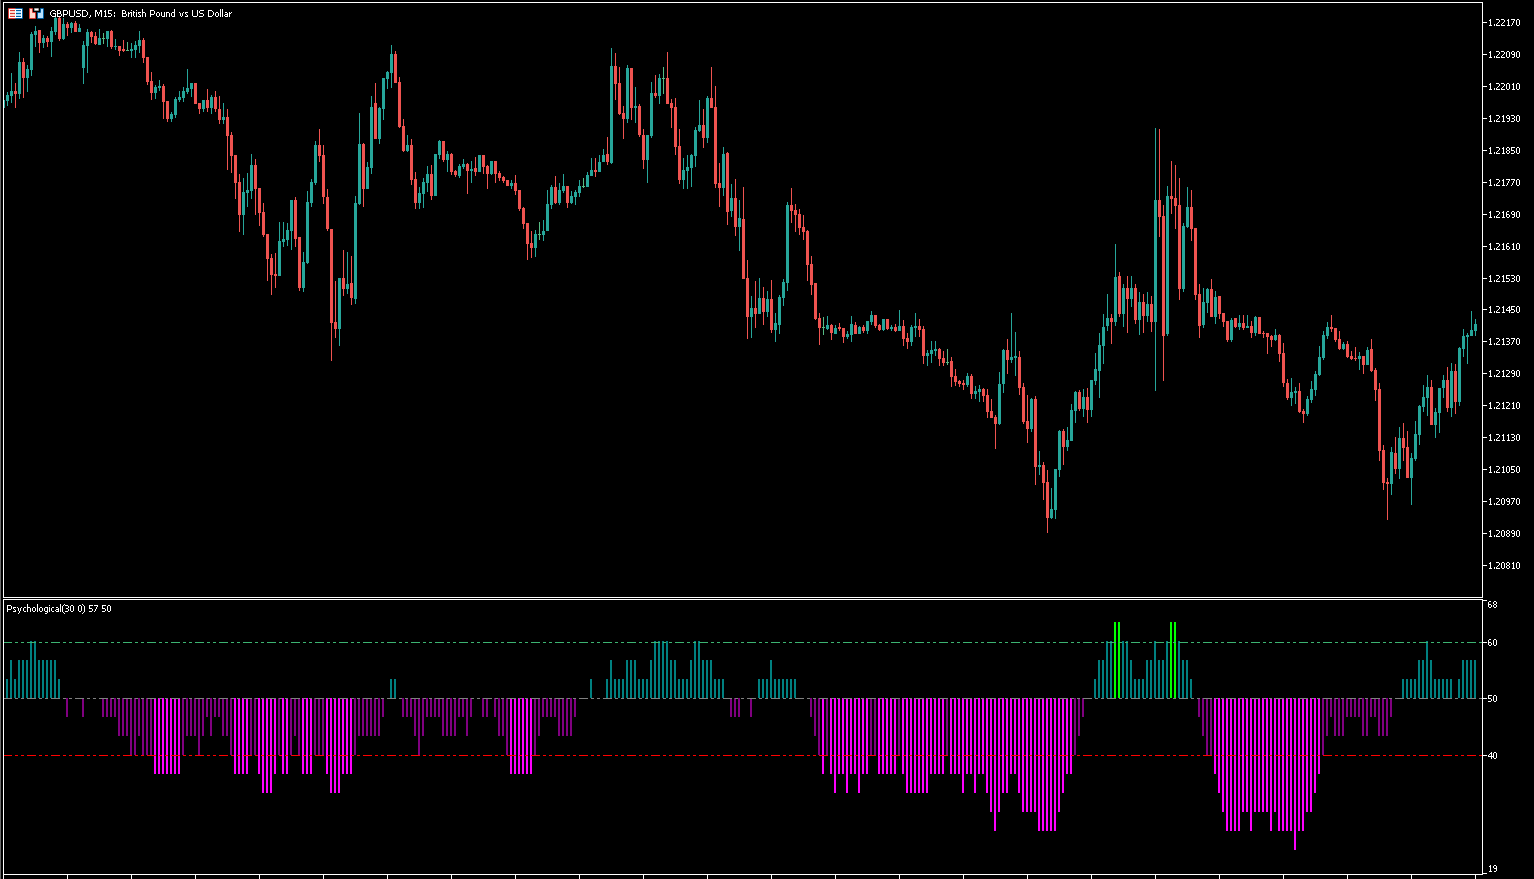
心理振荡器MT5外汇指标以颜色直方图的形式呈现,具有外汇振荡器的所有品质。
还有一些区域,市场所在的时间和区域。
一切都尽可能简单明了地完成,以便所有交易者都可以毫无困难地了解它。
如何使用指标
心理振荡器MT5外汇指标,由于它的简单性,建议新手交易者。 结合趋势指标,它可以成为外汇交易策略的关键要素之一。
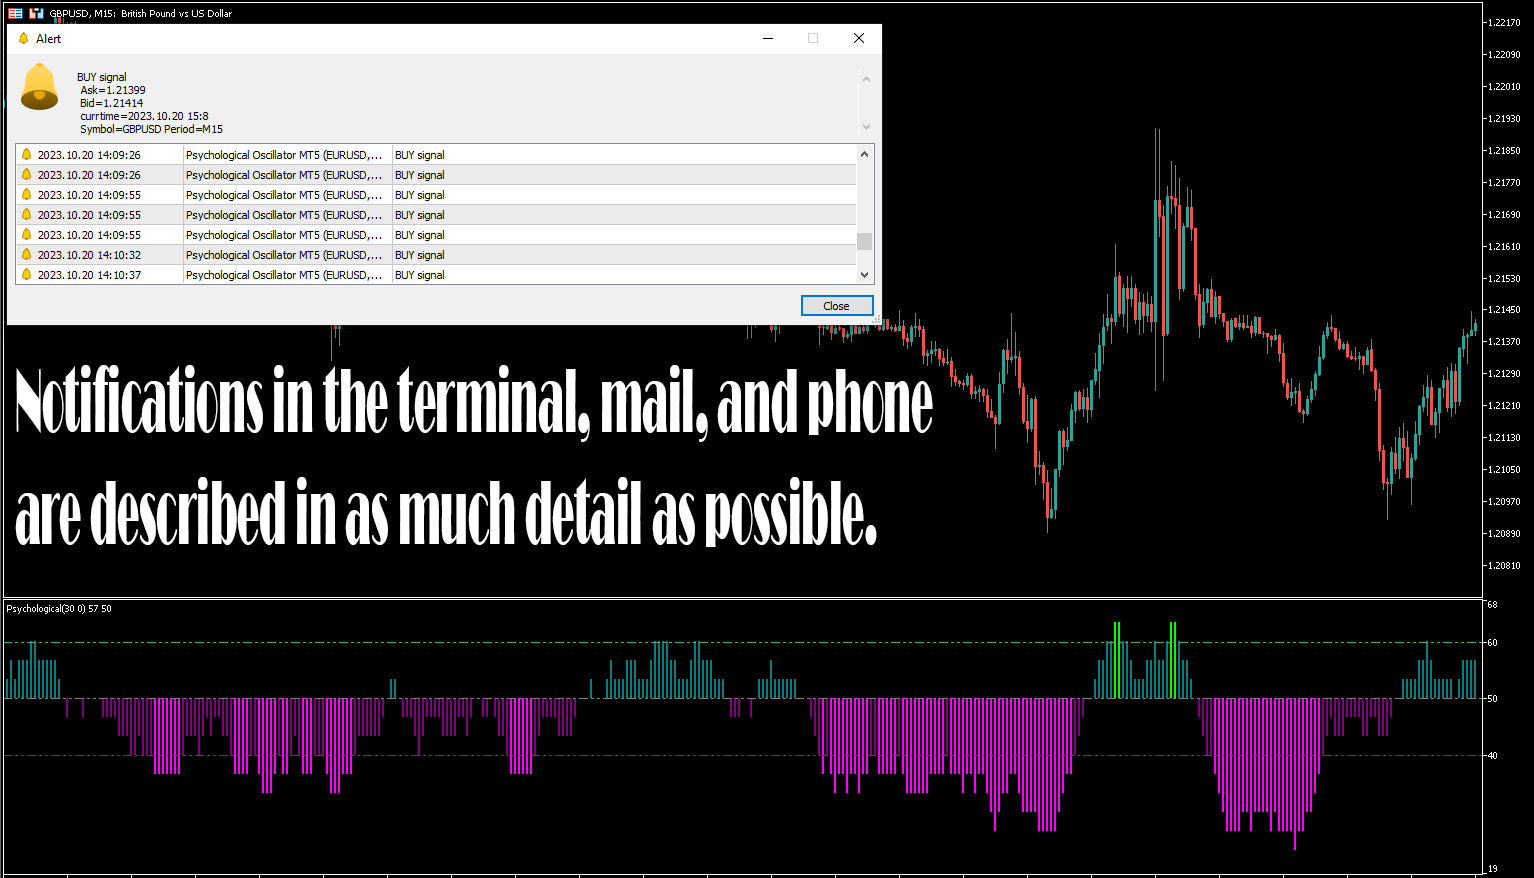
这个指标心理振荡器MT5也有一个内置的通知系统,使交易者可以快速评估市场。 您可以在下面的屏幕截图中阅读有关此的更多信息。
心理振荡器MT5指示器显示文本和音频警报,还可以通过电子邮件和短信发送有关以下事件的消息:
超买区域细分;
超买区域的趋势;
指标中线的细分是买入趋势的开始;
超买区域外的买入趋势延续;
超卖区域外的卖出趋势延续;
指标中线的细分是卖出趋势的开始;
超卖区的趋势;
超卖区域的细分。
通过这样的一组通知,交易者永远不会错过指标的重要信号。 您可以随时调整它以适应自己。 正如你所看到的,该指标通知你几乎所有的市场变化,这在今天是非常有用的,没有它你就赚不了多少钱。 您可以在屏幕截图中阅读有关买入和卖出信号的更多信息。 它以颜色突出显示何时出售和何时购买。
建议的时间表。 指标适合所有时间间隔。 唯一改变的是设置。 该指标也非常适合倒票。
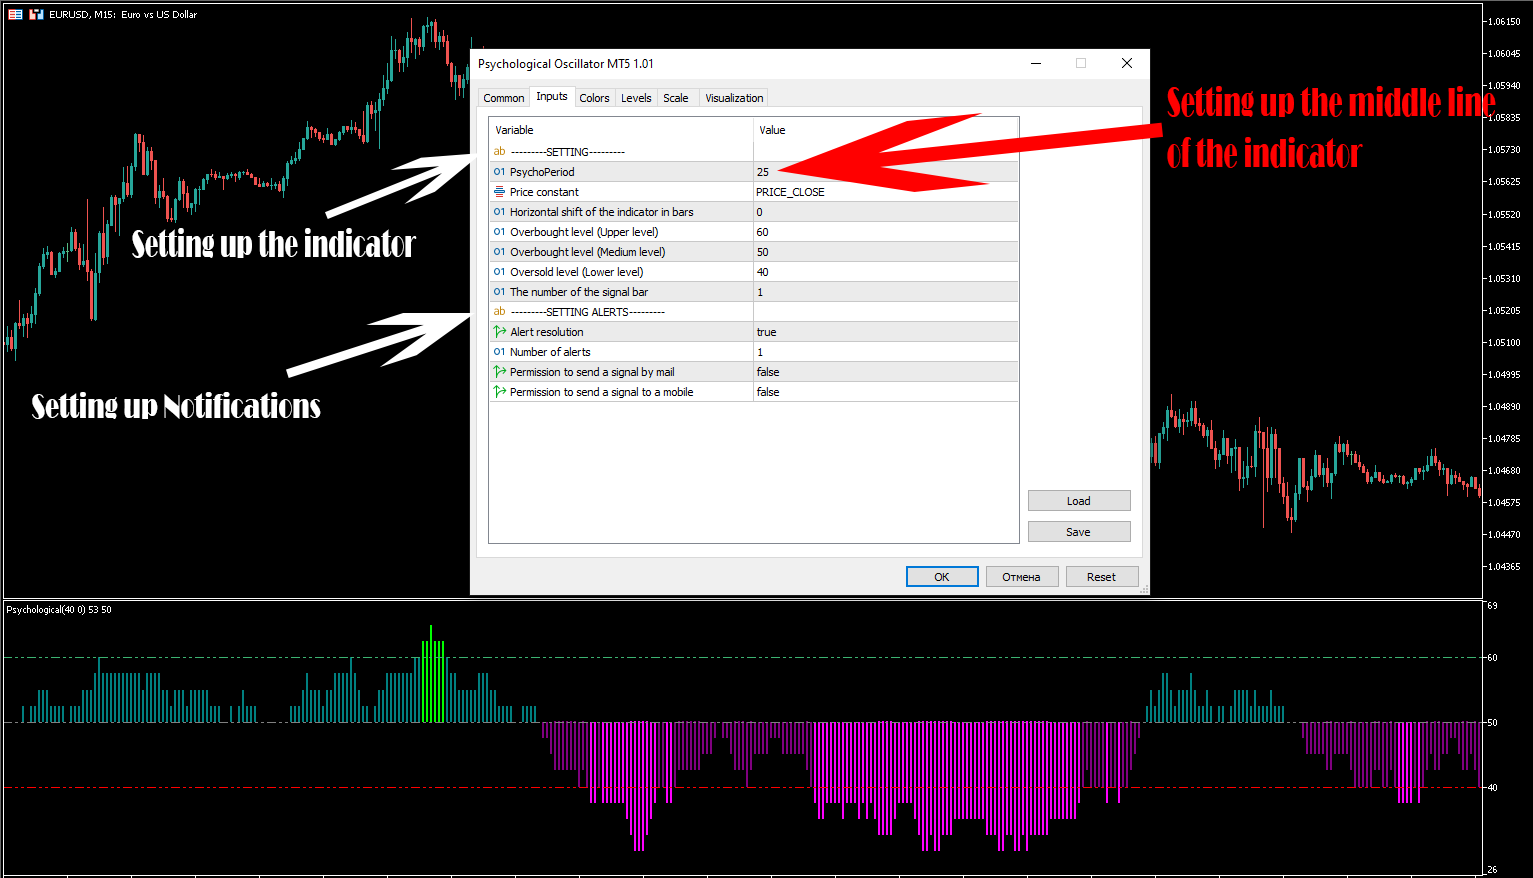
指示器设置
---------设置---------
精神病患者-指标中心线的变化
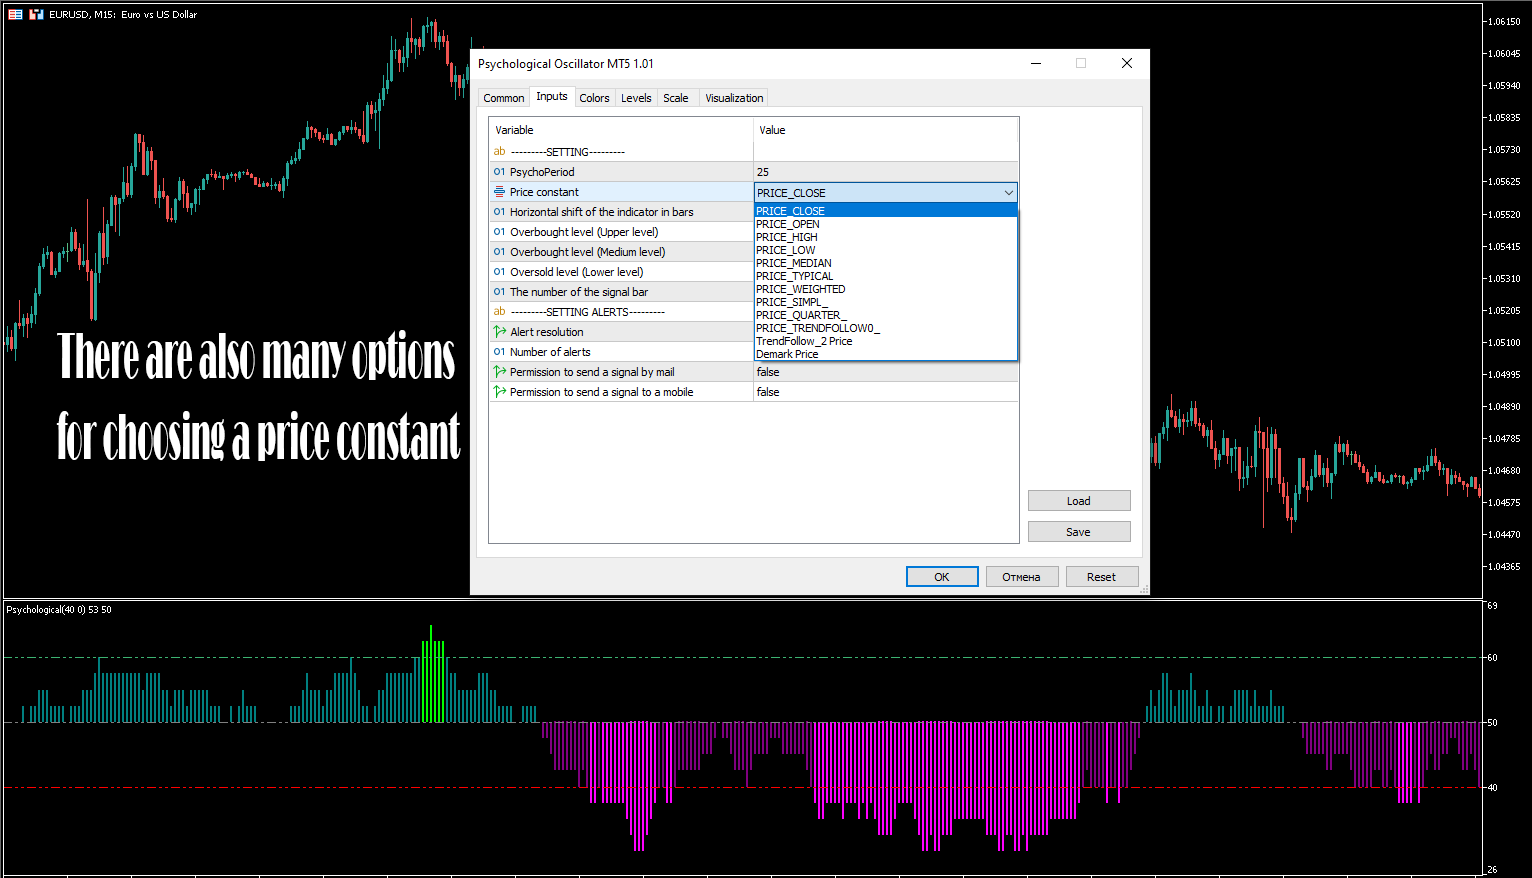
价格不变-价格不变
指标在柱线中的水平移位-指标在柱线中的水平移位
超买水平(上一级)-超买水平
超买水平(中等水平)-中等水平
超卖水平(较低水平)-超卖水平
信号条的编号-信号条的编号
---------设置警报---------
警报分辨率-信号分辨率
警报数量-一次发送的信号数量
允许通过邮件发送信号-允许发送信号到邮件
向手机发送信号的权限-向手机发送信号的权限
截图附后:
用户没有留下任何评级信息