• 概述
  • 评论
  • 评论
  • 新特性

TTM Squeeze Stohastic MTF

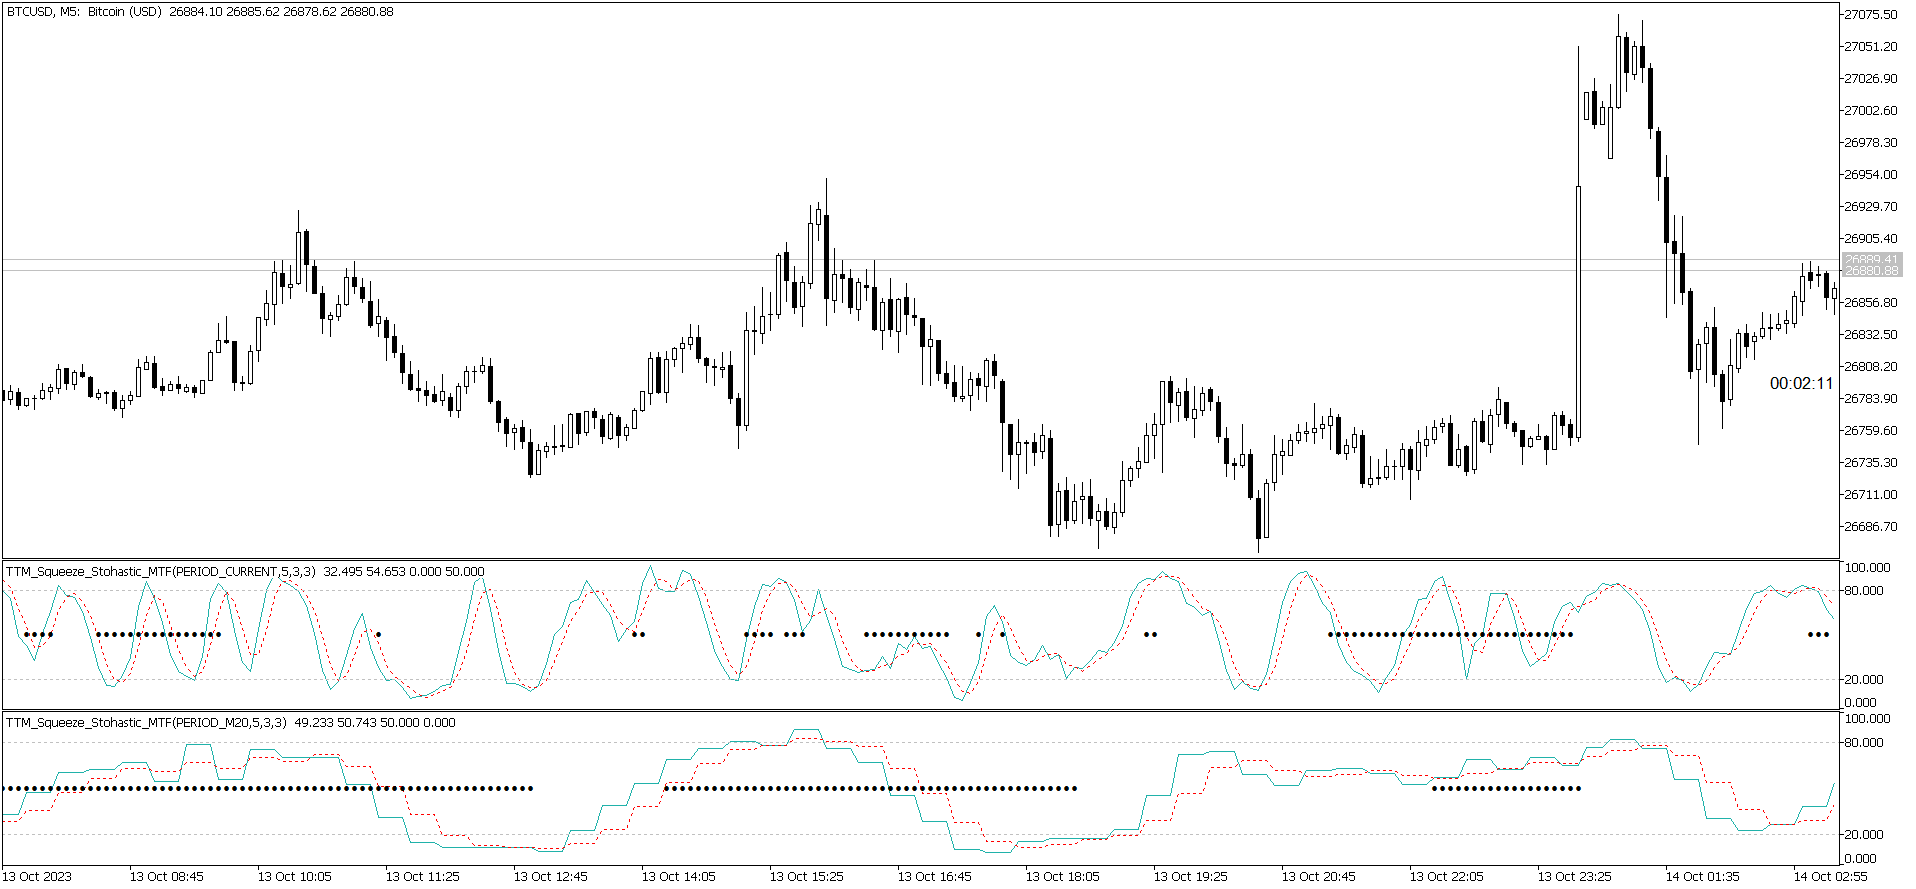
The same indicator that is published here https://www.mql5.com/en/market/product/105645?source=Site+Market+My+Products+Page, but instead of the MACD, a Stochastic Oscillator is used. 

The indicator can be useful for searching for the possibility of opening a position on the Momuntum of multiple timeframes - a method described by Robert Miner in his book "High probability trading strategies".

The settings speak for themselves

  • Period - the timeframe for which the indicator is calculated. When using b to indicate the momentum of the higher timeframe, use a coefficient of 4 or 5. For example, if the current chart is 5-minute, then the older one will be 20-minute or 25-minute.
  • Kelthner channels multiplier - a multiplier for determining the width of the Kelthner channel. In this indicator, this parameter is used to determine the periods of "compression"
  • The other settings are the settings of the Stochastic Oscillator
Please remember that the indicator is not a trading system, but should be used only as an auxiliary tool within your trading strategy.
推荐产品
Noize Absorption Index
Ekaterina Saltykova
Noize Absorption Index - is the manual trading system that measures the difference of pressure between bears forces and bulls forces. Green line - is a noize free index that showing curent situation. Zero value of index shows totally choppy/flat market.Values above zero level shows how powerfull bullish wave is and values below zero measures bearish forces.Up arrow appears on bearish market when it's ready to reverse, dn arrow appears on weak bullish market, as a result of reverse expectation.
PZ Penta O MT5
PZ TRADING SLU
The Penta-O is a 6-point retracement harmonacci pattern which usually precedes big market movements. Penta-O patterns can expand and repaint quite a bit. To make things easier this indicator implements a twist: it waits for a donchian breakout in the right direction before signaling the trade. The end result is an otherwise repainting indicator with a very reliable trading signal. The donchian breakout period is entered as an input. [ Installation Guide | Update Guide | Troubleshooting | FAQ | A
This indicator presents an alternative approach to identify Market Structure. The logic used is derived from learning material created by   DaveTeaches (on X) Upgrade v1.10: + add option to put protected high/low value to buffer (figure 11, 12) + add  Retracements  value to buffer when Show Retracements When quantifying Market Structure, it is common to use fractal highs and lows to identify "significant" swing pivots. When price closes through these pivots, we may identify a Market Structure S
To get access to MT4 version please click here . - This is the exact conversion from TradingView: "Stochastic Momentum Index" By "UCSgears". - This is a popular version of stochastic oscillator on tradingview. - This is a light-load processing and non-repaint indicator. - Buffers are available for the lines on chart. - You can message in private chat for further changes you need. Thanks for downloading
HMA Trend Professional MT5
Pavel Zamoshnikov
4.25 (4)
Improved version of the free HMA Trend indicator (for MetaTrader 4) with statistical analysis. HMA Trend is a trend indicator based on the Hull Moving Average (HMA) with two periods. HMA with a slow period identifies the trend, while HMA with a fast period determines the short-term movements and signals in the trend direction. The main differences from the free version: Ability to predict the probability of a trend reversal using analysis of history data. Plotting statistical charts for analyzi
Owl Smart Levels MT5
Sergey Ermolov
4.1 (29)
MT4版本  |   FAQ Owl Smart Levels Indicator 是一個完整的交易系統,包含 Bill Williams 的高級分形、構建正確的市場波浪結構的 Valable ZigZag 以及標記準確入場水平的斐波那契水平等流行的市場分析工具 進入市場和地方獲利。 策略的详细说明 指示灯使用说明 顾问-贸易猫头鹰助手助理 私人用户聊天 ->购买后写信给我,我会将您添加到私人聊天中,您可以在那里下载所有奖金 力量在於簡單! Owl Smart Levels 交易系統非常易於使用,因此適合專業人士和剛開始研究市場並為自己選擇交易策略的人。 策略和指標中沒有隱藏的秘密公式和計算方法,所有策略指標都是公開的。 Owl Smart Levels 允許您快速查看進入交易的信號,突出顯示下訂單的水平並向您發送有關已出現信號的通知。 優點很明顯: 清楚地顯示主要和更高時間框架的趨勢方向。 指示儀器信號的出現。 標記開單、止損設置和固定利潤的水平。 沒有多餘的,只有必要的結構! ZigZag 表示全球趨勢的方向,因此也表示貿易方向。 市場反轉點的短線清楚地表明在什麼水平上構建斐波那
这是一个 MTF 指标,它基于 带有价格标签的 Advanced ZigZag Dynamic 和/或 Extended Fractals 指标极值(可以禁用)。可以为 MTF 模式选择更多更高的 TF。默认情况下,级别是基于 ZigZag 指标点生成的。分形指标点也可以与 ZigZag 一起使用或代替它。为了简化使用并节省 CPU 时间,每根柱线在开盘时执行一次计算。 参数: ForcedTF - 水平计算的图表时间范围(可能等于或超过当前时间) MinPipsLevelWidth   - 以点为单位的最小关卡宽度(用于非常紧凑的关卡) Use ZigZag Extremums points - 启用/禁用使用 ZigZag 峰值计算支撑/阻力水平 Fixed pips range - 计算 ZigZag 指标的最小值和最大值之间的距离 UseDynamicRange   - 启用/禁用 ZigZag 指标最小值和最大值之间距离的动态计算 Dynamic volatility period - 用于计算 ZigZag 指标最小值和最大值之间的动态距离的波动期 Dynamic vola
该指标在图表上显示谐波模式,无需以尽可能小的滞后 重新绘制。 指标顶部的搜索基于价格分析的波动原理。 高级设置允许您为您的交易风格选择参数。在蜡烛(柱)开盘时,当新形态形成时,价格变动可能方向的箭头是固定的,保持不变。 该指标识别以下形态及其品种:ABCD、Gartley(蝴蝶、螃蟹、蝙蝠)、3Drives、5-0、蝙蝠侠、SHS、One2One、骆驼、三角形、WXY、斐波那契、振动。默认情况下,设置中仅显示 ABCD 和 Gartley 数字。许多额外的可配置参数。 主要参数: ShowUpDnArrows - 显示/隐藏可能的方向箭头 ArrowUpCode - 向上箭头代码 ArrowDnCode - 向下箭头代码 Show old history patterns - 启用/禁用过时模式的显示 Enable alert messages, actual if history OFF - 启用/禁用模式出现/更改时的警报(仅在禁用历史记录时) Enable alert notification, actual if alert messages is enabled - 模式出现
Monster Harmonics Indicator is a harmonic pattern indicator. It recognizes Gartley, Bat, Crab, Butterfly, Cypher, White Swan, Black Swan, Shark and AB=CD patterns. Projected patterns that are not yet completed are recognized, too. Monster even shows the PRZ (Potential Reversal Zone). Users can add their own user defined patterns to Monster. Besides the current pattern, Monster also shows all patterns in the symbols history. Monster will provide alerts for developing patterns. Introduced by H.M.
Modified Bollinger Bands
Gennadiy Stanilevych
The standard Bollinger Bands indicator has been improved by integrating additional indications from the Standard Deviation indicator (StdDev), which gives an additional filter for confirming trading signals. In addition, the color of the indicator's lines shows the beginning of a trend, its development and exhaustion. This indicator has a signal block that notifies the trader of the beginning of the trend on any time frame to which it is attached. Settings Type of messages - select the type of
使用量子快閃記憶體建立您自己的高頻交易 EA 我們都聽說過交易中的建造者和生成者,但你檢查過量子快閃記憶體嗎?它是一款改變遊戲規則的生成器,可幫助您使用完整的原始程式碼創建您自己的高頻交易 (HFT) EA 交易 (EA)! 量子快閃記憶體如何運作? Quantum Flash 使用智慧演算法,利用隨機產生來啟動您的 HFT EA。雖然有些生成器只關注隨機化或遺傳選項,但量子閃存將兩者結合起來。它會創建一個隨機 HFT EA,然後您可以使用遺傳優化器​​進一步演化。 透過 Quantum Flash,您可以在自己的平台上建立複雜的交易策略。最好的部分?它的設計非常高效,因此您不必擔心它會降低 CPU 速度或佔用記憶體。 以下是如何開始 載入指標:首先,將 Quantum Flash 指標載入到您的圖表上。 建立您的 EA:點擊建立 EA 按鈕。您將在 Experts 標籤中看到一條彈出訊息,指出您的 EA 代碼已儲存為 RandomEA.mq5 。 尋找您的程式碼:轉到“檔案”選單並點擊“開啟資料資料夾”。在“文件”部分下,您將找到您的 mq5 文件。打開它可以看到代碼。 編譯
An indicator of pattern #31 ("Long Island") from Encyclopedia of Chart Patterns by Thomas N. Bulkowski. The second gap is in the opposite direction. Parameters: Alerts - show alert when an arrow appears   Push - send a push notification when an arrow appears (requires configuration in the terminal) GapSize - minimum gap size in points ArrowType - a symbol from 1 to 17 ArrowVShift - vertical shift of arrows in points   ShowLevels - show levels ColUp - color of an upward line ColDn - color of a d
Description:  First of all Its worth emphasizing here that the Trend Breakout Catcher is  Non-Repainting,  Non-Redrawing    and  Non-Lagging  Indicator, Which makes it ideal from both manual and robot trading. The Trend Breakout Catcher Indicator employs a sophisticated algorithm designed to predict trends early and generate timely Buy and Sell signals at the onset of a breakout. Utilizing a smart calculation based on numerous elements, the indicator forms a robust and redundant system to detec
Технический индикатор Universal Oscillator является комбинацией торговых сигналов самых популярных и широко используемых осцилляторов. Индикатор представлен гистограммами, а также линиями fast и slow MA, что позволяет расширить список получаемых торговых рекомендаций и работать как по тренду, так и в боковом движении рынка. Таким образом, гистограммы позволяют определить момент пробоя ценовых значений и движение в новой фазе рынка, а линии указывают на зоны перекупленности и перепроданности.  Ос
Bear Bull
Ignacio Agustin Mene Franco
Bear Bull! It is an indicator that marks with Heikin Ashi candles but modified, the sales and purchases long and short trend! with 2 colors green marks the purchase, purple marks the sale, works for any type of temporality, works for forex markets and synthetic indices! ideal for any pair, it also works for crypto pairs, Good profit! World Investor - World Inversor - 
B Xtrender
Yashar Seyyedin
To download MT4 version please click here . This is the exact conversion from TradingView: "B-Xtrender" By "QuantTherapy". - It is an oscillator based on RSI and multiple layers of moving averages. -   It is a two in one indicator to calculate overbought and oversold zones for different RSI settings. -  This indicator lets you read the buffers for all data on the window. - This is a non-repaint and light processing load indicator. - You can message in private chat for further changes you need.
Visual Keltner Trend Midline Indicator
AL MOOSAWI ABDULLAH JAFFER BAQER
Unlock the Potential of Keltner Channel Trends! The Keltner Trend Midline Indicator is a robust tool designed to assist traders in capturing midline movements and potential reversals within the Keltner Channel framework. This indicator is carefully crafted for you to optimize and tailor it to your trading style, ensuring it aligns with your strategies and goals. Key Features & Strategy Logic Midline Dynamics: The indicator focuses on the midline of the Keltner Channel, which acts as a dyna
An Ultimate Tool  for quick and efficient market analysis. Unique combination of solid indicators defining market direction for trend tracking and filtration designed for you to stay on the   right   side of the market. Market Rider Oscillators  gives you access to one of the most used from professional trades indicators on worldwide, which were not build in for MT4 and MT5 terminals . These are unique non-repainting oscillators designed to be used on all time frames for all instruments classe
中文 (Chinese) 适用于MetaTrader 5 (MT5)的虫洞时间框架指标 不仅仅是另一个交易工具——它是您在金融市场中的竞争优势。专为新手和专业交易者设计,虫洞指标彻底改变了您分析数据和决策的方式,确保您始终领先一步。 为什么您需要虫洞指标 领先竞争对手: 同时在同一图表上查看两个时间框架的能力,让您始终比他人快一步。再也不用在不同图表之间切换,您需要的一切尽在眼前。 发掘隐藏的机会: 改变传统时间框架,发现其他交易者错过的模式。想象一下,您的H1图表在1:59 PM而非2:00 PM关闭,这让您在市场反应之前采取行动。或者调整5分钟图表的边界,从00:01到00:06分析蜡烛,而不是标准的00:00到00:05。这些微妙的变化可以揭示独特的市场动态。 获取可操作的见解: 借助检测趋势、反转和支撑/阻力水平的精密工具,虫洞为您提供自信交易所需的知识。 经验证的创新 虫洞指标并非基于猜测,而是尖端研究的成果: 利用机器学习分析市场低效性。 识别零售交易的集群以揭示隐藏的市场动态。 这些见解推动了一个结合专业级策略的指标开发。 虫洞如何赋能您 更快决策: 实时数据让您始终领先
Volality Index Scalper
Lesedi Oliver Seilane
5 (1)
Volality Index scalper indicator  Meant for Volality pairs such as Volality 10, 25, 50, 75 and 100 The indicator works on all timeframes from the 1 minute to the monthly timeframe the indicator is non repaint the indicator has 3 entry settings 1 color change on zero cross 2 color change on slope change 3 color change on signal line cross Orange line is your sell signal Blue line is your buy signal.
This indicator displays pivot points in the chart, including historical vales, and supports many calculation modes for Pivot Points and S/R levels. [ Installation Guide | Update Guide | Troubleshooting | FAQ | All Products ] It plots historical levels for backtesting purposes It allows you to select the reference timeframe It implements different Pivot Point calculation modes It implements different SR calculation modes It implements customizable colors and sizes Calculation Modes The indicato
IndicateMe
Dani Cyril Bakkum
The IndicateMe indicator has been specially created to remove as much noise as possible from the signals it gives. The indicator has been combined with several other well-known indicators. Indicators  that have been used: "Moving average, stocastic indicator, relative strenght index, moving". All indicators that are used can be adjusted by yourself. The default settings are set to the values ​​I like to use. Easily set alerts to always stay informed of the indicator's signals. Important: this
Crash 1000 Scalping Indicator for the Crash 1000 Deriv Synthetic Index. Introduction The Crash 1000 Scalping Indicator is a specialized tool designed for the Crash 1000 index on the Deriv Synthetic market. This indicator is particularly useful for scalping on the M1 timeframe, helping traders to identify precise entry and exit points for buy positions. It is designed to be non-repainting, providing clear signals with audible alerts and push notifications, and is compatible with mobile devices th
Special offer : ALL TOOLS , just $35 each! New tools   will be   $30   for the   first week   or the   first 3 purchases !  Trading Tools Channel on MQL5 : Join my MQL5 channel to update the latest news from me 推出革命性的 RSI Kernel Optimized with Scanner for MT5,一款重新定义传统 RSI 分析的尖端工具,集成了强大的核密度估计(KDE)算法。这款先进的指标不仅提供实时市场趋势的见解,还包括一个仪表板,可同时扫描多个货币对和时间框架。让我们深入了解为什么这款工具是您交易工具箱中的重要补充。 See more MT4 version at:  RSI Kernel Optimized MT4 with Scanner See more products at:   https://www.mql5.com/en/users/ndhsfy
Magic sl NASDAQ 100
Benyamin Naser Mokhtari Karchegani
The indicator now at your disposal is undoubtedly one of the best tools for trading in the NASDAQ 100 market, especially in the 1-minute and 5-minute timeframes. This indicator is meticulously designed for high precision and can be adjusted for other timeframes as well. Simply run it and receive good exit signals. Key Features: Specialized performance in the 1-minute and 5-minute timeframes: While this indicator works in other timeframes as well, its primary focus is on these two timeframes. Co
Introducing the Power Trade Plus indicator designed by a small group of traders with a few years of experience trading the market profitably.  The Power Trade Plus is derived from the Power Trade indicator,  the indicator strive in powerful sniper entries and take profit levels,  with an algorithm that's can determine the markets volatility and Provides entries based on the current market volatility. This indicator is much more effective in stock ,currencies and indices.
The   Fibonacci Confluence Toolkit   is a technical analysis tool designed to help traders identify potential price reversal zones by combining key market signals and patterns. It highlights areas of interest where significant price action or reactions are anticipated, automatically applies Fibonacci retracement levels to outline potential pullback zones, and detects engulfing candle patterns. Its unique strength lies in its reliance solely on price patterns, eliminating the need for user-define
Ultimate Divergence Scanner (Multi Pair And Multi Time Frame) :   ---LIMITED TIME OFFER: NEXT 25 CLIENTS ONLY ---46% OFF REGULAR PRICE AND 2 FREE BONUSES ---SEE BELOW FOR FULL DETAILS It is a widely known market principle that momentum generally precedes price.  Making divergence patterns a clear indication that price and momentum are not in agreement.  Divergence patterns are widely used by institutional traders around the world. As they allow you to manage  your trades within strictly defin
Swing Tracer
Ely Alsedy
5 (2)
it depends on ATR period to get swing points to help make better trading decisions  blue dot and red dot is the default color scheme of course you can change it later if you'd like  you can change the following : ATR PERIOD  sending notifications number of times to send notifications  sending notifications to your smart phone that's it very simple to use just drag and drop and follow the trend 
该产品的买家也购买
Trend Screener Pro MT5
STE S.S.COMPANY
4.89 (72)
使用趋势筛选指标释放趋势交易的力量:由模糊逻辑和多货币系统提供支持的终极趋势交易解决方案! 使用趋势筛选器(由模糊逻辑提供支持的革命性趋势指标)提升您的趋势交易。 它是一个强大的趋势跟踪指标,结合了超过 13 种高级工具和功能以及 3 种交易策略,使其成为使您的 Metatrader 成为趋势分析器的多功能选择。 限时优惠:趋势筛选指标终身仅需 50 美元。 ( 原价 250$ ) (优惠延长) 体验趋势筛选器 100% 无需重新绘制的准确性,确保您的交易决策不受过去价格变化的影响。 释放多时间框架和多货币功能的多功能性,使您能够以无与伦比的信心在外汇、商品、加密货币和指数领域进行交易。 利用 Trend Screener 的综合策略套件增强您的交易: - 趋势跟踪策略和趋势延续策略 :趋势筛选器的趋势跟踪策略提供清晰的趋势延续信号,让您有效捕捉趋势走势并管理风险。 - 反转策略和早期入场点策略 :趋势筛选器的反转策略可检测市场方向的潜在变化,使您能够预测趋势反转并利用疲弱的市场趋势。通过早期入场点,您可以在潜在的趋势变化之前定位自己 获取可观的利润。 - 倒卖策略: 趋势筛选器的倒卖
FX Volume MT5
Daniel Stein
4.72 (18)
FX Volume:从经纪商视角洞察真实市场情绪 简要概述 想要提升您的交易策略? FX Volume 可提供零售交易者和经纪商的持仓实时数据——远早于诸如 COT 之类的延迟报告。不论您希望获得持续稳定的收益,还是想在市场中多一分制胜的砝码, FX Volume 都能帮您识别重大失衡、确认突破以及完善风险管理。立即开启体验,让真实的成交量数据为您的交易决策带来革新! 1. 为什么 FX Volume 对交易者格外有用 极具准确度的早期预警 • 快速捕捉有多少交易者正在买入或卖出某个货币对——比大多数人提前一步。 • FX Volume 是 唯一 能够整合多家零售经纪商真实成交量数据并以简洁方式呈现的工具。 强力风险管理 • 及时识别多头或空头仓位的巨大不平衡,这往往预示着潜在的趋势反转,帮助您更自信地设置止损和目标位。 • 独家而真实的数据让每一次交易决策更具可靠性。 优化进场与出场点 • 发现“过度集中”的交易(大多数交易者都在同一方向),并通过真实成交量来确认突破。 • 避免依赖常见指标可能带来的误导信号,而是利用真实的实时成交量。 适配各种交易策略 • 将 FX
Golden Trend Indicator MT5
Noha Mohamed Fathy Younes Badr
4.86 (14)
Golden Trend indicator  is The best indicator for predicting trend movement this indicator never lags and never repaints and never back paints    and give  arrow buy and sell    before the candle appear  and it will help you and  will make your trading decisions clearer its work on all currencies and  gold and crypto and all time frame This unique  indicator uses very secret algorithms to catch the  trends, so you can trade using this indicator and see the trend clear on charts  manual guide and
FX Power MT5 NG
Daniel Stein
5 (10)
FX Power:分析货币强度,助您做出更明智的交易决策 概述 FX Power 是一款专业工具,帮助您全面了解主要货币和黄金在任何市场条件下的真实强度。通过识别强势货币用于买入,弱势货币用于卖出, FX Power 简化了交易决策,并帮助您发现高概率的交易机会。不论您是想跟随趋势还是通过极端的 Delta 值预测反转,这款工具都能完美适应您的交易风格。别再盲目交易——用 FX Power 让您的交易更加智慧。 1. 为什么 FX Power 对交易者极具价值 实时货币和黄金强度分析 • FX Power 实时计算并显示主要货币和黄金的相对强度,助您全面了解市场动态。 • 监控领先或落后资产,轻松识别值得交易的货币对。 全面的多时间框架视图 • 跟踪短期、中期和长期时间框架的货币和黄金强度,以便将您的交易策略与市场趋势保持一致。 • 无论是快进快出的短线交易还是更长期的投资策略, FX Power 都能为您提供所需的信息。 Delta 动态分析用于趋势和反转 • 极端 Delta 值常常预示反转机会,而平缓的 Delta 变化则确认趋势延续。 • 使用 Delta 分析,轻
IX Power MT5
Daniel Stein
4.83 (6)
IX Power:解锁指数、大宗商品、加密货币和外汇市场洞察 概述 IX Power 是一款多功能工具,可分析指数、大宗商品、加密货币和外汇市场的强弱表现。 FX Power 提供针对货币对的最高精度,利用所有可用货币对数据进行分析,而 IX Power 专注于基础资产的市场数据。这使得 IX Power 成为非外汇市场的理想选择,同时在需要简单外汇分析时也非常可靠。它可以无缝适用于任何图表,提供清晰的、有行动价值的洞察,帮助提升您的交易决策。 1. 为什么 IX Power 对交易者非常有价值 多市场强弱分析 • IX Power 分析指数、大宗商品、加密货币和外汇市场的强弱表现,为每个市场提供量身定制的洞察。 • 监控 US30、WTI、黄金、比特币等资产的表现,发现交易机会。 适用于更广泛的市场 • 对于外汇交易, FX Power 提供无与伦比的精度,通过分析所有相关货币对。 • IX Power 专注于基础资产的市场数据,非常适合非外汇市场及简化的外汇分析。 实时适应性 • 借助自适应算法, IX Power 实时响应市场数据变化,保持分析的最新性。 • 实时更新
FX Levels MT5
Daniel Stein
5 (2)
FX Levels:适用于所有市场的高精度支撑与阻力 快速概览 想要精准确定适用于任何市场(外汇、指数、股票或大宗商品)的支撑与阻力吗? FX Levels 将传统的“Lighthouse”方法与前沿的动态分析相结合,实现近乎通用的准确性。依托真实经纪商经验和自动化的每日与实时更新, FX Levels 帮助您捕捉价格反转点、设置合理的盈利目标,并自信地管理交易。立即使用,体验更准确的支撑/阻力分析如何助力您的交易更上层楼! 1. 为什么 FX Levels 对交易者非常有利 极度精准的支撑 & 阻力区 • FX Levels 专为不同经纪商提供的行情源和时间设置而设计,可生成几乎相同的价位区,解决数据不一致的常见问题。 • 这意味着无论您在哪里交易,都能获得稳定一致的水平线,为策略打下更加牢固的基础。 结合传统与先进技术 • 通过将久经考验的“Lighthouse”方法与动态分析相融合, FX Levels 不仅限于每日刷新,还可针对新的价格波动进行即时更新。 • 您可以选择经典的静态方式,或实时捕捉新出现的水平,以贴近最新的市场行为。 识别清晰的反转点 • FX Lev
TPSpro RFI Levels MT5
Roman Podpora
4.53 (19)
指示       俄罗斯 -        英语   建议 与指示器一起使用     -       TPSpro 趋势专业版 -   MT4版本       交易中的一个关键要素是做出买卖交易工具决定的区域或水平。尽管主要参与者试图隐藏他们在市场中的存在,但他们不可避免地会留下痕迹。我们的任务是学习如何识别这些痕迹并正确解释它们。 主要功能: 向卖家和买家显示活跃区域! 该指标显示所有正确的初始买入和卖出脉冲水平/区域。激活这些水平/区域后,开始寻找切入点,水平会改变颜色并填充特定阴影。此外,还会显示箭头,以便更直观地了解情况。 显示更高时间范围内的级别/区域(MTF 模式) 添加了使用更高时间间隔显示级别/区域的功能。此外,该指标还具有自动趋势检测功能(   TPSproTREND PRO   )。 用于交易的单独专业的逐步算法。 该算法专为日内交易而设计,既可顺势交易,也可逆势交易。每个活动模板均提供详细说明。 适用于多种时间范围 。 TPSpro RFI 水平指标可用于图表上的任何时间范围,从一分钟(M1)开始一直到每月(MN)。 图形和声音警报。 该指标提供图形和声音指示,
Quantum TrendPulse
Bogdan Ion Puscasu
5 (12)
介绍 Quantum TrendPulse   ,这是一款终极交易工具,它将 SuperTrend   、   RSI 和 Stochastic 的强大功能整合到一个综合指标中,以最大限度地发挥您的交易潜力。该指标专为追求精准和效率的交易者而设计,可帮助您自信地识别市场趋势、动量变化以及最佳进入和退出点。 主要特点: 超级趋势整合: 轻松跟随当前的市场趋势并乘上盈利浪潮。 RSI 精度: 检测超买和超卖水平,非常适合把握市场逆转时机,可用作 SuperTrend 的过滤器 随机精度: 利用随机振荡在波动的市场中寻找隐藏的机会, 用作超级趋势的过滤器 多时间范围分析: 从 M5 到 H1 或 H4,在不同时间范围内关注市场动态。 可定制的警报: 当您的自定义交易条件得到满足时收到通知,这样您就不会错过任何交易。 无论您是新手还是经验丰富的交易员,   Quantum TrendPulse 都能为您提供所需的优势,帮助您增强策略并自信地进行交易。借助这一强大的指标,将洞察力转化为利润 — 掌控您的交易! ***购买 Quantum TrendPulse,即可免费获得 Quantum Tr
支撑和阻力筛选器是 MetaTrader 的一个级别指标,它在一个指标内提供多种工具。 可用的工具有: 1. 市场结构筛选器。 2. 看涨回调区。 3. 看跌回调区。 4.每日枢轴点 5.每周枢轴点 6. 每月枢轴点 7. 基于谐波形态和成交量的强大支撑和阻力。 8. 银行级区域。 限时优惠:HV 支撑和阻力指示器仅售 50 美元且终生可用。 (原价 125$) 通过访问我们的 MQL5 博客,您可以找到我们所有带有分析示例的高级指标: 单击此处 主要特点 基于谐波和音量算法的强大支撑和阻力区域。 基于谐波和成交量算法的看涨和看跌回调区域。 市场结构筛选器 每日、每周和每月的枢轴点。 文档 所有支持和阻力筛选器文档(说明)和策略详细信息均可在我们 MQL5 博客的这篇文章中找到: 单击此处。 接触 如果您有任何问题或需要帮助,请通过私信联系我。 作者 SAYADI ACHREF,金融科技软件工程师,Finansya 创始人。
RelicusRoad Pro MT5
Relicus LLC
4.78 (18)
现在$ 147(更新后增加到$ 499) - 无限帐户(PC或Mac) RelicusRoad 用户手册 + 培训视频 + 访问 Private Discord Group + VIP 身份 一种看待市场的新方式 RelicusRoad 是世界上最强大的外汇、期货、加密货币、股票和指数交易指标,为交易者提供保持盈利所需的所有信息和工具。我们提供技术分析和交易计划,帮助每一位交易者取得成功,从初学者到高级。它是一个关键的交易指标,可以提供足够的信息来预测未来的市场。我们相信一个完整的解决方案,而不是图表上几个没有意义的不同指标。这是一个多合一指标,显示无与伦比且非常准确的信号、箭头 + 价格行为信息。 RelicusRoad 基于强大的人工智能,提供缺失的信息和工具来教育您并使您成为交易专家,成为成功的交易者。 几乎所有技术指标都滞后,这意味着它们只能报告已经发生的事情。因此,他们只确认您过去可以看到的价格已经在哪里。我们相信领先指标可以预测未来价格,而无需重新绘制,也不要过度依赖可能改变并导致重新绘制的滞后指标。如果您根据滞后指标进行交易并建立头寸,您就知道您已经大部分时间
Gold Stuff mt5
Vasiliy Strukov
4.92 (173)
Gold Stuff mt5 是专为黄金设计的趋势指标,也可用于任何金融工具。 该指标不会重绘,也不会滞后。 推荐时间框架 H1。 购买后立即联系我以获得设置和个人奖励!   你可以在我的个人资料中找到它。   重要! 购买后立即与我联系,以获得说明和奖金!   您可以免费收到我们的强力支持和趋势扫描指标的副本,请私信。大部头书!   设置 绘制箭头 - 打开关闭。 在图表上绘制箭头。 警报 - 打开关闭声音警报。 电子邮件通知 - 打开关闭。 电子邮件通知。 Puch-notification - 打开关闭。 推送通知。 接下来,调整色域。 Gold Stuff mt5 是专为黄金设计的趋势指标,也可用于任何金融工具。 该指标不会重绘,也不会滞后。 推荐时间框架 H1。 购买后立即联系我以获得设置和个人奖励!   设置 绘制箭头 - 打开关闭。 在图表上绘制箭头。 警报 - 打开关闭声音警报。 电子邮件通知 - 打开关闭。 电子邮件通知。 Puch-notification - 打开关闭。 推送通知。 接下来,调整色域。
Bill Williams Advanced
Siarhei Vashchylka
5 (10)
Bill Williams Advanced is designed for automatic chart analysis using Bill Williams' "Profitunity" system. The indicator analyzes four timeframes at once. Manual (Be sure to read before purchasing) Advantages 1. Automatically analyzes the chart using the "Profitunity" system of Bill Williams. The found signals are placed in a table in the corner of the screen. 2. Equipped with a trend filter based on the Alligator indicator. Most of the system signals are recommended to be used only according t
Basic Harmonic Patterns Dashboard MT5
Mehran Sepah Mansoor
4.57 (7)
该仪表盘显示所选符号的最新可用谐波形态,因此您可以节省时间并提高效率 /  MT4 版本 。 免费指标:  Basic Harmonic Pattern 指标列 Symbol:   显示所选符号 Trend:     看涨或看跌 Pattern:    形态类型(Gartley、蝴蝶、蝙蝠、螃蟹、鲨鱼、Cypher 或 ABCD) Entry:     入口价格 SL: 止损价 TP1: 第一止盈价 TP2: 第二次获利价格 TP3: 第三次获利价格 Current price:    当前价格 Age (in bars):   最后绘制的模式的年龄 主要输入 Symbols :   从 "28 种主要货币对 "或 "选定符号 "中选择。 Selected Symbols :   希望监控的符号,用逗号分隔("EURUSD,GBPUSD,XAUUSD")。如果您的经纪商为货币对设置了后缀或前缀,您必须在以下两个参数中添加(货币对前缀或货币对后缀)。 Max Iteration:   调整模式的最大迭代次数(如果该值越小,则模式越少,性能越快;如果该值越大,则模式越多,性能越慢)
Matrix Arrow Indicator MT5
Juvenille Emperor Limited
5 (13)
矩阵箭头指标 MT5   是一种独特的 10 合 1 趋势,遵循   100% 非重绘多时间框架指标 ,可用于所有符号/工具: 外汇 、 商品 、 加密货币 、 指数 、 股票 。 Matrix Arrow Indicator MT5 将在其早期阶段确定当前趋势,从多达 10 个标准指标中收集信息和数据,它们是: 平均定向运动指数 (ADX) 商品渠道指数 (CCI) 经典 Heiken Ashi 蜡烛 移动平均线 移动平均收敛散度 (MACD) 相对活力指数 (RVI) 相对强弱指数 (RSI) 抛物线SAR 随机振荡器 威廉姆斯的百分比范围 当所有指标给出有效的买入或卖出信号时,相应的箭头将打印在图表上,在下一根蜡烛/柱线开盘时,指示强劲的上升趋势/下降趋势。用户可以选择使用哪些指标,并可以单独调整每个指标的参数。 Matrix Arrow Indicator MT5 仅从选定的指标中收集信息,并仅根据其数据打印箭头。   Matrix Arrow Indicator MT5   还可以为所有新信号发送终端、推送通知或电子邮件警报。无论您是黄牛、日内交易者还是波段交易者, Mat
首先,值得强调的是,这个交易工具是非重绘、非重画和非滞后的指标,非常适合专业交易。 在线课程,用户手册和演示。 智能价格行动概念指标是一个非常强大的工具,既适用于新手,也适用于经验丰富的交易者。它将超过20个有用的指标合并到一个指标中,结合了高级交易思想,如内圈交易员分析和智能资金概念交易策略。该指标侧重于智能资金概念,提供有关大型机构交易方式的见解,帮助预测它们的动向。 它在流动性分析方面尤其擅长,有助于理解机构的交易方式。它擅长预测市场趋势,并仔细分析价格波动。通过将您的交易与机构策略对齐,您可以更准确地预测市场走向。该指标多才多艺,擅长分析市场结构,识别重要的订单区块,并识别各种模式。 它擅长识别BOS和CHoCH等模式,理解动量的转变,并突出显示供需强劲的关键区域。它还擅长发现强大的不平衡,并分析价格创造更高高点或更低低点的模式。如果您使用斐波那契回撤工具,该指标可以满足您的需求。它还可以识别相等的高点和低点,分析不同的时间框架,并通过仪表板显示数据。 对于使用更高级策略的交易者,该指标提供了工具,如公平价值差指标和优惠和折扣区域的识别。它特别关注高时间框架订单区块,并
FX Dynamic:借助可定制的 ATR 分析,追踪波动率与趋势 概述 FX Dynamic 是一款强大的工具,通过计算平均真实波幅(ATR)来为交易者提供日内和日间波动性方面的深度见解。通过设置 80%、100%、130% 等关键波动率阈值,您可以快速识别潜在的盈利机会,或者在市场超出常规范围时及时得到预警。 FX Dynamic 可根据您经纪商的时区进行调整,帮助您保持一致的波动率衡量标准,并能与 MetaTrader 平台完美结合,实现实时分析。 1. 为什么 FX Dynamic 对交易者极具价值 实时 ATR 洞察 • 仅需一眼便可了解日间与日内波动水平。当价格触及或突破 80%、100%、130% 的 ATR 阈值时,会发出提示,让您知道市场是否达到临界水平。 • 在波动完全爆发前预判可能的衰竭或突破走势。 多市场通用 • 适用于外汇、商品、指数等多种资产。 FX Dynamic 可以自动识别经纪商时区,也可手动进行调整。 • 您可选择只专注于某一特定品种,或在多市场保持一致的 ATR 标准。 更智能的风险管理 • 利用 ATR 门槛来优化止损或止盈位置。当市场
介绍     Quantum Breakout PRO   ,突破性的 MQL5 指标,正在改变您交易突破区域的方式!由拥有超过13年交易经验的资深交易员团队开发,     量子突破 PRO     旨在通过其创新和动态的突破区域策略将您的交易之旅推向新的高度。 量子突破指标将为您提供带有 5 个利润目标区域的突破区域的信号箭头,以及基于突破框的止损建议。 它既适合新手交易者,也适合专业交易者。 量子 EA 通道:       点击这里 重要的!购买后请私信我领取安装手册。 建议: 时间范围:M15 货币对:GBPJPY、EURJPY、USDJPY、NZDUSD、XAUUSD 账户类型:ECN、Raw 或 Razor,点差极低 经纪商时间:GMT +3 经纪商:IC Markets、Pepperstone with Raw 和 Razor 的点差最低 规格: 不重漆! 最多 5 个建议利润目标区域 建议止损水平 可定制的盒子。您可以设置自己的 Box Time Start 和 Box Time End。 接触 如果您有任何疑问或需要帮助,请通过私人消息与我联系。
Entry Points Pro for MT5
Yury Orlov
4.46 (129)
这款指标用于 MT5,可提供准确的入场交易信号,且无重绘。 它可应用在任何金融资产:外汇、加密货币、贵金属、股票、指数。 它将提供极其精准的评估,并告诉您何时开仓和平仓的最佳时机。 观看 视频 (6:22),其中包含一个仅处理单一信号的示例,该信号即可值回指标购价! 大多数交易者在 Entry Points Pro 指标的帮助下,在第一个交易周内即改善了他们的交易结果。 订阅我们的 Telegram 群 ! Entry Points Pro 指标的益处。 入场信号无重绘 如果信号出现,并得到确认,则它不会再消失;不像是重绘指标,它会导致重大的财产损失,因为它们可以在显示信号后再将其删除。 无差错开仓 指标算法可令您找到入场交易(买入或卖出资产)的理想时机,从而提高每位交易者的成功率。 Entry Points Pro 可操作任何资产 它允许您在 MT5 平台上交易任何经纪商的加密货币、股票、贵金属、指数、大宗商品和货币。 提供任何方向的信号 Entry Points Pro 指标提供针对任意价格走势的入场交易信号 - 上涨、下跌或横盘(横向)。 最大盈利潜力 离场信号
首先,值得强调的是,这个交易系统是一个非重绘、非重画和非滞后的指标,这使得它非常适合手动和机器人交易。 在线课程,手册和下载预设。 “智能趋势交易系统 MT5”是专为新手和经验丰富的交易者量身定制的综合交易解决方案。它结合了超过 10 个优质指标,具有 7 多个强大的交易策略,使其成为适用于各种市场条件的多功能选择。 趋势跟随策略:提供精确的入场和止损管理,以有效地跟随趋势。 反转策略:识别潜在的趋势反转,使交易者能够利用区域市场的机会。 剃头策略:专为快速准确的日内交易和短期交易而设计。 稳定性:所有指标都不会重绘、不会重画和不会滞后,确保可靠的信号。 定制:支持自定义策略,以满足个人交易偏好。超过 7 种策略和组合可帮助您找到最佳策略。 信号清晰度:提供箭头信号,以指示清晰的入场和退出点。 实时警报:通过交易进出警报使交易者保持了解。 深入分析:提供更高时间框架的趋势分析和实时交易监控。 自适应颜色编码:利用蜡烛颜色编码来显示成交量、趋势和反转蜡烛信号。通过蜡烛颜色分析市场方向。 “智能趋势交易系统 MT5”赋予交易者必要的工具,以便在各种市场条件下做出明智和战略性的交易决策。无论
Easy Breakout MT5
Mohamed Hassan
5 (3)
After your purchase, feel free to contact me for more details on how to receive a bonus indicator called VFI, which pairs perfectly with Easy Breakout for enhanced confluence!     Easy Breakout MT5   is a powerful price action trading system built on one of the most popular and widely trusted strategies among traders: the   Breakout strategy ! This indicator delivers crystal-clear Buy and Sell signals based on breakouts from key support and resistance zones. Unlike typical breakout indicators
Gartley Hunter Multi
Siarhei Vashchylka
5 (10)
Gartley Hunter Multi - An indicator for searching for harmonic patterns simultaneously on dozens of trading instruments and on all possible timeframes. Manual (Be sure to read before purchasing) | Version for MT4 Advantages 1. Patterns: Gartley, Butterfly, Shark, Crab. Bat, Alternate Bat, Deep Crab, Cypher 2. Simultaneous search for patterns on dozens of trading instruments and on all possible timeframes 3. Search for patterns of all possible sizes. From the smallest to the largest 4. All fou
Trend Line Map Pro MT5
STE S.S.COMPANY
4.09 (11)
趋势线图指标是趋势筛选器指标的插件。它用作趋势筛选器(趋势线信号)生成的所有信号的扫描仪。 它是基于趋势筛选器指标的趋势线扫描仪。如果您没有 Trend Screener Pro Indicator,Trend Line Map Pro 将无法使用。 It's a Trend Line Scanner based on Trend Screener Indicator. If you don't have Trend Screener Pro Indicator,     the Trend Line Map Pro will not work . 通过访问我们的 MQL5 博客,您可以下载趋势线图指标的免费版本。购买前试用,不受 Metatrader Tester 限制。 :  点击这里 1. 容易获得的优势 根据货币和时间范围显示买入和卖出信号。 评估自图表中出现箭头以来价格上涨或下跌的点数。 (趋势筛选指标箭头) 显示信号的时序。 获取多时间范围和多货币警报以购买和出售警报。 2. 如何使用趋势线图 如何显示买卖信号仪表板? 如果您有任何问题或需要帮助,请通过私
可以说,这是您可以为MetaTrader平台找到的最完整的谐波价格形成自动识别指标。它检测19种不同的模式,像您一样认真对待斐波那契投影,显示潜在的反转区域(PRZ),并找到合适的止损和获利水平。 [ 安装指南 | 更新指南 | 故障排除 | 常见问题 | 所有产品 ] 它检测19种不同的谐波价格形态 它绘制了主要,衍生和互补的斐波那契投影(PRZ) 它评估过去的价格走势并显示每个过去的形态 该指标分析其自身的质量和性能 它显示合适的止损和获利水平 它使用突破来表明合适的交易 它在图表上绘制所有样式比率 它实现了电子邮件/声音/视觉警报 受斯科特·M·卡尼(Scott M. Carney)的书的启发,该指标旨在满足最纯粹和最熟练的交易者的需求。但是,它采取了一种使交易更容易的方式:在向交易发出信号之前,它会等待Donchian朝正确方向突破,从而使交易信号非常可靠。 斐波那契投影与向量无关 它实现了电子邮件/声音/推送警报 它绘制了ABCD投影 重要提示: 为了符合 Scott M. Carney先生 的商标申诉,某些图案名称已重命名为不言自明的替代方式, Scott M.
Basic Supply Demand Dashboard MT5
Mehran Sepah Mansoor
5 (1)
该仪表盘可根据您对所选符号的交易策略,以剥头皮和长期模式在图表上发现并显示供需区。此外,仪表盘的扫描模式可帮助您一目了然地检查所有需要的符号,不错过任何合适的仓位/ MT4 版本 免费指标: Basic Supply Demand 功能 允许您查看多个货币对的交易机会,为您提供所有货币对的清晰简明视图,并根据其与供需区的接近程度进行排序 可定制设置,从颜色到检测参数,满足您的特定需求 主要输入 Indicator mode : 选择指标模式或具有新功能的面板模式 Symbols : 从 "28 种主要货币对 "或 "选定符号 "中进行选择 Selected Symbols : 您希望监控的符号,用逗号分隔("EURUSD,GBPUSD,XAUUSD")。如果您的经纪商对货币对有后缀或前缀,您必须在以下两个参数中添加(货币对前缀或货币对后缀) Trading Style : 选择剥头皮或长期模式 Allowed Deviation : 该参数允许修改需求或供应区域的精确度(数值越小,精确度越高) Zone   thickness : 通过该参数可以修改需求和供应区域的厚度。
QM Pattern Scanner MT5
Reza Aghajanpour
5 (3)
Contact me  to send you instruction and add you in group. QM (Quasimodo) Pattern is based on Read The Market(RTM) concepts. The purpose of this model is to face the big players of the market (financial institutions and banks), As you know in financial markets, big traders try to fool small traders, but RTM prevent traders from getting trapped. This style is formed in terms of price candles and presented according to market supply and demand areas and no price oscillator is used in it. RTM conc
Volumatic VIDyA MT5
Duc Hoan Nguyen
5 (1)
Special offer : ALL TOOLS , just $35 each! New tools   will be   $30   for the   first week   or the   first 3 purchases !  Trading Tools Channel on MQL5 : Join my MQL5 channel to update the latest news from me Volumatic VIDYA (Variable Index Dynamic Average) 是一款高级指标,旨在跟踪趋势并分析每个趋势阶段中的买卖压力。通过使用可变指数动态平均值 (Variable Index Dynamic Average) 作为核心动态平滑技术,该工具在关键市场结构水平上提供了关于价格和交易量动态的重要洞察。 查看更多 MT4 版本:  Volumatic VIDyA MT4 查看更多产品:    所有产品 To use iCustom for EA, please see here:  Create EA (iCustom) with VO
Auto Order Block with break of structure based on ICT and Smart Money Concepts (SMC) Futures Break of Structure ( BoS )             Order block ( OB )            Higher time frame Order block / Point of Interest ( POI )    shown on current chart           Fair value Gap ( FVG ) / Imbalance   -  MTF      ( Multi Time Frame )    HH/LL/HL/LH  -  MTF      ( Multi Time Frame )  Choch  MTF      ( Multi Time Frame )  Volume Imbalance     ,  MTF          vIMB Gap’s Power of 3 Equal High / Low’s  
Dark Absolute Trend   is an Indicator for intraday trading. This Indicator is based on   Trend Following  strategy but use also candlestick patterns and Volatility. We can enter in good price with this Indicator, in order to follow the main trend on the current instrument. It is advised to use low spread ECN brokers. This Indicator does   Not repaint   and   N ot lag . Recommended timeframes are M5, M15 and H1. Recommended working pairs: All. I nstallation and  Update Guide   -  Troubleshooting
CONTACT US  after purchase to get the Indicator Manual. Try Now—Limited 50% Discount for First 10 Buyers! Download the  Metatrader 4 Version Due to regulatory restrictions, our service is unavailable in certain countries such as India, Pakistan, and Bangladesh. William Delbert Gann (W.D. Gann) was an exceptional market analyst, whose trading technique was based on a complex blend of mathematics, geometry, astrology, and ancient mathematics which proved to be extremely accurate. A Note from t
作者的更多信息
Mitimom
Danil Poletavkin
The indicator is based on Robert Miner's methodology described in his book "High probability trading strategies" and displays signals along with momentum of 2 timeframes. A Stochastic oscillator is used as a momentum indicator. The settings speak for themselves period_1 is the current timeframe, 'current' period_2 is indicated - the senior timeframe is 4 or 5 times larger than the current one. For example, if the current one is 5 minutes, then the older one will be 20 minutes The rest of the s
FREE
AO on Bars
Danil Poletavkin
Bill's Williams Awesome Oscillator signal from his book "Trading chaos 2nd edition" on bars.  Normally this signal is being used for 2nd entry after 1st entry by Divergent bar ----------------------------------------------------------------------------------------------------------- Please make shure that you understand Bill's Williams system before trade with real money using this indicator. Ideal entry setup is: 1) Divergence with zero line AO crossing 2) Divergent bar on top of the final 5th
FREE
Jake Bernsteins MAC
Danil Poletavkin
The indicator shows Jake Bernstein's MAC (Moving Average Channel) System signals ---------------------------------------- System assumes several types of entering in trade, in this indicator only one type implemented - on closing of second trigger bar. It is recommended to start using this indicator together with Jake Bernstein's free lessons  https://www.youtube.com/@JakeatMBH/videos Arrow shows signal bar - enter on closing or on opening of the next bar, cross - stop level, dot - minimum profi
FREE
Divergent Bar
Danil Poletavkin
Bill Williams' divergent bar with angulation. The angle between the green line and the top/bottom of the bar is used as an angle, which basically corresponds to the updated recommendations from Justin Williams  Angulation for the Wiseman Bullish and Bearish Divergent Signal Bar - YouTube . The default settings of the angle of 85 and 21 bar from the moment of crossing the lip line of the Alligator work quite well. If you use this indicator in real trading, I highly recommend not to engage in day
FREE
Market scanner based on the indicator published here  Download the 'John Carters TTM Squeeze with MACD' Technical Indicator for MetaTrader 5 in MetaTrader Market (mql5.com) .  Only the instruments that are in the Market Watch window are scanned. Maximum number of scanning tools up to 5000. The scan timeframe is selected from the timeframe panel of the terminal. To use it, open any chart and attach the Expert Advisor to the chart, the 'Search' button will appear in the upper left corner. When you
FREE
This indicator created based on original John Carter's TTM_Squeeze indicator and represents "squeeze" of the market which can be followed (or maybe not) by significant moves. Original indicator prints black dots when Bollinger Bands are inside Kelthner Channels and exactly this implemented in this custom version. Instead of original implementation as momentum indicator MACD indicator with standard settings 12-26-9 is being used. Mainly, the indicator is useful for understanding when it's better
The same indicator as here  https://www.mql5.com/ru/market/product/105089?source=Site+Market+My+Products+Page  but with timeframe change possibility. It is convinient to see picture from different timeframes in the single chart. When using multiple timeframes, it is recommended (A.Elder "The new trading for a living") to adhere to a coefficient of 5 or 6. That is, the two older timeframes for a 5-minute chart will be 30 minutes and 3 hours.
The same indicator as here Скачайте Технический индикатор 'John Carters TTM Squeeze with MACD Multitimeframe' для MetaTrader 5 в магазине MetaTrader Market (mql5.com) , but instead of MACD, Bill Williams' AO (Awesome Oscillator) is used. It goes well with a sleeping Alligator to determine periods of "compression-calm", which may be followed by significant movement. It is useful to use an indicator from a higher timeframe (coefficient 5 or 6) to determine the possible direction of a breakout. I
This is actually just a combination of 3 classic TTM_Squeeze indicators, nothing special. As I know exactly this is implemented in original TTM_Squeeze PRO indicator. It shows strong, middle and weak squeeze. If someone interested, TTM_Squeeze is not completely John Carter's invention. Concept of squeeze is commonly known as well as the method of squeeze search using Bollinger Bands and Kelthner Channels. How to use As always there is a lot of variations. For example here is simple strategy Use
筛选:
无评论
回复评论
版本 1.3 2024.06.03
Minor fixes