Gold Trend 5
- 指标
- Sergei Linskii
- 版本: 1.5
- 更新: 26 十一月 2023
- 激活: 5
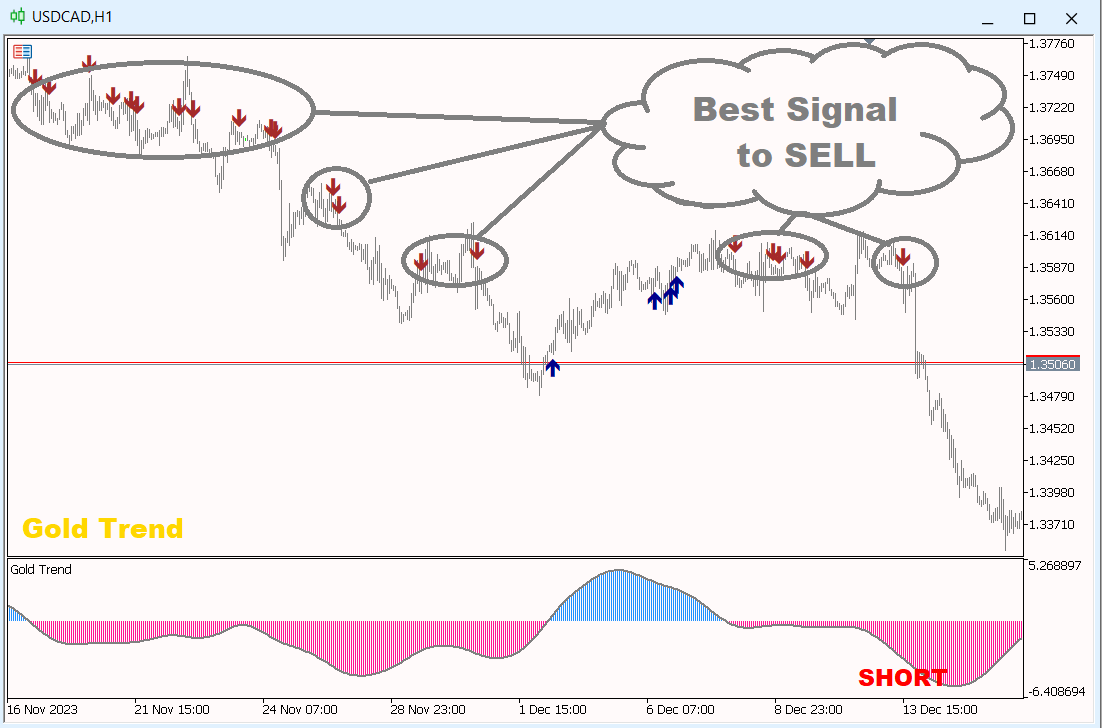
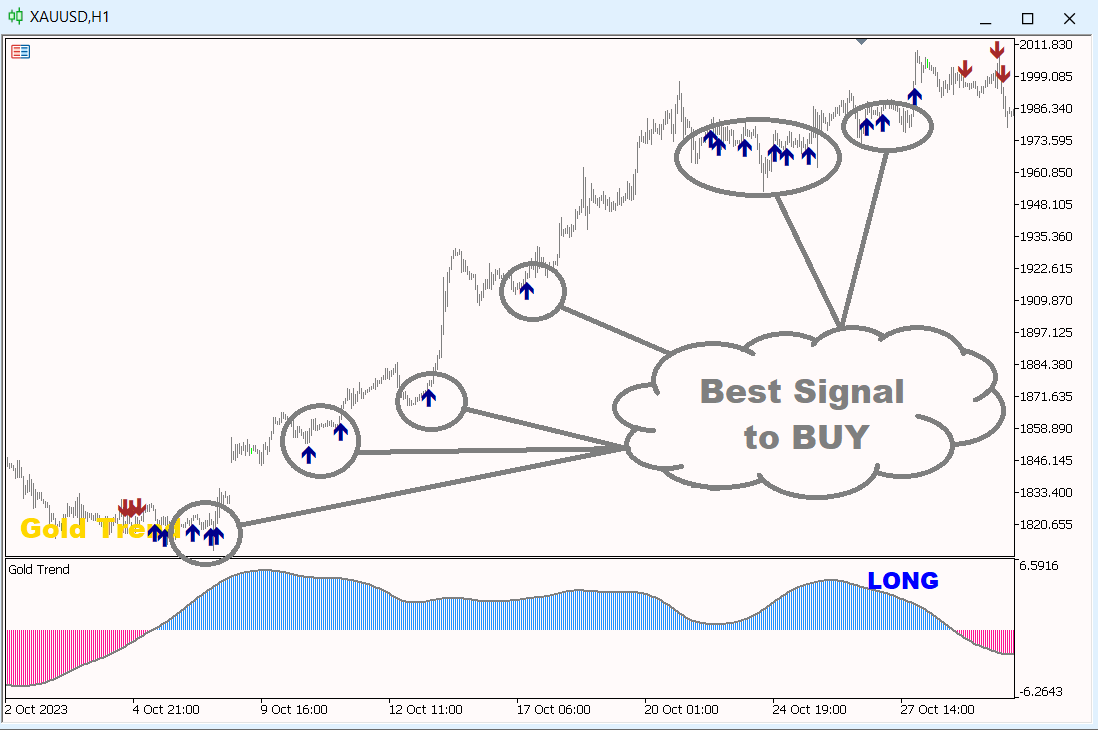
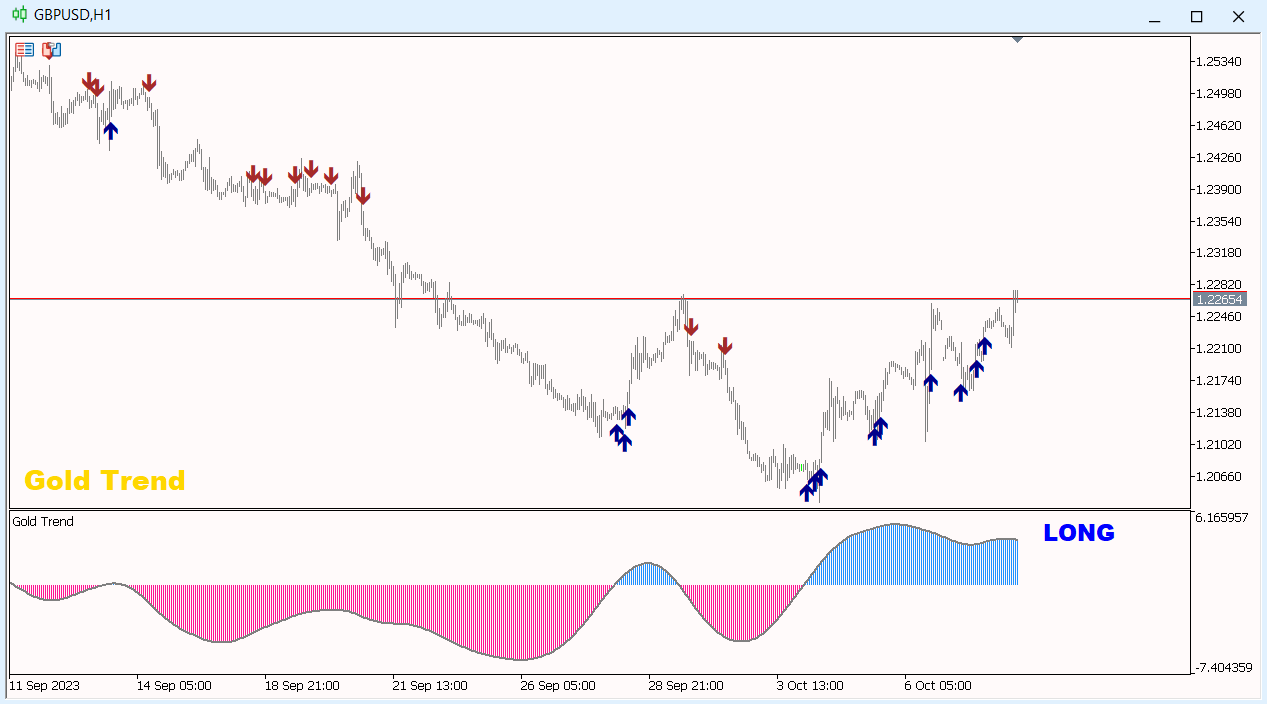
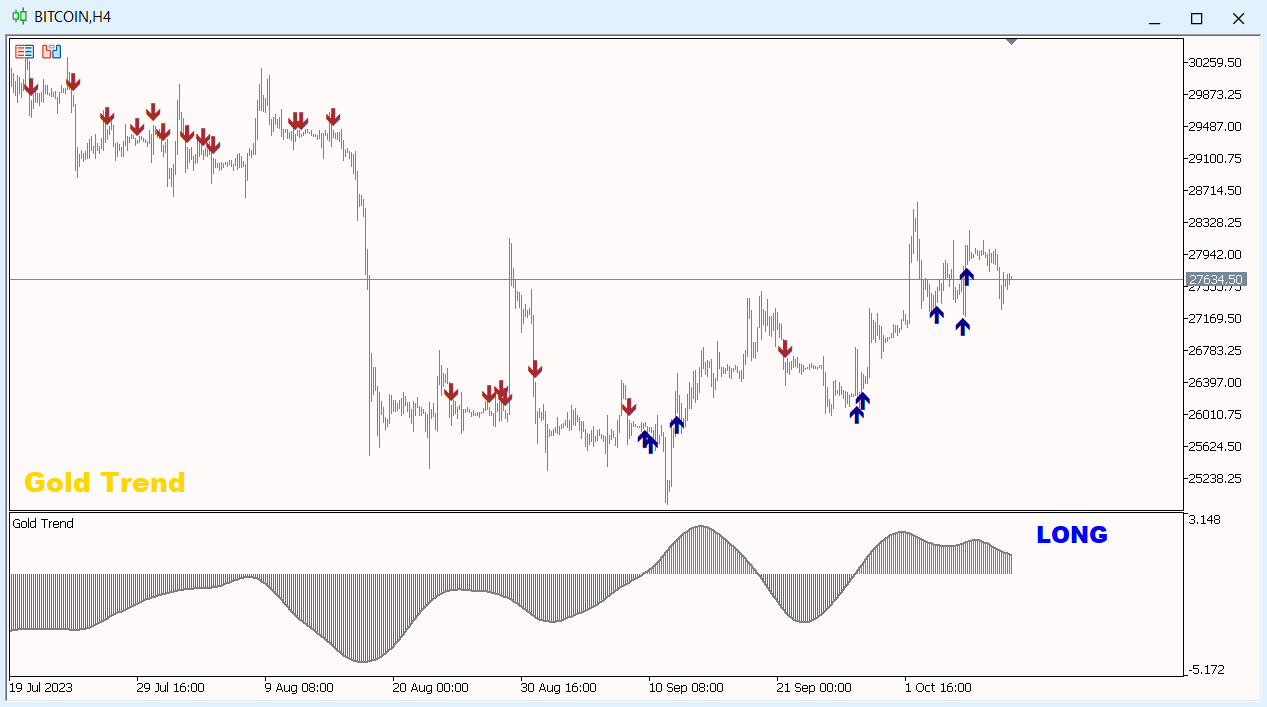
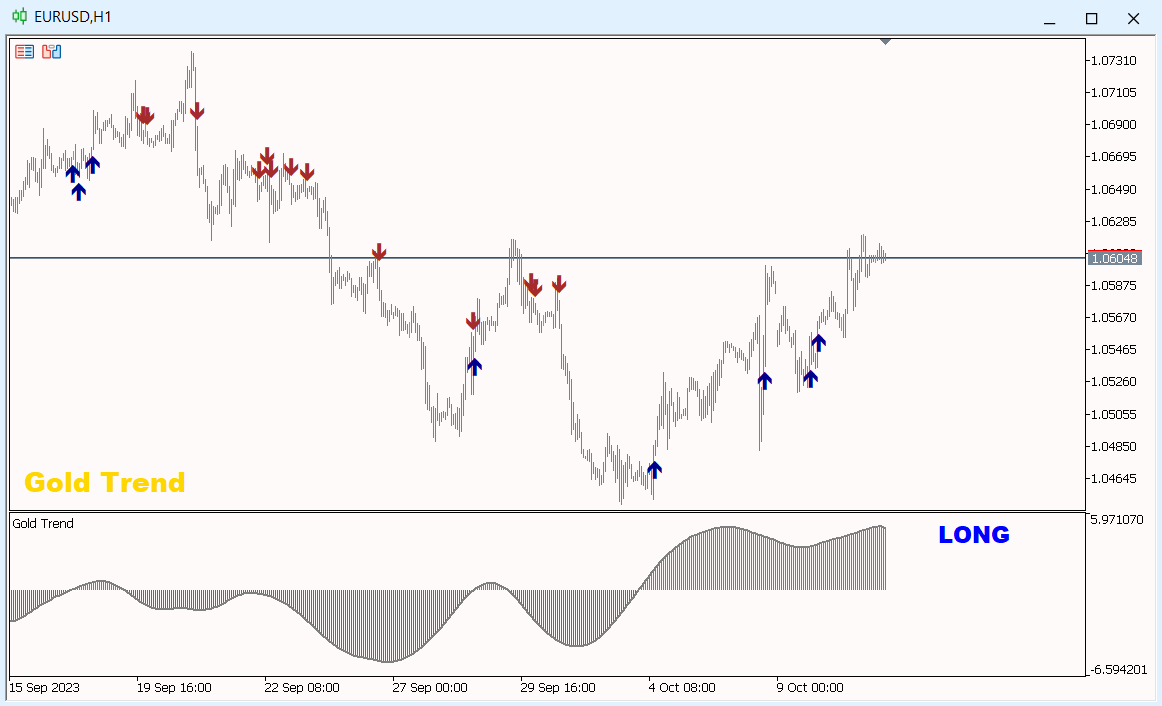
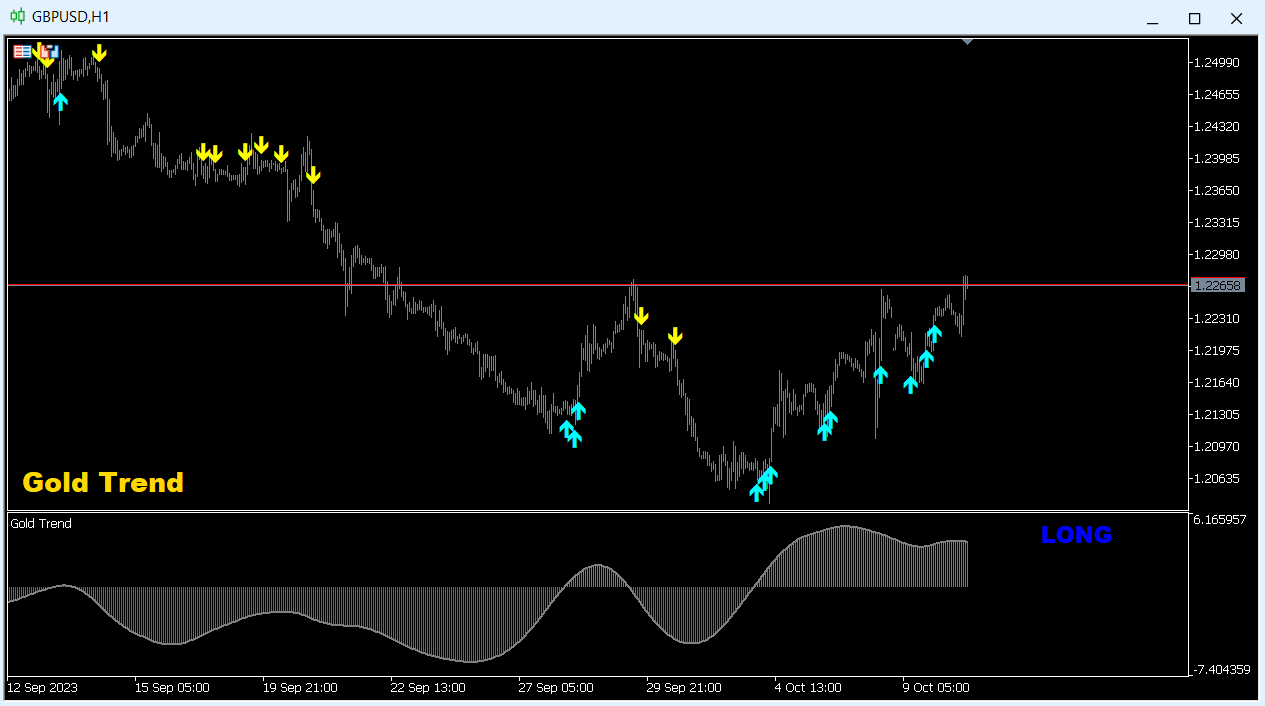
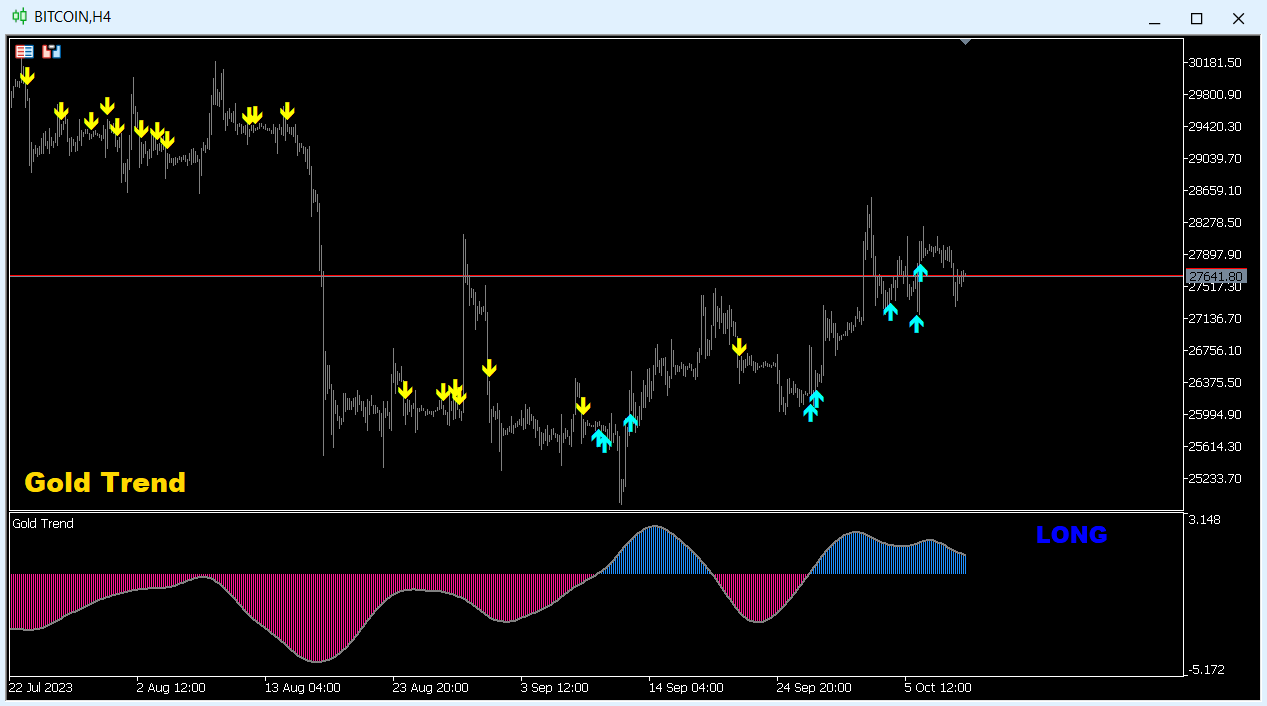
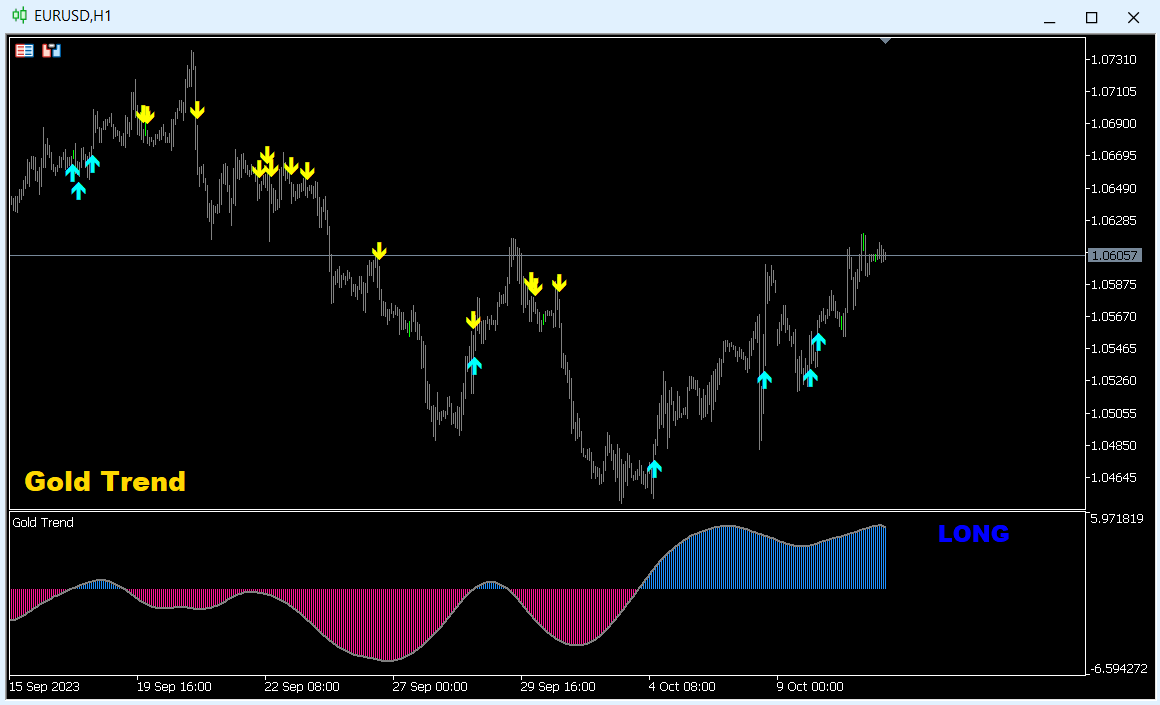
黄金趋势 - 这是一个很好的股票技术指标。该指标算法分析资产的价格走势,并反映波动性和潜在进入区。
最佳指标信号:
- 卖出 = 红色柱状图 + 红色短指针 + 同方向黄色信号箭头。
- 买入 = 蓝色柱状图 + 蓝色多头指针 + 同方向水蓝色信号箭头。
该指标的优点
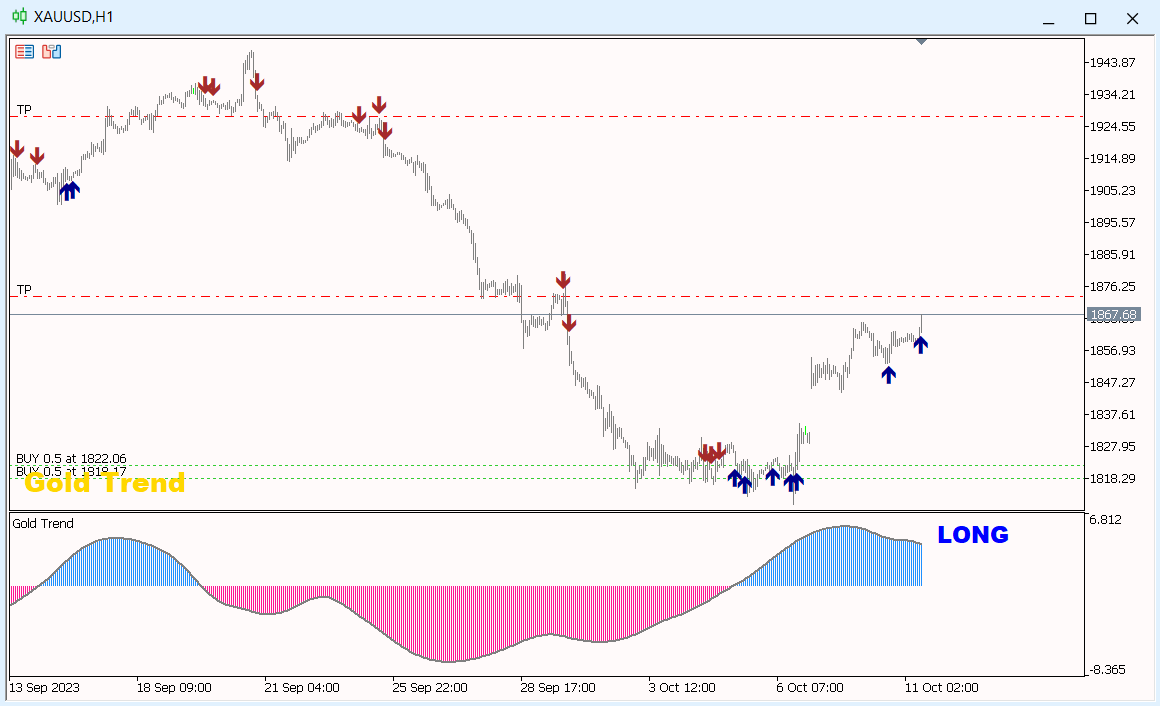
1. 该指标生成的信号准确度高。
2. 只有当趋势发生变化时,才能重新绘制已确认的箭头信号。
3. 您可以在任何经纪商的 MetaTrader 5 交易平台上进行交易。
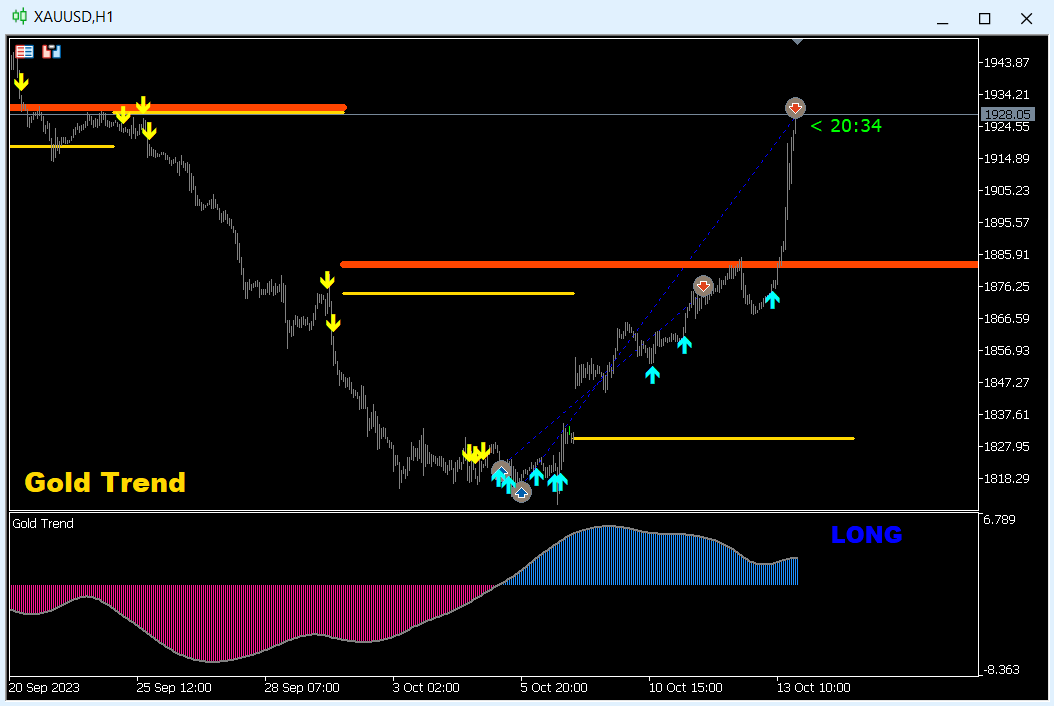
4. 您可以交易任何资产(货币、金属、加密货币、股票、指数等)。
5. 最好在 H1 时间框架(中期交易)上进行交易。
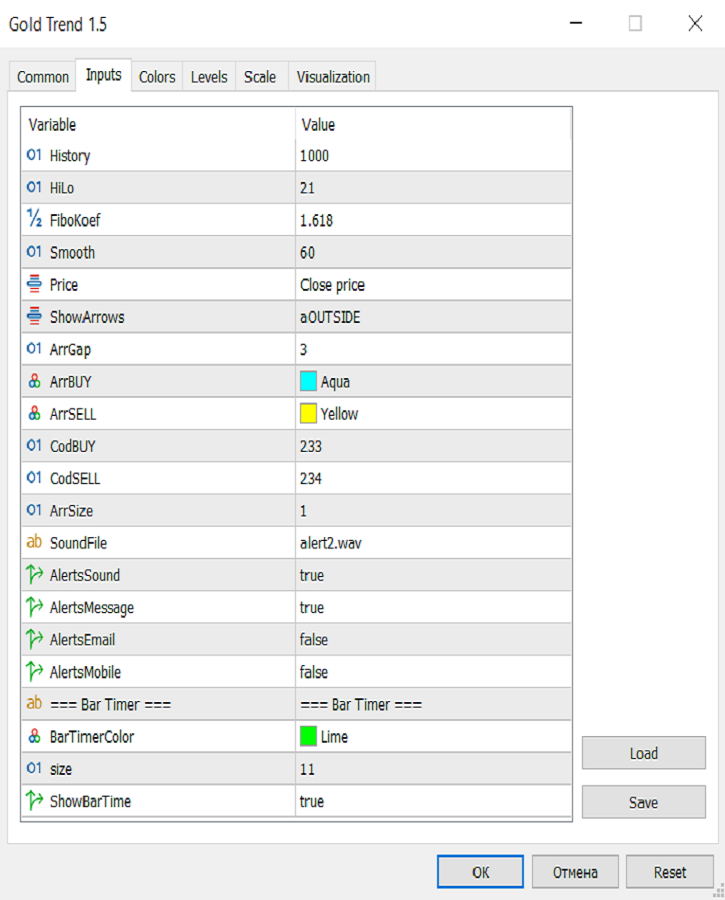
6. 在指标设置中可更改个别参数(TF、颜色等),以便每位交易者都能轻松定制适合自己的指标。
7. 该指标既可作为交易系统的主要补充,也可作为独立的交易系统使用。
注意:交易的入市准确性和盈利能力仅取决于交易者的技能。任何指标都只是交易者的助手,而非行动指南。
祝大家交易好运,稳定盈利!
Big Ups to the developer...the product is exactly as it is advertised. Every trend signal is clear, so far haven't lost a single trade within 8 days. Don't hesitate, just buy the product and see it for yourselves.