Economic news on chart
- 实用工具
- Makarii Gubaydullin
- 版本: 2.0
- 激活: 10
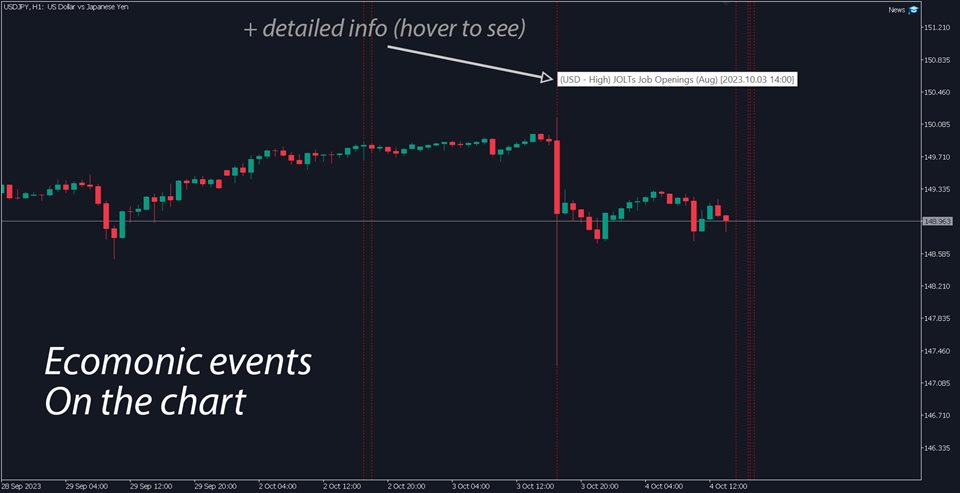
Visualization of the economic events on the chart
My #1 Utility: includes 65+ functions, including this indicator | Contact me if you have any questions | MT4 version
The indicator draws a vertical lines, showing you when economic news are coming.
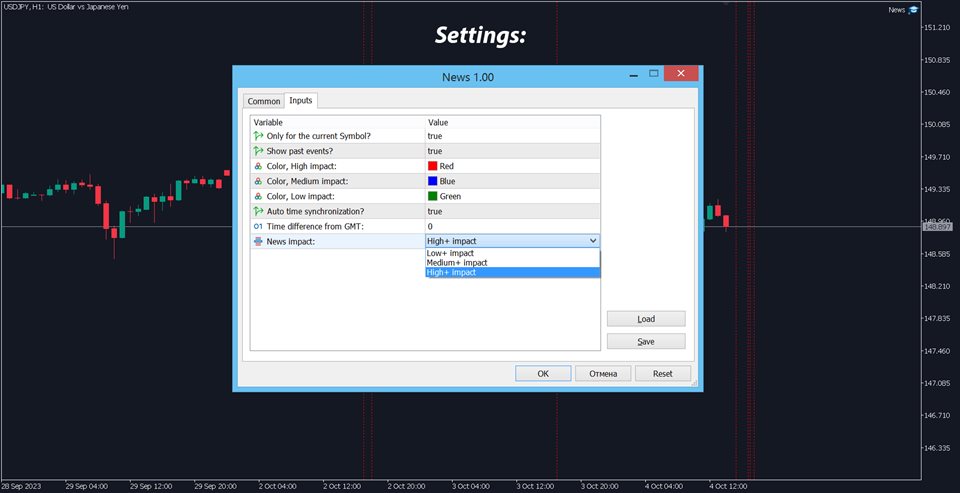
In the input settings you can adjust:
- Only for the current Symbol: if true, only events for the selected symbol will be displayed.
- Show past events: if true, past events will remain on the chart.
- Color: separately for 3 types of events.
- Broker time from GMT: set the time difference of your broker, compared to the Greenwich Mean Time.
- You can use [Auto time synchronization] option instead: time will be synchronized if the market is open.
- When setting the time manually:
Broker's time can be checked on the 'Market watch' (View -> Market Watch);
If GMT = 17:30, and the broker's time = 19:30: value should be +2 (hours).
If GMT = 17:30, and the broker's time = 16:30: value should be -1 (hour).
The program file should be placed to the "Experts" folder.
The tool needs your permission to access an external news website:
- In the terminal, go to the Tools -> Options (Ctrl+O) -> Expert Advisors:
- Activate 'Allow WebRequest for listed URL' option;
- Add URL "https://ec.forexprostools.com/" to the list;
