• 概述
  • 评论 (9)
  • 评论 (11)
  • 新特性

Enigmera

5

ENIGMERA: 市场的核心

重要提示:MQL5.com 演示版本在策略测试器中运行,可能无法完全反映 Enigmera 的功能。请查看描述、截图和视频了解详细信息。如有任何问题,请随时联系我!

该指标的代码已完全重写。版本 3.0 增加了新功能并修复了自指标发布以来积累的错误。
简介
这个指标和交易系统是金融市场的一种独特方法。ENIGMERA 使用分形周期来精确计算支撑和阻力水平。它展示了真实的积累阶段,并提供了方向和目标。无论是在趋势中还是在修正中,这个系统都能工作。

它是如何工作的
指标的大部分功能通过图表左侧的按钮控制,使得能够快速响应不同的市场情况。

按钮

  1. ON/OFF – 显示或隐藏整个指标。
  2. Channel – 激活支撑通道,显示可接受的偏差范围。
  3. Dev1 (第一偏差) – 指示价格在支撑偏差内的波动,信号表示市场正在整合或积累力量。
  4. Dev2 (第二偏差) – 显示价格在偏差之间的波动,表示趋势形成和方向。
  5. Dev3 (第三偏差) – 表示趋势的显著加速和高波动性。
  6. 45deg (45度) – 显示市场的节奏和相对于 45 度线的运动稳定性。
  7. Tgt1/2 (半目标) – 表示趋势目标线的一半,用于市场的最后阶段。
  8. Tgt (目标) – 趋势的目标线,表示关闭位置的水平。
  9. Vol (成交量) – 显示蜡烛上的成交量点,指示市场成交量的显著变化。
  10. X – 当市场达到目标线时,显示“X”。
  11. Lbls (标签) – 显示或隐藏线上的标签。
  12. RandC (随机颜色) – 更改指标线条和标签的颜色,以便更好地进行可视化。

系统功能
ENIGMERA 提供了市场当前状况的完整图像——与通常仅将过去的数据外推到现在和未来的市场指标不同。如果您处于支撑位置,那是真正的支撑;如果您处于阻力位置,那是真正的阻力。突破水平表示趋势发生变化。

ENIGMERA 专为需要可靠见解与客户共享的金融分析师和顾问设计,也适用于那些要求最高精度和信心的投资者。

它以其最佳精度脱颖而出,使交易者能够清晰、自信地评估他们的选择。

将 20 年的交易经验和知识融入一个全面的包中,ENIGMERA 既直观又依赖于用户。其效果依赖于用户的正确配置,以最大化性能。

推荐:

  • 货币对:所有货币对,所有市场
  • 时间框架:所有时间框架
  • 最低存款:没有最低存款要求
  • 账户类型:没有限制
  • 经纪商:没有限制

此复杂的指标非常适合有效的日内交易和 scalping 策略。通过 Enigmera 的高级算法优化您的自主交易,适用于外汇、股票、指数和加密货币市场。专为 MetaTrader 4 设计,Enigmera 简化了止损和风险管理。

您成为成功交易者所需的所有工具。Enigmera 适用于所有市场和时间框架——没有重绘。

您准备好将您的财务决策提升到终极水平了吗?


评论 9
TANJU2690
469
TANJU2690 2025.03.05 13:37 
 

I have never and ever seen any system like Enıgmera. What ever you want, you can find on it. İt is incredible system. And Cretor of aenıgmera, Mr.Ivan is more and more helpfull to understant of logıc Enigmera. Fistly, I want sent all thankfull to Ivan because he teach me Enıgmera Logıc and also share this marvelous product with market

smso9466eiou
85
smso9466eiou 2025.02.23 15:38 
 

a very good indicator that composes all in one, entry, exit and reverse. Great!

Osazeme Usen
432
Osazeme Usen 2024.12.31 12:38 
 

This is probably the best indicator I have seen in marketplace. Fantastic analysis with phenomenal success rates.

Update: Not great for direction, but fantastic for TP and SL.

推荐产品
This indicator works on MT4 and is very easy to use. When you receive a signal from it, you wait for that candle with the signal to close and you enter your trade at the beginning of the next new candle . A red arrow means sell and a green arrow means buy. All arrows comes with Alert  like for easy identification of trade signal. Are you okay with that? 1 minute candle 1 minute expire
Signal From Level
Yaroslav Varankin
Binary Options Support Resistance Indicator This indicator is designed for binary options trading and effectively shows retracements from support and resistance levels. Signals appear on the current candle. A red arrow pointing downwards indicates a potential selling opportunity, while a blue arrow pointing upwards suggests buying opportunities. All that needs adjustment is the color of the signal arrows. It is recommended to use it on the M1-M5 timeframes as signals are frequent on these timef
EARLY REMINDER: The Starting price is 65 price will rise soon up to 365$ and then 750$ after first 10 copies of sales. Grab this offer now! Introduction Hello, traders! Welcome to the demonstration of the Forex Beast Indicator , a comprehensive tool designed to assist aspiring traders in navigating the complexities of the forex market. This indicator incorporates seven essential components to provide a well-rounded trading experience: Moving Averages Colored Zones Support and Resistance Levels
Urgently
Tatiana Savkevych
The Urgently indicator is designed to quickly determine the situation in the market, reflect the state of the market and signal profitable levels for opening trades. Market conditions change quickly enough, requiring constant calibration of trading strategies. Recommended for use in conjunction with any of the oscillators. The Urgently forex market trend indicator shows the trend direction and entry points. It smooths out price fluctuations when generating a signal by averaging the data and the
Binary Option Signal
Yaroslav Varankin
Indicator for binary options arrow is easy to use and does not require configuration works on all currency pairs, cryptocurrencies buy signal blue up arrow sell signal red down arrow tips do not trade during news and 15-30 minutes before their release, as the market is too volatile and there is a lot of noise it is worth entering trades one or two candles from the current period (recommended for 1 candle) timeframe up to m 15 recommended money management fixed lot or fixed percentage of the depo
The Binary Profit Maker,  This indicator works on MT4 and is very easy to use. When you receive a signal from it, you wait for that candle with the signal to close and you enter your trade at the beginning of the next new candle . A Up Purple arrow means Buy and a Down Purple arrow means Sell. All arrows comes with Alert  like for easy identification of trade signal. Are you okay with that? How To Enter Trade? 1 minute candle 1 minute expire
Prozones Mt4
Renfred Dodzidenu Semabia
Discover Prozones Intraday MT4: Elevate Your Trading Success with Precision Are you tired of sifting through market noise in search of profitable trades? Look no further than Prozones Intraday MT4 – your ultimate solution for consistent trading success in the fast-paced world of intraday trading. Crafted with advanced algorithms and years of market expertise, this indicator empowers traders of all levels to make informed decisions with confidence. Key Features: Pinpoint Precision in Trend Analys
Over Arrow
Svyatoslav Kucher
Over Arrow  - уникальный авторский индикатор, имеющий возможность отображения сигналов в направлении основной тенденции, или против нее. Over Arrow  подходит для любого таймфрейма, валютной пары, но лучше всего использовать его на средних временных периодах, таких как М30, Н1, Н4. Сигналы индикатора не пропадают ни при каких условиях. Отличительной особенностью является наличие фильтра тенденции, при активации которого, сигналы будут появляться только в направлении основного движения. Параметры
Forex Prop Firm EA MT4
Dossa Nsanigna
5 (1)
If you’re searching for EA to pass prop firm challenge and reach minimum first payout, your search has come to the end. Avoid paying for prop firm challenge passing service and use   Forex Prop Firm EA  to pass the challenge and reach first payout within one week of trading or recover up to 200% of the challenge fee back. Forex Prop Firm EA is not HFT, martingale, grid or a speculative EA with unrealistic promises but a   risk-free   expert advisor based on winning mathematical formula designed
VR Cub
Vladimir Pastushak
VR Cub 这是获得高质量切入点的指标。该指标的开发是为了促进数学计算并简化对仓位入场点的搜索。多年来,该指标所针对的交易策略已被证明其有效性。交易策略的简单性是其巨大的优势,即使是新手交易者也能成功进行交易。 VR Cub 计算开仓点以及获利和止损目标水平,这显着提高了效率和易用性。查看使用以下策略进行交易的屏幕截图,了解简单的交易规则。 设置、设置文件、演示版本、说明、问题解决,可以从以下位置获取 [博客] 您可以在以下位置阅读或撰写评论 [关联] 版本为 [MetaTrader 5] 计算入场点的规则 开仓 要计算入场点,您需要将 VR Cub 工具从最后一个高点拉伸到最后一个低点。 如果第一个点在时间上早于第二个点,交易者等待柱线收于中线上方。 如果第一个点在时间上晚于第二个点,交易者等待柱线收于中线下方。 根据上述条件,严格在 柱线收盘 后建仓。 换句话说,如果我们在小时图上进行交易,那么从最高点到最低点的时间距离必须超过24小时,最高点和最低点之间的点数必须大于或等于平均价格变动每天。 维持和改变市场地位 可以有多个未平仓头寸;每个头寸都可以单独修改。 VR Cub
Antabod Gamechanger
Rev Anthony Olusegun Aboderin
*Antabod GameChanger Indicator – Transform Your Trading!*   Are you tired of chasing trends too late or second-guessing your trades? The *Antabod GameChanger Indicator* is here to *revolutionize your trading strategy* and give you the edge you need in the markets!   Why Choose GameChanger? *Accurate Trend Detection* – GameChanger identifies trend reversals with *pinpoint accuracy*, ensuring you enter and exit trades at the optimal time.   *Clear Buy & Sell Signals* – No more guesswork! T
PZ Penta O MT4
PZ TRADING SLU
The Penta-O is a 6-point retracement harmonacci pattern which usually precedes big market movements. Penta-O patterns can expand and repaint quite a bit. To make things easier this indicator implements a twist: it waits for a donchian breakout in the right direction before signaling the trade. The end result is an otherwise repainting indicator with a very reliable trading signal. The donchian breakout period is entered as an input. [ Installation Guide | Update Guide | Troubleshooting | FAQ | A
Super Reversal Pattern
Parfait Mujinga Ndalika
Super Reversal Pattern Indicator Unlock the power of advanced pattern recognition with our Super Reversal Pattern Indicator. Designed for traders seeking precision and reliability, this indicator identifies one of the most effective reversal patterns in technical analysis, offering a significant edge in your trading strategy. Key Features: Non-Repainting Accuracy: Enjoy the confidence of non-repainting technology. Once a Super Reversal Pattern is detected, it remains static, providing consiste
Risk Reward Panel
HESAMEDDIN ABDOLRAHIM RAHI
Risk Reward Panel   This is a useful tool to plan a trade risk to reward visually. The indicator is very simple to use with minimum settings.  Long or Short You can use the indicator for both long and short positions.  Lot Size Calculator You can also use this indicator as a lot size calculator. If you set the risk amount the indicator will calculate the lot size for you based on the stop loss line. You do not need to calculate the lot size manually. 
Cosmic Diviner X Planet
Olena Kondratenko
4 (2)
This unique multi-currency strategy simultaneously determines the strength of trends and market entry points, visualizing this using histograms on the chart. The indicator is optimally adapted for trading on the timeframes М5, М15, М30, Н1. For the convenience of users, the indicator renders the entry point (in the form of an arrow), recommended take profit levels (TP1, TP2 with text labels) and the recommended Stop Loss level. The take profit levels (TP1, TP2) are automatically calculated for
Swing Breakout Sequence | SBS presents a comprehensive trading strategy designed to help traders identify and capitalize on market swings and breakouts. The Swing Breakout Sequence (SBS) strategy is built around a series of well-defined steps to optimize trading decisions and improve profitability. Version 2.01: Add "golden entry" - entry by fib. Stoic added to it (fibo) he calls this setup gold SBS here is the   video the description of the setup starts at 18min24sec Version 2: + Add BOS filter
Night ghost
Dmitriy Kashevich
Night Ghost - Arrow indicator for binary options. This is a reliable assistant to you in the future! - No redrawing on the chart -Works great on EUR/USD currency pairs! -Indicator accuracy up to 90% (Especially at night) -No long setup required (Perfectly set up for Binary Options) - Not late signals - The appearance of a signal on the current candle -Perfect for M1 period (No More!) - Eye-friendly candle color (Red and Blue) -Installed Alert Working with it: - Blue arrow shows signa
Elliott Wave Trend MT4
Young Ho Seo
4 (7)
Elliott Wave Trend was designed for the scientific wave counting. This tool focuses to get rid of the vagueness of the classic Elliott Wave Counting using the guideline from the template and pattern approach. In doing so, firstly Elliott Wave Trend offers the template for your wave counting. Secondly, it offers Wave Structural Score to assist to identify accurate wave formation. It offers both impulse wave Structural Score and corrective wave Structure Score. Structural Score is the rating to sh
This indicator Super Channel Pro indicator.Indicator displays trend movement. Indicator calculates automatically line. Features FiltPer - displays indicator channel period. deviation - displays indicator channel deviation. deviation2 - displays indicator channel deviation. How to understand the status: If the arrow is green, trend is up. If the arrow is red, trend is down. ///////////////////////////////////////////////////////////////////////////////////////////////////////////////////////////
Free automatic fibonacci
Tonny Obare
4.67 (48)
Free automatic Fibonacci is an indicator that automatically plots a Fibonacci retracement based on the number of bars you select on the BarsToScan setting in the indicator. The Fibonacci is automatically updated in real time as new highest and lowest values appears amongst the selected bars. You can select which level values to be displayed in the indicator settings. You can also select the color of the levels thus enabling the trader to be able to attach the indicator several times with differe
FREE
To download MT5 version please click  here . This is the exact conversion from TradingView: "WaveTrend [LazyBear]" By "zeusuk3". One of the coolest indicators out there to detect overbought and oversold zones. It can be used as a part of more complicated strategy and for confirming a potential trade setup. There are buffers to use in EAs also. The indicator is loaded light and non-repaint. - You can message in private chat for further changes you need. Thanks for downloading 
Seff
Oleg Borisov
Indicator  Seff designed for both beginners and professionals. This indicator generates possible entry points to open BUY and SELL trades and will help you: reduce the number of errors when opennig orders; predict price movement(in absent of significant news); do not rush to close profitable trades prematurely and increase profit; do not rush to enter the market and wait for "easy prey": and increase the profitability of trading. Does not redraw and works by opening bar. Settings ALARM- enabl
Trend PRO Expert Advisor
Nguyen Tran Ha
1 (1)
Trend PRO Expert Advisor  is developed base on the PipFinite Trend PRO Indicator, the best indicators on the market so far. PipFinite  Trend Pro's smart algorithm detects the trend, filters out market noise and gives entry signals with exit levels.  This EA open order when the indicator has buy/sell signals and set SL/TP follow the indicator rules. You can read more information about PipFinite Trend PRO indicator  here . Important Information   This EA will only work if you purchased  PipFinte
Advanced Stochastic Scalper
Evgeny Belyaev
4.53 (15)
Advanced Stochastic Scalper - is a professional indicator based on the popular Stochastic Oscillator. Advanced Stochastic Scalper is an oscillator with dynamic overbought and oversold levels, while in the standard Stochastic Oscillator, these levels are static and do not change. This allows Advanced Stochastic Scalper to adapt to the ever-changing market. When a buy or a sell signal appears, an arrow is drawn on the chart and an alert is triggered allowing you to open a position in a timely mann
The new update makes this indicator a complete tool for studying, analyzing and operating probabilistic patterns. It includes: On-chart Multi-asset percentage monitor. Configurable martingales. Twenty-one pre-configured patterns , including Mhi patterns and C3. An advanced pattern editor to store up to 5 custom patterns. Backtest mode to test results with loss reports. Trend filter. Hit operational filter. Martingale Cycles option. Various types of strategies and alerts. Confluence between patte
Please follow the "How To Trade" instructions exactly for best results Wycoff theory is vastly used by institutional traders but when it comes to retail traders the concept isn't well understood by most. It is even more difficult to implement in intraday & swing trading. This No REPAINT indicator helps you in analyzing the market cycles and plots buy/sell signals at the start of trending phase. It studies the market strength of bulls and bears and does a effort Vs reward matrix calculation befor
Skalping即时指indicator. 该信号与地下室的购买或销售值指示器箭头结合。 当箭头和显示四个时间帧的基底指标在预测中重合时,会考虑强信号。 例如卖出信号: 1. 红色箭头给出了卖出头寸的初始信号 2. 所有时间框架中的红色方块-确认打开卖出头寸。 我建议保留指标的默认设置。 适用于所有货币对。 我建议在主要货币对上使用它 : 澳元/美元澳元兑美元 欧元/美元欧元兑美元 英镑/美元英镑兑美元 美元/加元美元兑加元 美元/瑞士法郎美元兑瑞士法郎 美元/日元美元兑日元。 AUD / USD Австралийский доллар против доллара США EUR / USD Евро против доллара США GBP / USD Британский фунт против доллара США USD / CAD Доллар США против канадского доллара USD / CHF Доллар США против швейцарского франка USD / JPY Доллар США про
"The Squeeze indicator attempts to identify periods of consolidation in a market. In general the market is either in a period of quiet consolidation or vertical price discovery. By identifying these calm periods, we have a better opportunity of getting into trades with the potential for larger moves. Once a market enters into a "squeeze," we watch the overall market momentum to help forecast the market direction and await a release of market energy." The StdATR Squeeze Channel combines standard
Goal Time
Mourad Ezzaki
GOAL TIME is an expert advisor based on the notion of time, it studies the change of price according to time, and it finally detects the best time to execute a good order. The EA is based on an indicator that draws a price curve in relation to time, this curve is deduced by an algorithm that analyzes old data. Then, the EA exploits the generated curve and executes the correct order. In case of incorrect choice, the EA has the mission to limit the losses. After a thorough study of this strategy o
AURUS Arrow
Dmitriq Evgenoeviz Ko
Индикатор AURUS Arrow предусматривает возможность выявления различных особенностей и закономерностей в динамике цен, которые не видны невооруженным глазом. AURUS Arrow — индикатор, показывающий стрелки покупки-продажи, которые определенно помогут каждому трейдеру, который не знает как торговать. На основании этой информации, трейдеры могут предположить дальнейшее движение цены и корректировать свои стратегии, соответственно. Буферная стрелка покупки-продажи с сигнальным алертом. Тайм-фрейм - л
该产品的买家也购买
Bomb Bank Signal
Igor Pereira Calil
5 (1)
炸彈銀行訊號:您對 MetaTrader 4 的信心指標 Bomb Bank Signal 是 MetaTrader 4 的一個強大指標,旨在識別金融市場中最相關的趨勢。如果您正在尋找一種能夠準確預測運動的工具,那麼炸彈庫就是您需要的盟友。 運作原理: 該指標結合了三種不同的方法——成交量分析、蠟燭收盤價和對稱趨勢——來偵測和發出買賣機會訊號。當炸彈銀行識別出買入機會時,它就像一顆「炸彈」;當它偵測到賣出訊號時,它就像一個「頭骨」。 為什麼炸彈銀行不一樣? 完全可靠性:炸彈庫訊號不會刪除訊號。訊號一旦發出,就會一直存在,確保您不會錯過任何機會。 極為準確:炸彈庫不會發出錯誤訊號。它會即時更新您的訊息,隨著市場的變化進行調整,但保持先前訊號的透明度。 即時更新:訊號被即時識別並在必要時更新,使您能夠快速響應市場變化。 最大化您的結果: 炸彈銀行訊號是識別趨勢持續走勢的理想選擇。例如,如果您已經做空並且指標在 M15 發出買入訊號,那麼現在就是平倉或部分下單的最佳時機,反之亦然。 此外,經過仔細分析,我們建議您遵循M30、H1和H4上的訊號,停損僅50點。這使得價格朝著有利
这是最赚钱的指标。它的表现非常出色。无论市场上有什么兴趣,你都能看到。 几乎在所有情况下,它都只会给你一个长期的市场观点,但不要被愚弄,以为它是受事件约束的。不是这样的。它能找到市场上最大的利益所在,并将其展示给你。别忘了,最大的资金(利益)每天都不会在市场上出现。这是您没有遇到过的情况。月租金可能会给您一到两个信号,仅此而已。但当我们谈论大资金时,他们就是这样行事的。 如果您想了解更多,请点击这里。 这是最赚钱的指标。它的表现非常出色。无论市场上有什么兴趣,你都能看到。 几乎在所有情况下,它都只会给你一个长期的市场观点,但不要被愚弄,以为它是受事件约束的。不是这样的。它能找到市场上最大的利益所在,并将其展示给你。别忘了,最大的资金(利益)每天都不会在市场上出现。这是您没有遇到过的情况。月租金可能会给您一到两个信号,仅此而已。但当我们谈论大资金时,他们就是这样行事的。 如果您想了解更多,请点击这里。
Gann Zone Pro
Kirill Borovskii
This indicator identifies and displays zones, as it were areas of strength, where the price will unfold. The indicator can work on any chart, any instrument, at any timeframe. The indicator has two modes. The indicator is equipped with a control panel with buttons for convenience and split into two modes. Manual mode: To work with manual mode, you need to press the NEW button, a segment will appear. This segment is stretched over the movement and the LVL button is pressed. The level is displayed
Trade Invest Pro
Dmitriy Kashevich
Trade Invest Pro - Boss in the world of cryptocurrency! This indicator is ideal for cryptocurrency trading! Work on Trade Invest Pro took us half a year! But not in vain! Now only accurate signals near support - resistance levels! He showed himself well on timeframes m5 m15 for binary options! Optionally, it can be configured for forex for timeframes m30 and more! Reacts well to news! Doesn't paint! and does not disappear from the schedule! As soon as a red arrow appears, open a deal fo
Gann Swing Structure
Kirill Borovskii
5 (1)
This indicator is based on the mathematics of the great trader W.D. Ganna. With its help, you can easily find strong levels by analyzing swings to find the optimal entry point. The indicator works on all instruments and all timeframes. The indicator is fully manual and has control buttons. All you need to do is press the NEW button, a segment will appear, which you can place on any movement, swing or even 1 candle that you want to analyze. By placing the segment, press the OK button. A grid (th
API Reversal Master
Idowu Peter Afuye
1 (1)
API Reversal Master – The Reversal Detection Indicator for MT4 Spot Reversals with API Reversal Master API Reversal Master is MT4 indicator designed to help traders identify possible market reversals . Whether you're trading forex, stocks, or commodities, this tool provides alerts and visual cues to enhance your decision-making. Key Features: Alerts and Notification – Get notified when a possible reversal point is detected. Color Changes – Visual indication of possible trend shifts.
Connect Indicator
Sukunthakan Ngernbamrung
Connect Indicator is a tool used for connecting indicators between the MQL market and MT4. The connected indicators are made by our group and can be used for other applications, such as sending messages to the Line application or Telegram application. If you have any questions, please don't hesitate to ask us to receive support. Function and indicator buffer Buffer one is the high price of the previous candle. Buffer two is the high price of the previous candle. Usage To connect indicators to fu
ON Trade Optuma Astro
Abdullah Alrai
5 (4)
当然可以!以下是您提供的文本的中文翻译: 引入 MT4 天文指标:您的终极天体交易伙伴 您准备好将交易体验提升到天文高度了吗?不用再寻找,就在我们的革命性 MT4 天文指标中。这个创新工具超越了传统的交易指标,利用复杂的算法提供无与伦比的天文洞察力和精确计算。 指尖上的宇宙信息: 瞻仰一个详尽的面板,展示了一宝藏般的天文数据。了解行星的地理/太阳心坐标,太阳/地球距离,亮度,伸长度,星座,黄道和赤道坐标,甚至是水平坐标——每个细节都经过精心计算并呈现得美轮美奂。指标生成的垂直线对应于时间值,为您的交易旅程提供了宇宙的视角。 行星线条与关系: 在您的图表上欣赏行星线条的魔力,具有可自定义的比例和角度。通过直观的控制面板轻松切换每个行星线条的可见性。通过连结、六分、四分、三分、对冲和逆行等指标,发现行星关系的艺术。在您选择的时间范围内探索这些宇宙构造,使您能够识别重要的交易机会。 揭示甘恩的智慧: 通过受甘恩启发的平方垂直线揭示潜在的反转时机。这种创新修改将甘恩历经考验的原则带入现实,帮助您提前了解市场的转向和趋势。 月亮引导: 在您的图表上优雅地导航月相,因为新月和满月点缀其间。月亮周期
Smooth price for Monarch MT4
Konstantin Gruzdev
3.67 (3)
The Smooth Price technical indicator is used for plotting a smoothed line as close to the price of the financial instrument as possible, and serves to eliminate its noise components. The indicator is part of the Monarch trading system, but here it is presented as an independent technical analysis tool. The indicator is based on the cluster digital filter , which, unlike the ClusterSMA , is applied directly to the price time series. Smooth Price does not redraw (except the very last, zero bar) an
Mafaranga
Phillimon Shumbusho
The real market buy/Sell signals, you can trust.  This indicator tracks the trend strength, the market strength, the real current volume, and the price direction to give traders and investors the optimum point for entry in the form of signals. The time frames range from 5 minutes to one (1) hour chart. Trading on higher time frames produce the best outcomes, but also do produce less frequent trades, compared to trading on lower time frames.
Jeslyn
Justine Kelechi Ekweh
這是一個多用途系統,既適合外匯手動交易者,也適合作為黃牛系統或進入非常強勁勢頭的策略、二元期權交易者或由通用 EA 在自動化交易中使用。 Jeslyn 是一種基於多年研究的策略,專注於特定的價格行為策略。它可能看起來像一個簡單的箭頭指示器,但它具有復雜且邏輯的算法。它不會根據其他指標進行計算,而僅根據價格行為進行計算。我找到了一種方法來解釋趨勢、趨勢與動量的差異、背離與成交量價差分析之間的關係。有一些小型的供應和需求區域,其中的頭寸充滿動力,這些是我們在它們開始時想要的地方。他們還說我們無法在 Metatrader 中獲得真實交易量,好吧,我找到了一種方法來獲取它並通過價格動量操縱它。成交量、動量和分歧是這頓飯的秘訣。 我想要一種能夠經受住時間和所有市場條件考驗的策略,我在新手時期就發現了這一點,但不明白為什麼它們有時會發生得如此美妙,但有時卻會慘敗,所以我放棄了其他策略並專注於這一點,它經受住了時間的考驗(6年了,而且還在繼續),儘管並不是所有的市場條件都可以交易,這是我當時不理解的,一旦我接受了這一點,我就開始努力尋找適當的市場條件,這使得完全的感覺。我們只有在市場成熟
Arbitrage Indicators 是一个专业且易于使用的外汇交易指标,它使用最新AI的套利模型的最佳交易原则。 该指标提供准确的买入和卖出信号。只适用于货币对。 它共有六个不同的指标选项, MACD、KDJ、RSI、CCI、RVI、DEMARK。 可供用户自由切换。 它直观展示了货币对的走向及反转信号,当两线交叉颜色时货币即有很大概率发生反转。 推荐时间框架: 任何时间框架都有效,但我们喜欢使用   M5、 M15、M30 和 H1   也是不错的选择! 推荐交易品种: 我们喜欢使用的最佳交易品种是   M15 时间框架上的 EURUSD 、GBPUSD 、USDJPY、 USDCAD、 AUDUSD 、USDCHF 有问题可联系:QQ:2813871972 微信: FX-AIEA 邮箱:2813871972@qq.com
ZO Trend
Trung Le Hoang
4 (4)
Important!! ZO Trend can't work on MN timeframe. /*--------------------------------------------------------------------------------------------------------------------------------------------------------------------------------------------- ZO Trend an indicator used to search for entry point. With the session candle algorithm on many timeframe, ZO Trend creates an area for traders find good Entry Point. ZO SYSTEM BASIC SETUP :  https://www.youtube.com/watch?v=qdNOXHWozNw ZO TREND User guide : 
Market Interest
Paul Edunyu Carissimo
Oni Scalper
Goh Cheng Wai
3.67 (3)
Dear Onis, This Indicator is used for   GBPUSD, US30 and GOLD on 1-Min Chart . For US30 , Depending on your broker, Minimum Lot Size will differ from 0.01 to 1.0 lots. My Current Account is trading at 1.0 lots at $1 per point . Please check with your Broker what's the Margin Required for your Minimum lot sizes before you trade on your Real account. I have Forward Tested the indicator for around 6 months before releasing it to the public. ( No Demo is available for the Indicator, Strategy Teste
Automatic, live & interactive picture of all trendlines. Assign push, email and sound alerts to the lines of your choice and be informed about price rollback, breakout, rollback after breakout, number of rollbacks, line expiration by double breakout. Correct, drag or delete the lines and interactively tune the line system. https://youtu.be/EJUo9pYiHFA . Chart examples https: //www.mql5.com/en/users/efficientforex Price Interaction Events All events are effective immediately and only after one
The indicator displays the probable ( Support and resistance ) levels. The indicator draws horizontal and trend levels of support and resistance. The indicator settings: Trends - the mode for displaying trend lines or horizontal lines of support and resistance Yes - display trend lines only No - display horizontal lines only UseResource - use the resources built into the indicator. Yes - use the ZigZag indicator from the resources of the product. No - use a custom ZigZag indicator. HistoryBar -
THE GRAFF III
Antonin Skaryd
The [GRAFF] III manual trading system is based on multiple MetaTrader (MT4) indicators. Together, the entire PACK of GRAFF III indicators makes an advanced trading tool. The system consists of over 20 different custom-built indicators which have been carefully selected and tested in the long term to produce strong and efficient trading signals. The particular indicators are based on different mathematical formulas, so the entire system is calibrated to remove false signals from its own indicator
This indicator allows you to see the strength of the trend on all timeframes. It can be used for all currency pairs. The indicator can be displayed in the form of a column (from left to right): status buy / sell / strong buy / strong sell, strength of the trend in percentage, pips last candle, body candle now, remaining time, and the timeframe of M1 to MN. Information contained below (from left to right): total trend percent, sell percent, buy percent.
You can fins our other products from link : https://www.mql5.com/en/users/drbastem/seller   Also, you can ask all your questins from email : haskayafx@gmail.com or mobile : +90 530 867 5076 or @MehmetBastem    on telegram application This indicator is used to determine the trend. Standard Osma indicator is used. It has the indicator warning system: beep, e-mail and has three types of alerts, including messages to mobile phone. It shows the best performance on the chart of 5 minutes. When the
You can fins our other products from link : https://www.mql5.com/en/users/drbastem/seller   Also, you can ask all your questins from email : haskayafx@gmail.com or mobile : +90 530 867 5076 or @MehmetBastem    on telegram application This indicator is used to determine the trend. Standard Three Moving Average and ADX indicators are used. It has the indicator warning system (audio, e-mail) and three types of alerts, including messages to mobile phone. It shows the best performance on M5. When
This indicator is used to determine the trend. Standard Three Moving Average and ADX indicators are used. It has the indicator warning system (audio, e-mail) and three types of alerts, including messages to mobile phone. It shows the best performance on M5. When the trend value reaches the value set, the warning system is activated. This indicator works only with Forex symbols. Inputs SoundAlarm = true - Sound Alert Sendmail=true - Send an e-mail in case of a buy or sell signal Sendnotification
You can fins our other products from link : https://www.mql5.com/en/users/drbastem/seller   Also, you can ask all your questins from email : haskayafx@gmail.com or mobile : +90 530 867 5076 or @MehmetBastem    on telegram application This indicator is used to determine the trend. Standard MACD indicator is used. It has the indicator warning system: beep, e-mail and has three types of alerts, including messages to mobile phone. It shows the best performance on the chart of 5 minutes. When the
该指标提供了一种基于'回归通道工具'概念的强大市场分析方法。通过利用此工具,交易员可以在图表上对回归通道获得出色的控制,从而使他们能够做出更明智的交易决策。 '回归通道工具'是交易员工具箱中的一个强大工具。它旨在为价格趋势和潜在支撑和阻力水平提供有价值的见解。该工具特别适用于在趋势内部可视化修正波动,提供了对价格动态的综合视图。 以下是更详细地了解使用此指标的关键功能和优势: 通道水平和支撑/阻力: 该指标的主要优势之一是其能够生成作为动态支撑和阻力区域的通道水平。这些水平在确定潜在的入场和出场点方面至关重要,增强了交易策略的精确性。 修正波动水平: 通过启用修正波动水平,交易员可以在更大的趋势内识别潜在的修正。这个功能有助于识别回撤,并帮助交易员利用有利的价格波动。 直接控制: 该指标的控制面板允许无缝地操纵回归通道。交易员可以微调填充和射线选项等设置,提供符合其分析风格的通道定制视图。 更高时间框架分析: 为了获得更广泛的视角,该指标具有从更高时间框架加载数据的功能。这个功能可以帮助交易员评估不同时间尺度上的趋势和通道,促进对市场动态的更全面了解。 如何使用: 设置趋势线: 首先,
A simplistic indicator informing a user on RSI divergence by sending messages to mobile device and email. The indicator draws 2 vertical lines, marking two RSI extrema that formed the divergence. You get the alert, open the charts and make a decision. The indicator does not show past divergences, thus when you attach it to a chart for the first time you see nothing. Graphics and alerts will appear as soon as divergences do. Drop it in Tester to see how it works. Parameters: RSIPeriod - number of
ZLevels
Sergio Andres Zuleta Lopez
This indicator is based on Market Profile methodology, which contains the Z-Zone , unlike the latter, allows visualization of multiple time frames on the same graph. This methodology has proven to be very effective for: Reduce the number of windows required to analyze or track a financial asset. Display important resistance areas (ROZ), support (SoZ) and average distribution (PoC) in different periods of time. Define areas to take profits as well locate technical stop loss. Analysis in the devel
Pan PrizMA CD Phase is an analogue of the МetaТrader 5 indicator , and is an option based on the Pan PrizMA indicator. Details . Averaging by a quadric-quartic polynomial increases the smoothness of lines, adds momentum and rhythm. Extrapolation by the sinusoid function near a constant allows adjusting the delay or lead of signals. The value of the phase - wave status parameter (which is close in meaning to the trigonometric phase or the angle of the radius-vector rotation in the trigonometric p
Green Wall Arrows
Daniel Luchinger
1 (1)
The Name Green Wall : Arrows hits a lot of TP, by changing the idea of non using SL as something bad, but instead use Small TP and a lot of free Margin and Patience. Use micro TP and a lot of Free Margin with this indicator on Forex. It also can be used with Binary Options. This strategy is intended to be traded Manually. This Indicator runs on Open Bar, arrows will delete when price are against it. The only Indicator Parameter is Alerts true/false, all the rest is included inside the code. Arro
Golden Monowave
Ahmed Mohamed Ali
Golden Monowave is monowave indicator, the monowave theory is one of Elliott wave approach and one of most complicate and accurate method. Golden Monowave can shortcut many major steps to identify and describe the monowave. It works on any timeframe and with any trading instrument, including currencies, indices, futures, etc. Input Parameters initial_Bars - set the initial number of bars to calculate. wave_color - select the color of the wave. label_color - select the color of labels. temp_labe
作者的更多信息
Meravith
Ivan Stefanov
该指标从每个点分析成交量,并计算该成交量的市场疲劳水平。 它由三条线组成: 牛市成交量疲劳线 熊市成交量疲劳线 表示市场趋势的线。该线根据市场是熊市还是牛市变化颜色。 您可以从任何选择的起点分析市场。一旦达到成交量疲劳线,确定一个新的起点来开始下一次分析。 您可以分析任何内容——趋势和修正。一个好的方法是每次当它达到趋势线或形成顶部或底部时移动指标。 趋势线与某一成交量疲劳线之间的距离越大,说明该方向的成交量越大。 趋势线可以作为开单的位置,而疲劳线则用于收集利润。 该系统非常独特,但又极其直观。 市场上没有类似的产品。 使用没有限制。可以在所有市场和所有时间框架中应用。 重要提示:在MetaTrader4测试器中检查时,双击紫色线条,然后左右移动它以分析市场。 如有任何问题,请随时联系我。
这是最赚钱的指标。它的表现非常出色。无论市场上有什么兴趣,你都能看到。 几乎在所有情况下,它都只会给你一个长期的市场观点,但不要被愚弄,以为它是受事件约束的。不是这样的。它能找到市场上最大的利益所在,并将其展示给你。别忘了,最大的资金(利益)每天都不会在市场上出现。这是您没有遇到过的情况。月租金可能会给您一到两个信号,仅此而已。但当我们谈论大资金时,他们就是这样行事的。 如果您想了解更多,请点击这里。 这是最赚钱的指标。它的表现非常出色。无论市场上有什么兴趣,你都能看到。 几乎在所有情况下,它都只会给你一个长期的市场观点,但不要被愚弄,以为它是受事件约束的。不是这样的。它能找到市场上最大的利益所在,并将其展示给你。别忘了,最大的资金(利益)每天都不会在市场上出现。这是您没有遇到过的情况。月租金可能会给您一到两个信号,仅此而已。但当我们谈论大资金时,他们就是这样行事的。 如果您想了解更多,请点击这里。
GANN Master
Ivan Stefanov
5 (1)
基于甘氏久经考验的方法,甘氏的精确目标呈现在您面前。该工具旨在使交易更加顺畅和直观。通过向上拖动白线或向下拖动绿线,您将立即明白为什么甘氏的技术在交易世界中仍然具有影响力。 甘氏策略围绕着高度准确地预测市场走势,而该工具将这种力量带到了您的指尖。无论您是经验丰富的交易员还是新手,操作这些线条将为您提供深入的见解,了解为什么他的方法经得起时间的考验。 基于甘氏久经考验的方法,甘氏的精确目标呈现在您面前。该工具旨在使交易更加顺畅和直观。通过向上拖动白线或向下拖动绿线,您将立即明白为什么甘氏的技术在交易世界中仍然具有影响力。 甘氏策略围绕着高度准确地预测市场走势,而该工具将这种力量带到了您的指尖。无论您是经验丰富的交易员还是新手,操作这些线条将为您提供深入的见解,了解为什么他的方法经得起时间的考验。
Imbalance Pro
Ivan Stefanov
5 (3)
该指标测量所选时段内牛市和熊市之间的不平衡,并在两点之间显示一条直线。 如果牛市的成交量大于熊市,则该线变为绿色。 如果熊市成交量更大,则为红色。 直线还显示成交量的百分比差异。 该指标在单独的窗口中显示相同的数据。您还可以看到分割后的成交量。 该指标有两种模式。 为此,左上方有一个按钮、  - 如果不按下,它将测量市场任意点与当前价格之间的不平衡。 - 如果按下按钮,则可以测量市场任意两点之间的平衡。 该指标测量所选时段内牛市和熊市之间的不平衡,并在两点之间显示一条直线。 如果牛市的成交量大于熊市,则该线变为绿色。 如果熊市成交量更大,则为红色。 直线还显示成交量的百分比差异。 该指标在单独的窗口中显示相同的数据。您还可以看到分割后的成交量。 该指标有两种模式。 为此,左上方有一个按钮、  - 如果不按下,它将测量市场任意点与当前价格之间的不平衡。 - 如果按下按钮,则可以测量市场任意两点之间的平衡。
Fortex
Ivan Stefanov
5 (1)
Fortex: 货币强度指标 Fortex 是一款强大的工具,用于衡量主要货币的强度:USD、EUR、JPY、GBP、AUD、CAD、CHF 和 NZD。 只需将指标添加到图表中,它会自动显示任何时间框架下最强和最弱的货币。 该指标包括一个可自定义的选项,可以设置用于计算的蜡烛数量。默认情况下,它使用100根蜡烛,但您可以轻松调整此设置以适应您的交易策略。 Fortex: 货币强度指标 Fortex 是一款强大的工具,用于衡量主要货币的强度:USD、EUR、JPY、GBP、AUD、CAD、CHF 和 NZD。 只需将指标添加到图表中,它会自动显示任何时间框架下最强和最弱的货币。 该指标包括一个可自定义的选项,可以设置用于计算的蜡烛数量。默认情况下,它使用100根蜡烛,但您可以轻松调整此设置以适应您的交易策略。
FREE
Levelss
Ivan Stefanov
5 (1)
LEVELSS 指标显示 - 每日看涨和看跌区域。每天从 00:00 至 23:59 都可以看到。 - 周线看涨和看跌区域。每周从周一 0:00 至周五 23:59。 - 从特定时间框架特别计算的通道,显示在所有其他时间框架上。默认情况下,这是 4 小时时间框架,您可以将其更改为您希望交易的任何其他时间框架。它是不间断计算的。 屏幕左上方显示区域和通道是看涨、看跌还是中性。当三个区域都看涨时,当前蜡烛上会出现一个绿点。当三个区域都看跌时,则出现粉红色。 该指标没有任何限制。 LEVELSS 指标显示 - 每日看涨和看跌区域。每天从 00:00 至 23:59 都可以看到。 - 周线看涨和看跌区域。每周从周一 0:00 至周五 23:59。 - 从特定时间框架特别计算的通道,显示在所有其他时间框架上。默认情况下,这是 4 小时时间框架,您可以将其更改为您希望交易的任何其他时间框架。它是不间断计算的。 屏幕左上方显示区域和通道是看涨、看跌还是中性。当三个区域都看涨时,当前蜡烛上会出现一个绿点。当三个区域都看跌时,则出现粉红色。 该指标没有任何限制。
Most visited level PRO
Ivan Stefanov
5 (1)
该指标基于实际经验。 输入顶部/底部的日期/时间。 它会计算从顶部/底部到当前时刻访问次数最多的级别。 每根新蜡烛都会自动更新。 您可以针对不同的趋势和时间框架同时使用多个指标。 长度总是从您的时间段开始绘制到现在。 实用的专业工具。 该指标基于实际经验。 输入顶部/底部的日期/时间。 它会计算从顶部/底部到当前时刻访问次数最多的级别。 每根新蜡烛都会自动更新。 您可以针对不同的趋势和时间框架同时使用多个指标。 长度总是从您的时间段开始绘制到现在。 实用的专业工具。 该指标基于实际经验。 输入顶部/底部的日期/时间。 它会计算从顶部/底部到当前时刻访问次数最多的级别。 每根新蜡烛都会自动更新。 您可以针对不同的趋势和时间框架同时使用多个指标。 长度总是从您的时间段开始绘制到现在。 实用的专业工具。
FREE
Fifty Pro
Ivan Stefanov
5 (1)
FIFTY 指标现在提供自动化版本,无需手动绘制水平线。此版本可自动在图表上绘制每日、每周、每月和年度水平线,确保准确性并节省时间。此外,提供按钮以切换这些水平线的可见性,实现完全自定义。对于喜欢手动操作的用户,免费版本仍然可用且功能齐全,让交易者可以根据自己的需求选择手动或自动工具。 最符合逻辑的指标之一。 高度可靠。 FIFTY 指标现在提供自动化版本,无需手动绘制水平线。此版本可自动在图表上绘制每日、每周、每月和年度水平线,确保准确性并节省时间。此外,提供按钮以切换这些水平线的可见性,实现完全自定义。对于喜欢手动操作的用户,免费版本仍然可用且功能齐全,让交易者可以根据自己的需求选择手动或自动工具。 最符合逻辑的指标之一。 高度可靠。
Sense
Ivan Stefanov
5 (2)
SENSE 是一个自动系统,它将选定的 GANN 方法与分形计算相结合。系统会告诉我们在哪里开仓,在哪里平仓。无需再将时间浪费在复杂的计算上 - SENSE 会为您完成一切。只需安装指标即可。 基本原则: 当价格高于白线时,市场看涨 在白线上方买入,在白线下方止损 绿线为上涨目标 当价格低于白线时,市场看跌。 在白线下方卖出,在白线上方止损 红线为下行目标 双绿线或红线表示较强的区域。 为什么是 SENSE? 获利目标: SENSE 自动设置获利目标,帮助您最大限度地提高交易成功率。 自动适应: 该指标可自动重新计算任何时间框架,提供准确可靠的信号,无需手动调整。 非常适合剥头皮交易。 查看演示版! SENSE 是一个自动系统,它将选定的 GANN 方法与分形计算相结合。系统会告诉我们在哪里开仓,在哪里平仓。无需再将时间浪费在复杂的计算上 - SENSE 会为您完成一切。只需安装指标即可。 基本原则: 当价格高于白线时,市场看涨 在白线上方买入,在白线下方止损 绿线为上涨目标 当价格低于白线时,市场看跌。 在白线下方卖出,在白线上方止损 红线为下行目标
Fifty
Ivan Stefanov
The 50% level holds significant importance in the market because it acts as a dividing line between bullish and bearish movements. Traders often rely on this midpoint to analyze trends and predict potential reversals. It is among the most logical and widely recognized concepts in financial markets. The 50% level also serves as a psychological barrier, influencing decisions of both retail and institutional traders, making it a cornerstone in technical analysis. One of the few indicators on the ma
FREE
Separated Volume
Ivan Stefanov
5 (1)
該指標可有效地將外匯市場的交易量分為看漲和看跌兩類。 此外,它還提供了計算和顯示您所選擇的任何時期的看漲和看跌交易量總和的功能。 您可以移動圖表上的兩條藍線,輕鬆調整時段,從而根據您的交易需求定制精確的交易量分析。 如果您覺得它有用,我們將感謝您的評論! 交易愉快 該指標可有效地將外匯市場的交易量分為看漲和看跌兩類。 此外,它還提供了計算和顯示您所選擇的任何時期的看漲和看跌交易量總和的功能。 您可以移動圖表上的兩條藍線,輕鬆調整時段,從而根據您的交易需求定制精確的交易量分析。 如果您覺得它有用,我們將感謝您的評論! 交易愉快  該指標可有效地將外匯市場的交易量分為看漲和看跌兩類。 此外,它還提供了計算和顯示您所選擇的任何時期的看漲和看跌交易量總和的功能。 您可以移動圖表上的兩條藍線,輕鬆調整時段,從而根據您的交易需求定制精確的交易量分析。 如果您覺得它有用,我們將感謝您的評論! 交易愉快
FREE
Two Snakes
Ivan Stefanov
5 (2)
Rolling VWAP
Ivan Stefanov
这是MetaTrader的Rolling VWAP指标。它基于一定数量的蜡烛图计算交易量加权平均价格(VWAP),并可选择标准偏差带进行更深入的市场分析。该指标不会重绘,也不会锚定。 指标概览 Rolling VWAP计算 :主线(水蓝色)计算特定数量的柱形图( barsToCalculate )的VWAP。这个VWAP根据每个柱形图的交易量进行调整,相应地加权典型价格。 偏差带 :该指标还包括两条额外的线,代表上偏差带(青绿色)和下偏差带(红色)。这些带基于用户定义的偏差倍数( DEV1 )计算,为VWAP提供视觉边界。默认的 DEV1 设置为3.0,意味着带距离VWAP线为三个标准偏差,可以根据需要进行调整。 用户输入 : DEV1 :标准偏差带的倍数。 barsToCalculate :考虑VWAP和标准偏差计算的柱形图数量。默认设置为34,但可以根据您的交易策略进行更改。 使用与应用 趋势识别 :Rolling VWAP线提供了一段时间市场平均价格水平的概念。当价格位于水蓝色Rolling VWAP线之上时,通常表示看涨趋势,暗示上行动能。相反,当价格位于此线以下时,表明看跌趋
Stefanov
Ivan Stefanov
The indicator displays support and resistance zones defined logically using the MACD. The entire concept is explained in the video, with specific examples shown. The indicator works on any instruments and timeframes. It does not repaint. After placing it on the chart, please go through all the timeframes sequentially, from monthly to 1-minute, so that all lines load correctly. After that, you can start using it. The concept is unique and has not been seen in other systems or indicators.
Versuss
Ivan Stefanov
Versuss 是一个特殊的工具。该指标可以为您的分析创建新的工具。您可以在平台上比较任意两个工具。 示例 1 如果您正在交易 USDJPY,您的分析还可以包括 SP500 和 NIKKEI225。 借助 Versuss,您可以比较一个指数相对于另一个指数的走势,然后将其与 USDJPY 货币对进行比较。 如果外汇市场跟随指数的走势,您可以清楚地预测接下来会发生什么,并提前做出决策。 您可以使用相应的指数比较其他外汇货币对,采用相同的方法。 示例 2 如果您的投资组合包含类似的工具,您可以将它们相互比较。这样,您可以看到哪个处于上升趋势,哪个处于下降趋势。 阿迪达斯 / 耐克 谷歌 / 微软 黄金 / 白银 示例 3 比较外汇交叉货币对: AUDNZD / EURGBP EURJPY / NZDCAD 示例 4 这是一个相当具有异国情调的例子,更适合那些从事社会学和社群经济学的人。 您可以比较看似无法比较的事物,但它们可能会给您带来不同类型的有用见解。 “面包和马戏”这个短语源自拉丁语 “panem et circenses”,字面意思是“面包和游戏”或“面包和马戏”。它与对罗马政治家
FREE
Trend Angle 45
Ivan Stefanov
在交易领域,45 度角的趋势被认为是可持续的。 然而,由于没有明确的方法说明,准确测量这个关键角度仍然是一个挑战。交易者只能猜测它是如何计算的,应该有多少根蜡烛,以及适当的图表缩放比例是多少。 我们已经解决了这个问题,并从逻辑上定义了所有条件,现在向您介绍趋势角 45。这是一款基于对支撑、目标和整体走势等各种市场因素的复杂分析,将 45 度趋势线可视化的工具。 尽管 45 度趋势线通常被视为交易神话和民间传说,但 Trend Angle 45 现在已成为我们交易武器库中的一个宝贵工具,而且非常有效。它能够反映趋势的细微差别,并预测趋势开始和结束时的变化。 使其成为理想的评估工具。 时间真的很神奇! 您将面对不同市场趋势的深刻而准确的分析。 在市场周期中,价格会在 45 度线上方或下方移动,表明周期的不同阶段。 在趋势开始时,价格会在该线下方移动。在趋势过程中,价格可能沿着该线移动,在趋势结束时,甚至可能出现高于该线的极端值。除了最初的趋势阶段,其他阶段的顺序可能会有所不同。 这是一种评估外汇、股票和指数趋势的有用工具,尤其是对长期趋势而言,评估运动强度可能具有挑战性。 加入
Nova Trend
Ivan Stefanov
Nova Trend指标可识别特定时间周期内最常被触及的价格水平。您可以分析任意您喜欢的时间框架,例如:月线、周线、日线、4小时、1小时、30分钟等。确定关键水平后,指标将在图表上绘制一个关注区域(矩形),显示所有触及该关键价格的蜡烛。帮助您轻松且精准地分析趋势与回调。 本方法的优势: 在图表上直观清晰地呈现关键价格区域。 轻松识别潜在的反转点或强势趋势行情。 改善风险管理,清楚了解历史上市场出现显著反应的价格区域。 适用于所有市场,没有任何限制。 Nova Trend指标可识别特定时间周期内最常被触及的价格水平。您可以分析任意您喜欢的时间框架,例如:月线、周线、日线、4小时、1小时、30分钟等。确定关键水平后,指标将在图表上绘制一个关注区域(矩形),显示所有触及该关键价格的蜡烛。帮助您轻松且精准地分析趋势与回调。 本方法的优势: 在图表上直观清晰地呈现关键价格区域。 轻松识别潜在的反转点或强势趋势行情。 改善风险管理,清楚了解历史上市场出现显著反应的价格区域。 适用于所有市场,没有任何限制。
筛选:
TANJU2690
469
TANJU2690 2025.03.05 13:37 
 

I have never and ever seen any system like Enıgmera. What ever you want, you can find on it. İt is incredible system. And Cretor of aenıgmera, Mr.Ivan is more and more helpfull to understant of logıc Enigmera. Fistly, I want sent all thankfull to Ivan because he teach me Enıgmera Logıc and also share this marvelous product with market

smso9466eiou
85
smso9466eiou 2025.02.23 15:38 
 

a very good indicator that composes all in one, entry, exit and reverse. Great!

Ivan Stefanov
2986
来自开发人员的回复 Ivan Stefanov 2025.02.23 18:12
Thank you! Wishing you profits!
Rutt Tungkiratichai
1718
Rutt Tungkiratichai 2025.02.01 00:11 
 

This is very good and accurate indicator.

Ivan Stefanov
2986
来自开发人员的回复 Ivan Stefanov 2025.02.01 11:30
Thank you for the good words! Brgds / Ivan
Osazeme Usen
432
Osazeme Usen 2024.12.31 12:38 
 

This is probably the best indicator I have seen in marketplace. Fantastic analysis with phenomenal success rates.

Update: Not great for direction, but fantastic for TP and SL.

Ivan Stefanov
2986
来自开发人员的回复 Ivan Stefanov 2025.01.02 16:45
Osazeme Usen 2024.12.31 12:38 # EN
This is probably the best indicator I have seen in marketplace. Fantastic analysis with phenomenal success rates. Thank you for the good words! Brgds/Ivan
vincenzo1964
984
vincenzo1964 2024.07.11 15:59 
 

Assolutamente straordinario a cominciare da chi l'ha ideato Ivan, Sono assolutamete felice dell'affito/prova fatto, Enigmera è sorprendente, ti accompagna sempre sul lato giusto della tendenza sino alla fine del percorso. Se poi parliamo del dott. Ivan e della sua disponbilità, se potessi postare gli screenshot e la guida passo passo che mi ha concesso, è commovente e sorprendente. Se volete fare buon trading con giudizio e responsabilità potete tranquillamente perdere qualche giorno del vostro tempo a capire la logica ed il ragionamento che c'è dietro enigmera, solo così sarete sempre dal lato giusto del trend sino alla fine, sopratutto quando ci sono le news ed enigmera già vi sta indicando i livelli di tp da raggiungere. Proprio oggi ero già lon su eurusd e sell su usdchf ed entrambe dopo le notizie chiuse in tp. Consiglio anche l'indicatore Speed, leggetene l'utilizzo, la forza e ciò che vi può indicare, io ci sto lavorando sodo seguito da ivan perchè l'unione di enigmera e speed è devastante, alla fine dell'affitto acquisterò engmera mentre affitterò mensilmente speed (il costo è di 30.00€ mentre l'acquisto è di 3000€), ma il suo potenziale per il trend followhing e immenso, saluti e buon trading a tutti, grazie Ivan...

Irfan
1286
Irfan 2024.06.21 13:44 
 

用户没有留下任何评级信息

Ivan Stefanov
2986
来自开发人员的回复 Ivan Stefanov 2025.01.02 16:46
Irfan 2024.06.21 13:44 # EN
Enigmera gives you an entirely different way of looking at the market. It does not look into the past, what has happened in the past stays in the past it gives you a picture of what is going on in the market right now and gives you logical understanding for trading. The author is so confident about his product the he gave me a full version of the indicator so that I could try it for a week before I decided to buy it. Ivan spent a lot of time chatting with me, educating me how to use the indicator. He is very quick and replies to your questions. I have already seen good results with this indicator and it has increased my confidence. Thank you for the good words, Irfan!
Sajid Iqubal
183
Sajid Iqubal 2024.06.08 21:59 
 

Enigmera is an exceptional trading indicator that has greatly improved my trading performance. Ivan Stefano offers the best support and guidance, always going above and beyond like an elder brother to me. His guidance and the effectiveness of Enigmera make a winning combination. I highly recommend using Enigmera.

eman11
1104
eman11 2023.11.22 20:29 
 

用户没有留下任何评级信息

Ivan Stefanov
2986
来自开发人员的回复 Ivan Stefanov 2025.01.02 16:47
eman11 2023.11.22 20:29 # EN
I was an institutional trader for a decade and rarely write reviews or spend more then 50 or a 100 on any indicator as my trading is well established, but always open to something interesting and new. The author is an intelligent and real trader , per many chats with him, and this indicator compliments well existing trading as is from a unique perpective. The price is not cheap , but it it is a legit and unique system, is as decribed, which can be put to good use particulalry with experienced traders who may best integrate multiple styles and ideas successfully. Great work Ivan. Thank you for the good words, Eman11 / Brgds / Ivan
ebel
1221
ebel 2023.11.22 14:41 
 

This indicator is undoubtedly expensive but I believe it to be the Ferrari of indicators and the only one you will ever need. The video in the overview is self explanatory, take the time to find the setups as described and the R:R can be extremely good. I have only been using the indicator for a week but have found several very profitable trades and feel confident that I can make back more than sufficient each month to cover my 6 monthly rental. The author is extremely responsive and helpful and is starting a telegram group so that we can share prospective setups. I believe the indicator is difficult to get to work in Strategy Tester but the author is open to free trials which demonstrates his trust in the product. I can't post images here but I will post a trade I made this morning in the comments. I can't promise it is the perfect setup as I am still learning but just this one trade covered my monthly rental cost. IMPORTANT - do not try to change to a lower timeframe while the indicator is loaded. The code is incredibly complex and trying to recalculate everything on a lower tf over a significant period will freeze your MT4 installation. You will need to delete the indicator from your MT4, force a shut down, restart and re-install. Once you understand the complexity it is not a problem, just open another chart on a lower tf or delete the indicator, change the tf and put it back on.

UPDATE 23/11

I have just seen that the author has been debarred from selling! I have just paid for 6 months rental and this is a good indicator that is making me money. What to I do after 6 months if I can't renew? And why has this happened, the author is very courteous and helpful.

回复评论
版本 3.2 2025.03.08
What's new in ver. 3.2?

1. There are two new buttons:

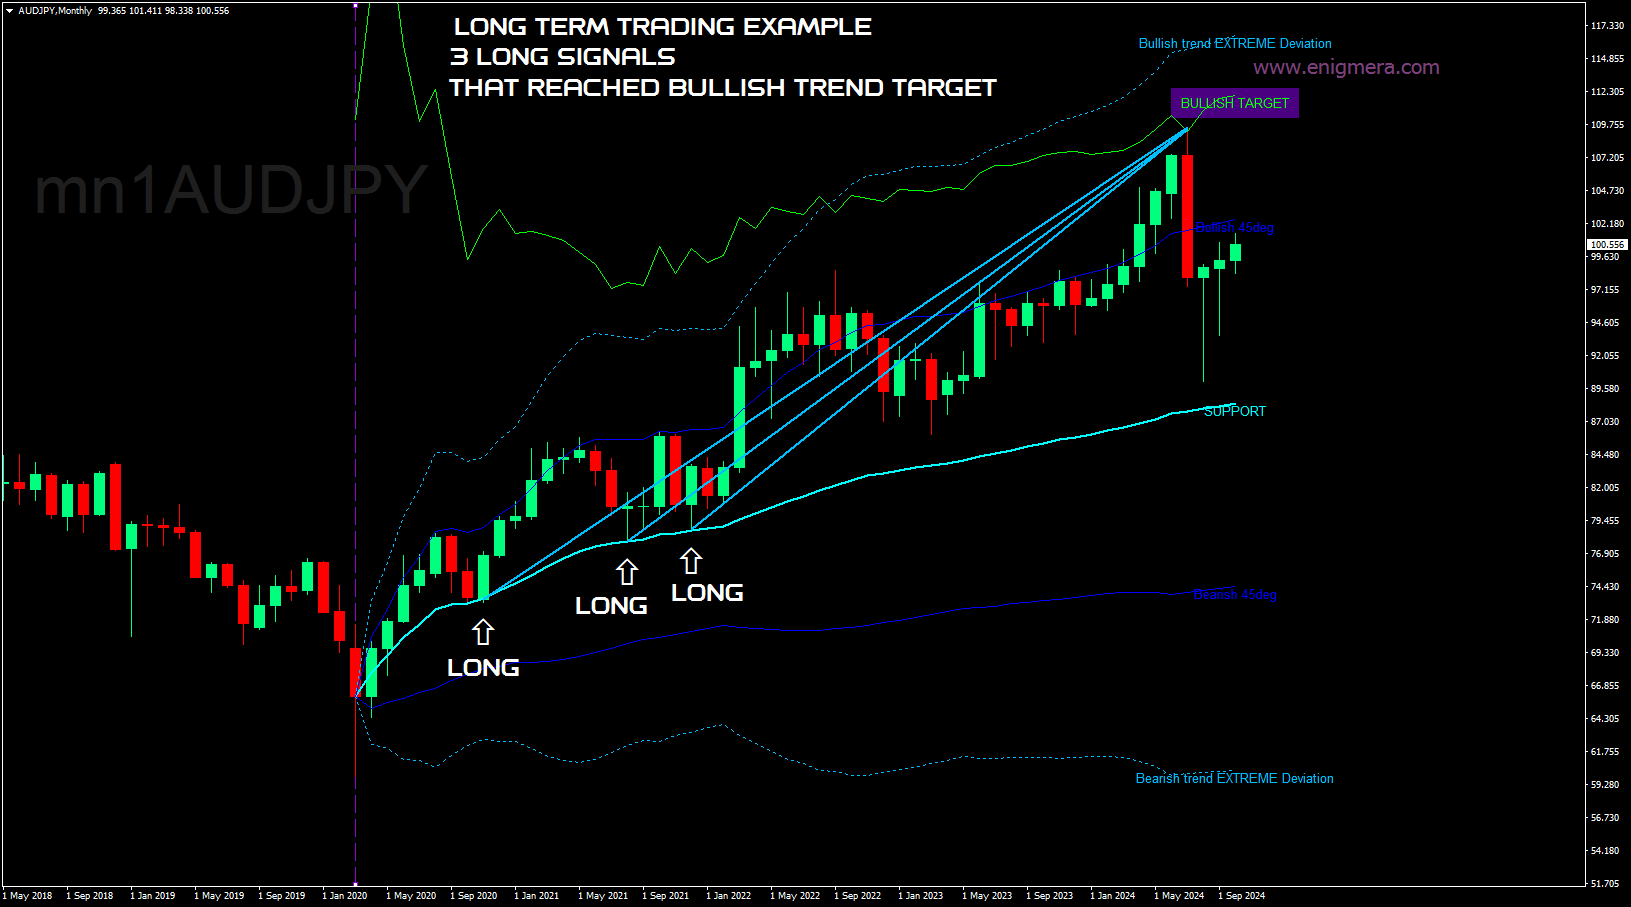
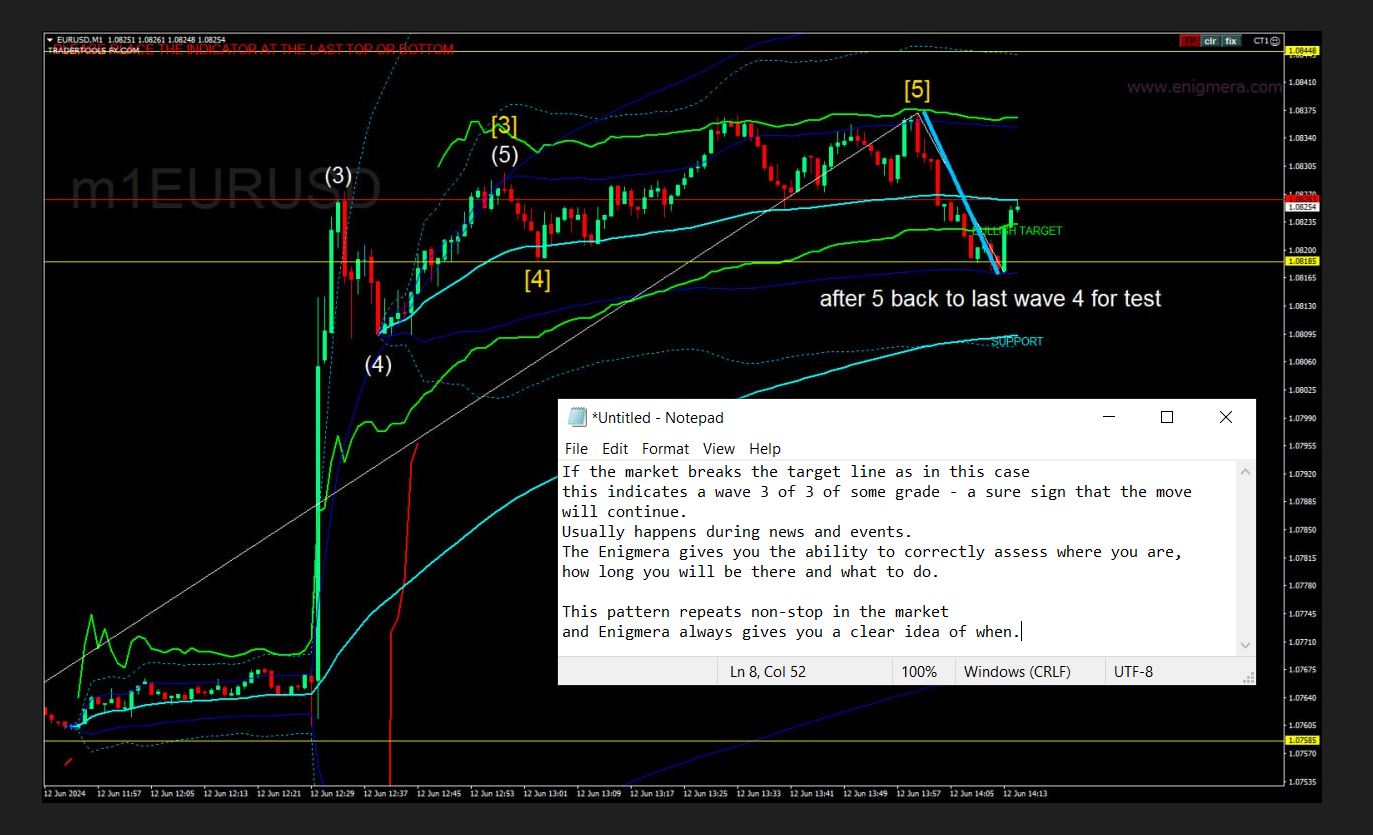
- 2xTgt - Double Target
- 3xTgt - Triple Target

This creates price movement channels that you can trade.


2. The indicator now allows defining deviations for the volume points. By default, the blue point represents two deviations of the average volume, and the purple one represents three. You can currently change them. For example, 1.5 or 1 will give you more points on the chart. You can even use values smaller than 1.

Application: By default, the considered volume deviations are 2 and 3, which represent a significant deviation in volume. If the market is not as volatile, the volume may be more uniform and not have such extreme values. However, the bullish or bearish volume is still larger, even though it might not have such large values. When you reduce the deviations, you will get points on the chart where the volume still shows deviations in one direction or the other, even if the deviations are not as large. This indicates which direction the market is inclined to move.


3. An option has also been added that allows you to reposition the buttons up or down, enabling the indicator to avoid overlapping with other indicators on the chart that may be located in the same place.
版本 3.0 2025.02.19
The indicator has been completely rewritten.

All functions are displayed as buttons on the chart, ensuring quick responsiveness during trading. The right tool at the right moment.
Second and third deviations have been added.
Volume analysis has been added.
A signal when the target line is reached.
Automatic color change of the indicator, resulting in new themes being applied automatically.
版本 2.60 2025.01.12
Version 2.60

In the new version, the indicator automatically assigns the next identifier number. This allows you to add as many indicators as you want to your charts without mixing the buffers of individual indicators, ensuring the indicator's position remains unaffected. Previously, this was done manually.
版本 2.50 2025.01.04
Good new functionality added.

1. First bullish and and first bearish deviation lines

The first deviation line in Enigmerа refers to measuring the deviation of the price from its average value, that is, how much the price has deviated from the support line.
High deviation indicates high volatility, while low deviation indicates stability.

Traders use this information to determine entry and exit points. For example, in high volatility, breakout strategies can be applied, while in low volatility – range trading strategies.
Sensitivity to Anomalies: Single sharp movements can distort the calculation of deviation.

2. Support channel of two additional optional support lines (a bearish and bullish)
版本 2.40 2024.12.26
Two new lines added to Enigmera in ver. 2.4
These are the first bullish and bearish deviations of the support line.

If the price primarily moves between the Enigmera line and its 45 deg lines, the market is in consolidation or sideways movement, which does not indicate a clear trend.

What is the difference between 45 deg line and Single deviation line?
45 deg lines defines the trend. If below non-sustainable, if over strong, if alongside the 45 deg line - sustainable.

Deviation line defines the acceptable distance whithin we consider lack of trend.
Outside the first devition is a trend sign, and it is simply because the market reached a new land.

The first standard deviation often acts as a boundary for normal price fluctuations around this average value.
版本 2.30 2024.10.07
- Bugs removed.
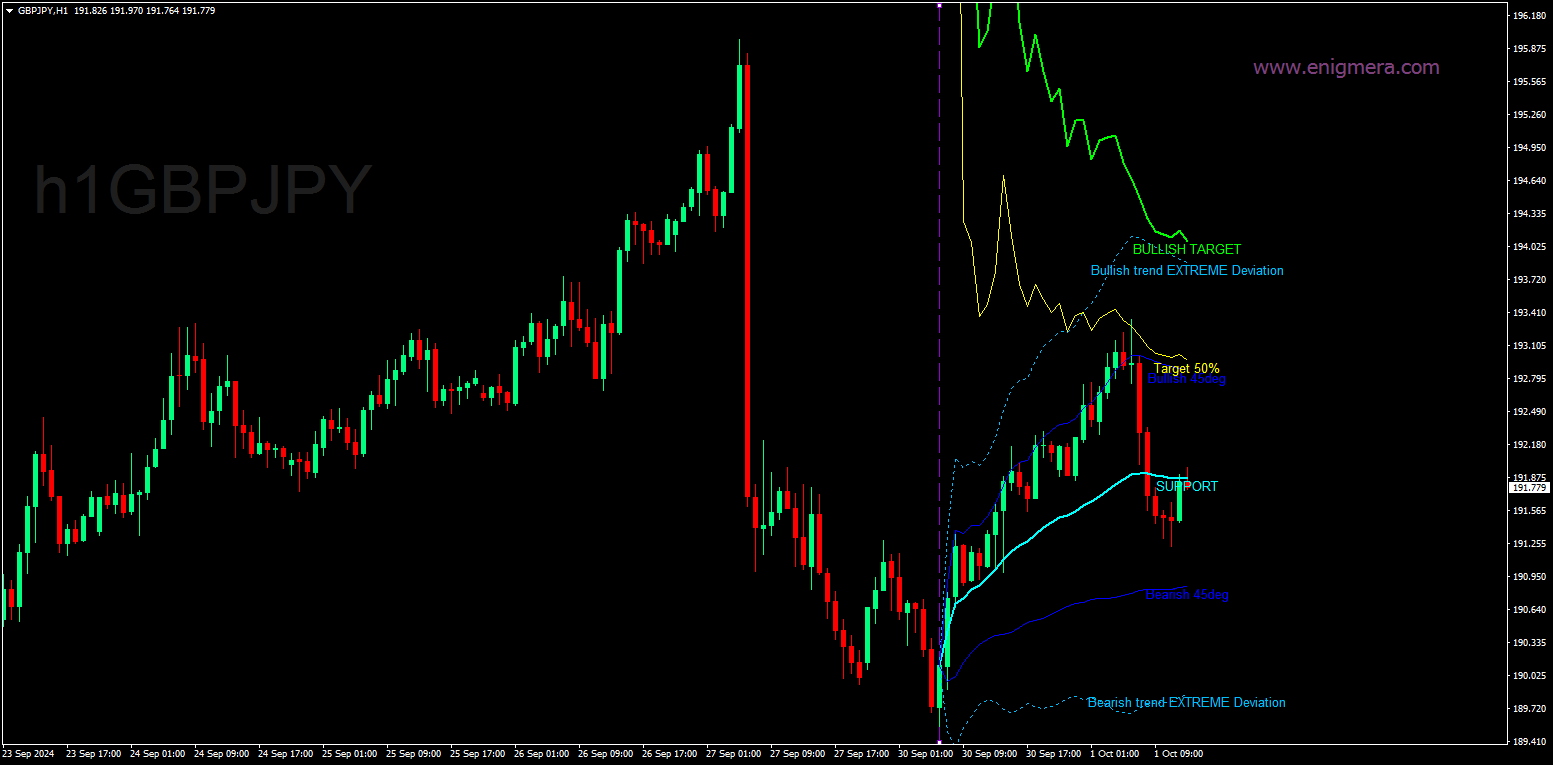
- 50% target line added. Be default is off.
- Non-Enigmera functionality removed.

Generally better performance.
版本 2.24 2024.08.06
More friendly labels.
版本 2.23 2024.06.18
The update is quite important. The convenience is undeniable:

- Just add the indicator to the chart. It is no longer necessary to enter the date and time.
- Putting a top or bottom is done by pulling and dragging the indicator.
- Reestimation of the trend is much more faster.

Enjoy!
版本 2.1 2024.06.09
- Warning when target is reached
- Line labels added. On/Off option
- Warning if indicator is not placed correctly
- Indicator identifier (when using more than one indicator on a graphic)
版本 2.0 2024.06.02
1. 新增艾略特通道。现在,您可以为艾略特通道使用任何时间框架。默认为 4 小时。这将使您的计算更加轻松。
2. 添加了自动斐波纳契时区。这也可以方便您计数。
3. 新增自动 50%线。对任何级别的运动都很重要。
4. 可选择限制指标计算的蜡烛图数量。默认值为 377。这个数字足以衡量大多数走势。您可以根据自己的想法进行更改。
5. 消除了从高时间段到低时间段时由于大量分形计算而导致的无响应现象。这不再是一个问题。
6. 通过优化代码提高性能。
7. 增加了颜色和线条选项。
8. 添加了标识符。如果要在图表上多次使用指标,最好为每个实例使用新的标识符。这样,指标将在每个实例中使用不同的缓冲区。
9. 对界面进行了一些修改。目标线变粗,使其更加重要,以吸引注意力。
版本 1.3 2024.01.05
在新版本中
增加了趋势评估工具:

- 角度 45 度线
- 45 度偏差线