KT Supply and Demand MT4
- 指标
- KEENBASE SOFTWARE SOLUTIONS
- 版本: 1.0
- 激活: 5
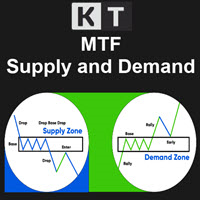
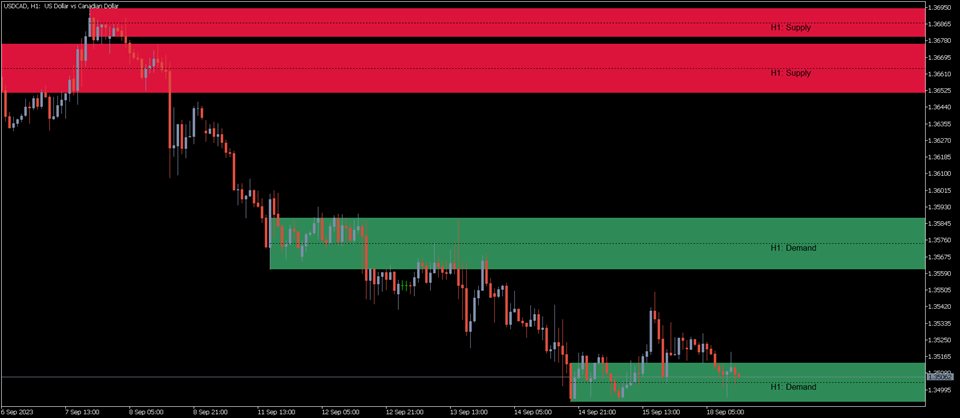
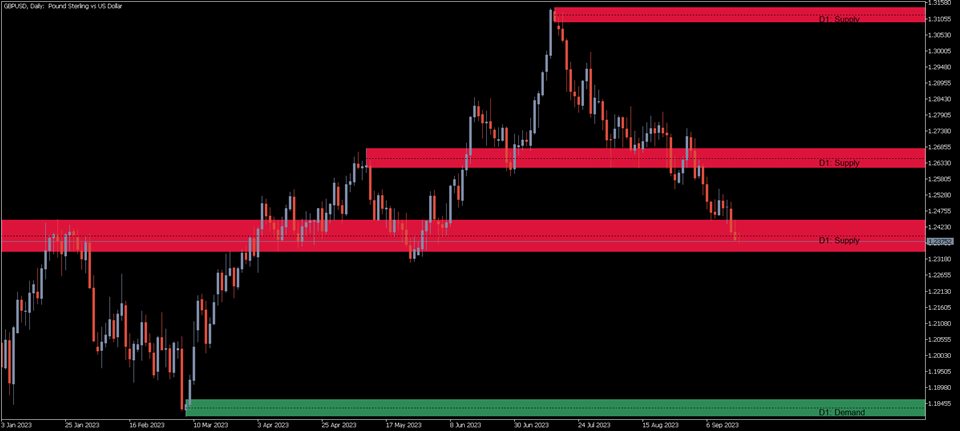
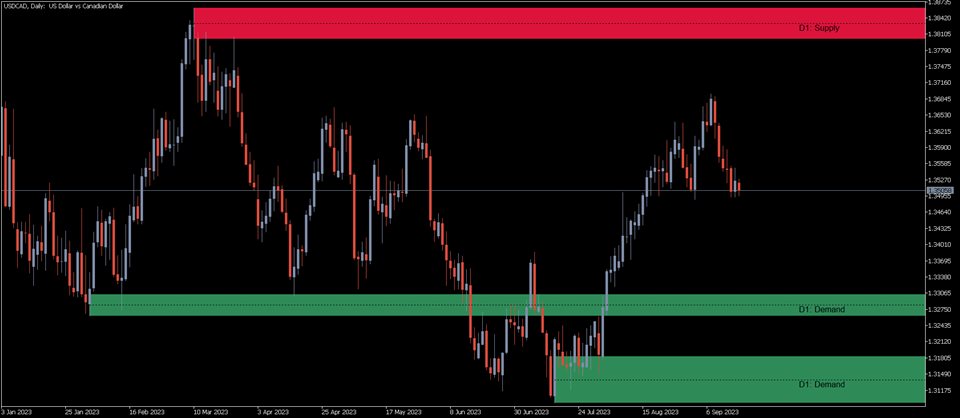
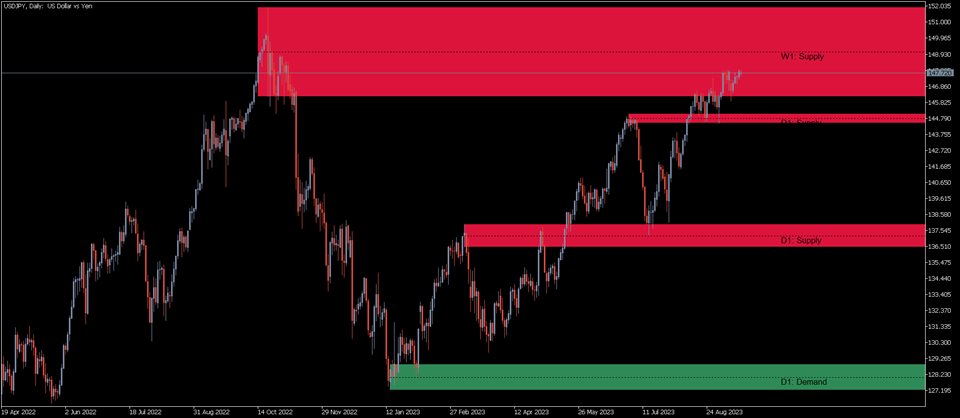
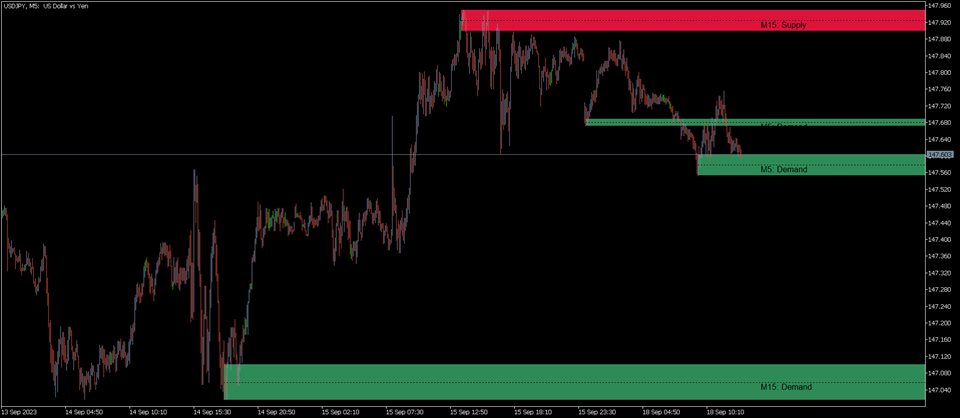
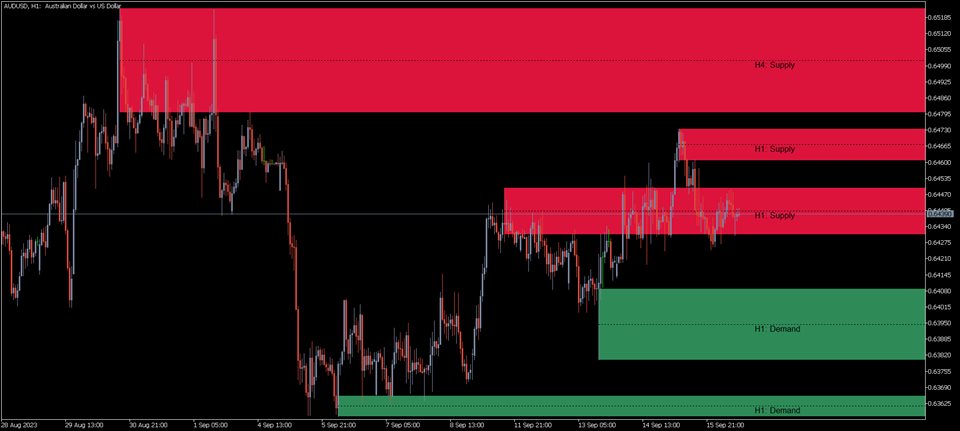
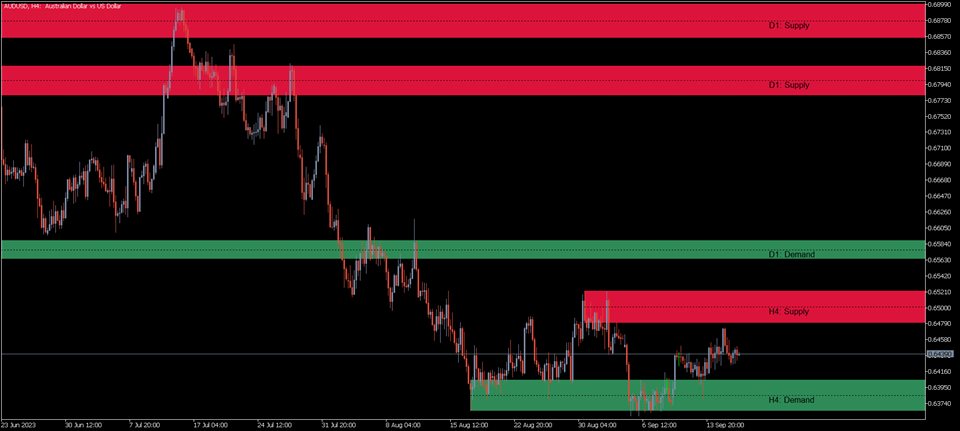
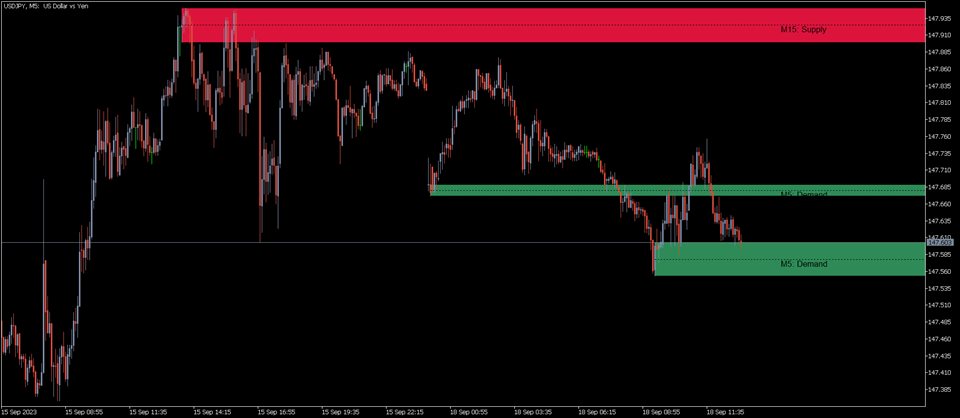
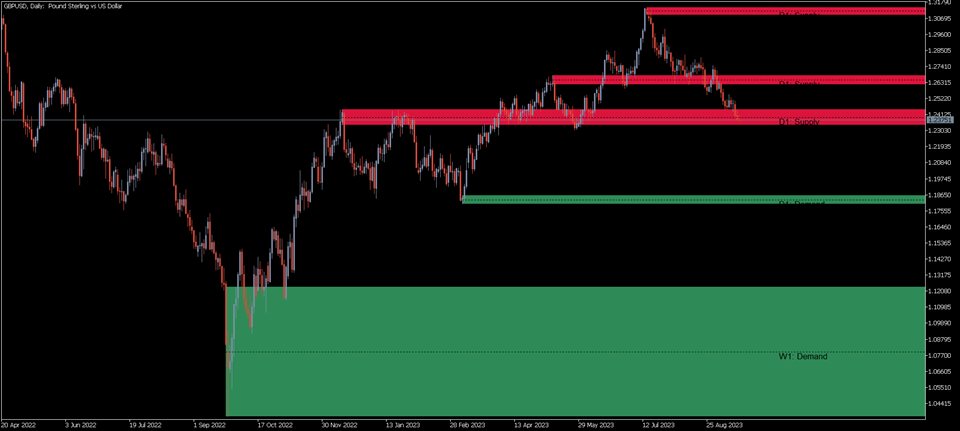
KT Supply and Demand indicator identifies and plots key supply and demand zones. It achieves this by analyzing swing points and integrating them with a multi-timeframe analysis, ensuring that only the most crucial supply-demand zones are highlighted.
This advanced method highlights the regions where prices are likely to reverse, stemming from significant supply-demand zones established by recent price movements.
Features
- Precision Analysis: Our refined algorithm is designed to accurately pinpoint the most crucial supply and demand zones, areas often indicative of major price shifts.
- Complete Market Insight: Showcases supply and demand zones from up to three timeframes, giving traders a thorough market view through multi-timeframe scrutiny.
- Uncluttered Visualization: Ensures your chart remains neat and interpretable by smartly avoiding any overlap of supply and demand zones, thereby reducing potential distractions.
- Integrated Chart Setup: It is complemented by a preset chart template that meshes perfectly with the indicator's features, enhancing your visual analysis.
- Predictive Power: Features a distinctive marking within each zone, acting as a hint for traders to foresee potential price reversals originating from these regions.
- Adaptive Coloring: Grants the ability to fluidly alter the colors of supply and demand zones, resonating with the ongoing price movements.
- Personalized Adjustments: Offers users a wealth of customization capabilities, from zone intensity to color choices and thickness, making sure it caters to every individual's style.
- Active Notifications: Comes with a range of alerting mechanisms, such as on-screen prompts, mobile messages, email alerts, and auditory signals, all of which activate as the price nears a supply or demand zone.
Applications
Mastering Trade Precision and Timing: Harness the power of this indicator to navigate pivotal areas on charts, pinpointing where prices may experience significant shifts. Moreover, with our indicator's timely alerts, traders can refine their trade entry and exit decisions, ensuring optimal execution and perfect timing.
Strengthening Technical Analysis: The clearly demarcated supply and demand zones not only serve as invaluable reference points but also bolster the identification of crucial support and resistance levels. This dual advantage aids in determining stop-loss placements, profit target settings, and predicting potential breakouts, especially when there's a pronounced imbalance between buyers and sellers.
Elevating Risk and Trade Management: Our indicator provides insights that are indispensable for risk strategy refinement. Recognizing zones teeming with buying or selling activity allows traders to fine-tune their risk parameters and cut through the market noise. This clarity ensures that traders can focus on opportunities aligning with prominent supply or demand areas.
Enriching Diverse Trading Strategies: Whether you're a trend-focused trader or a swing trader, our indicator complements your approach. Paired with trend analysis, it points out zones in harmony with the prevailing trend. For swing traders, understanding supply and demand dynamics enhances the predictability and profitability of short to mid-term price fluctuations.
Indicator's Inputs
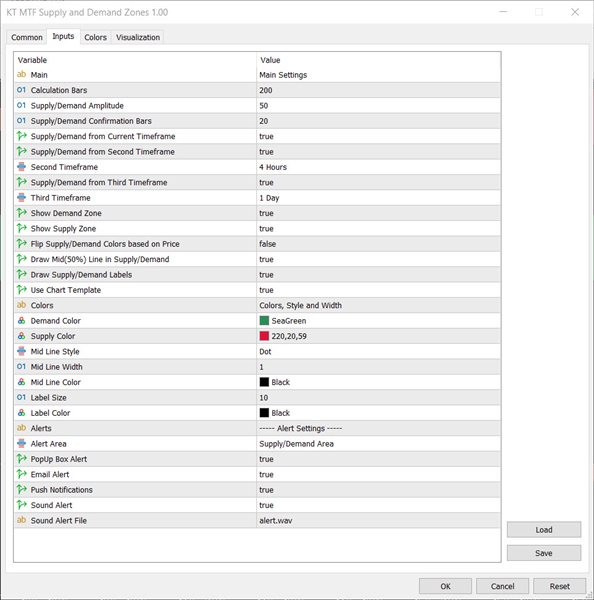
- Calculation Bars: Set the number of bars to spot supply and demand zones. Recent bars have a stronger effect on price actions.
- Supply/Demand Amplitude: Adjust this to pick up supply and demand zones. Bigger values give fewer but clearer zones; smaller ones give more zones.
- Supply/Demand Confirmation Bars: Choose how many bars you want for confirming a zone. More bars mean a stronger zone.
- Supply/Demand from Current Timeframe: Activate this to show the supply and demand zones from the current chart timeframe.
- Supply/Demand from Second or Third Timeframe: Use this to see zones from other timeframes you pick.
- Show Supply or Demand Zones: Decide if you want to see just supply or demand zones.
- Flip Supply/Demand Colors based on Price: When on, the colors of supply and demand zones will shift with price changes.
- Draw Mid(50%) Line in Zone: Turn this on to see a mid 50% line in each zone.
- Utilize Chart Template: Enable this function to apply a specially designed chart template that harmoniously aligns with this indicator.
