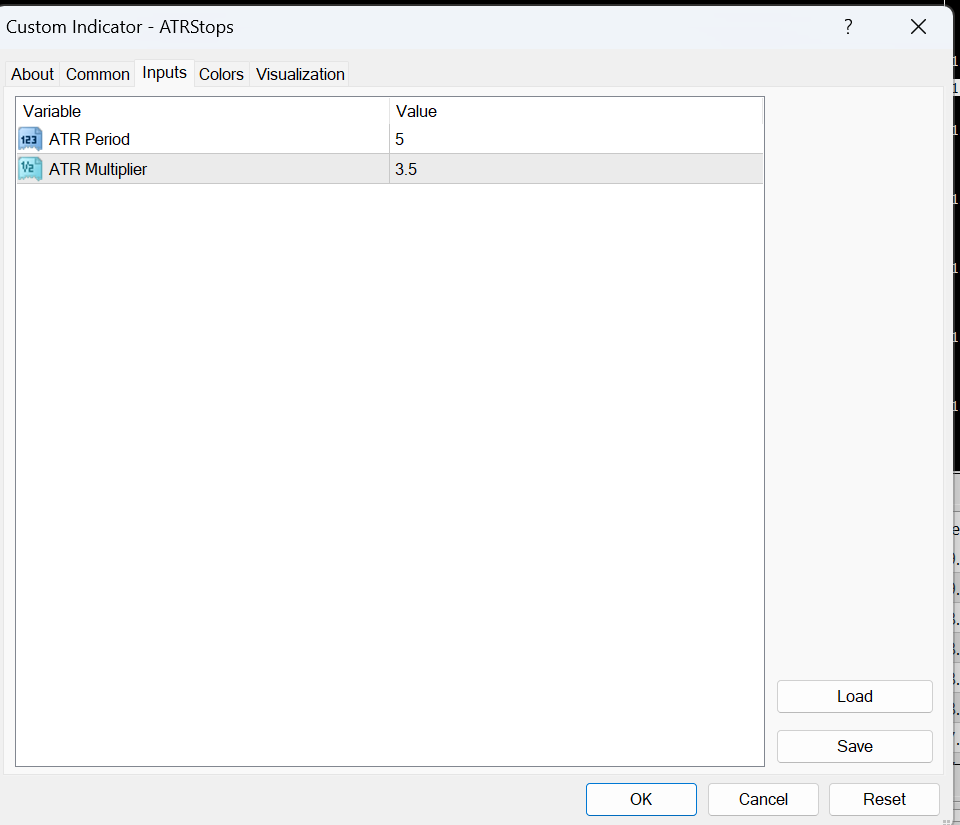
ATR Stops
- 指标
- Mohammad Taher Halimi Tabrizi
- 版本: 1.0
- 激活: 5
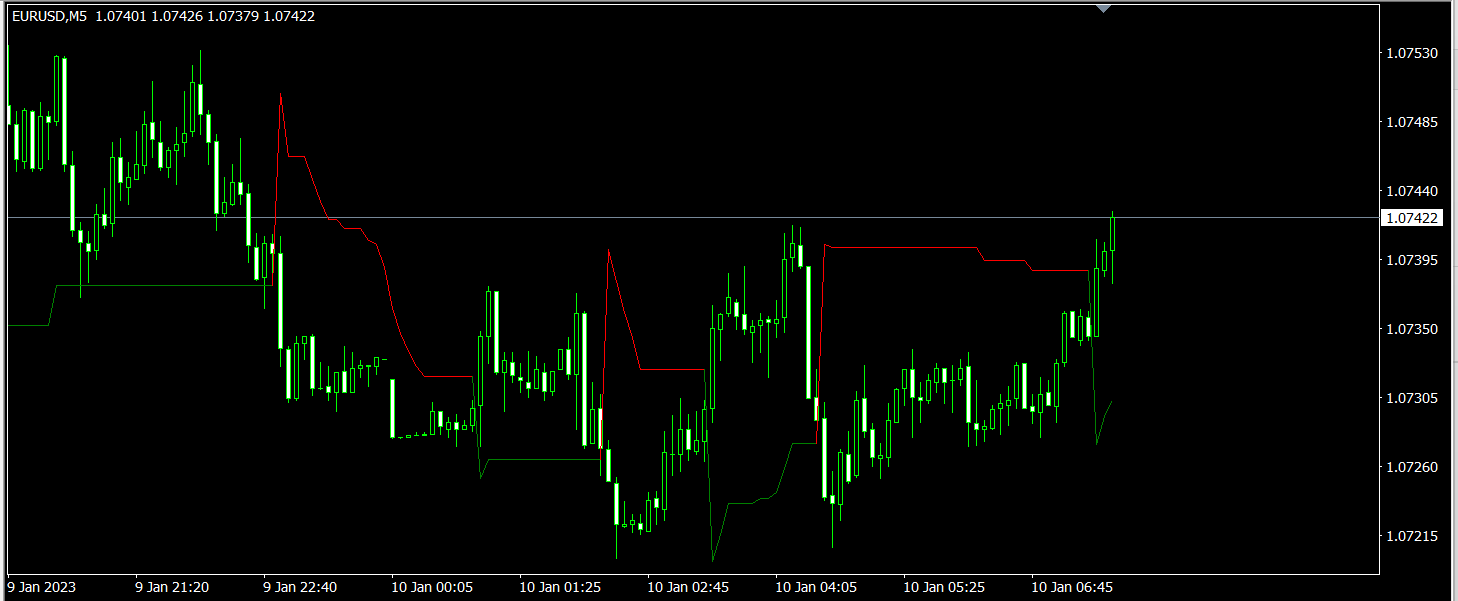
ATR Stops is an indicator which shows Dynamic support and resistance lines by considering ATR value and also a multiplier.
its highly effective to find out the trend direction and also is useful for using as stop loss levels.
it could be used in different ways one usual way is to buy when line becomes green and sell when it becomes red.
when its combined with money management rules and risk reward considerations there is good results.