KT Buy Sell Volume MT5
- 指标
- KEENBASE SOFTWARE SOLUTIONS
- 版本: 1.0
- 激活: 5
The KT Buy Sell Volume is a powerful tool traders use to gauge the strength and weakness of price movements. In the whirlwind of the Forex market, traders aim to identify and ride the waves of a bullish or bearish trend that exudes strength and potential.
However, recognizing these trends necessitates a method, metric, or indicator to quantify their strength. One crucial factor that traders examine for this purpose is volume. Volume refers to the number of shares or contracts traded in a security or market during a given period. It's the lifeblood of the market, potentially validating a new trend or signaling the end of an existing one.
It provides insights into the force behind breakout and trend-following moves, indicating whether these moves are bullish (buying pressure) or bearish (selling pressure).
Understanding the Buy/Sell Volume
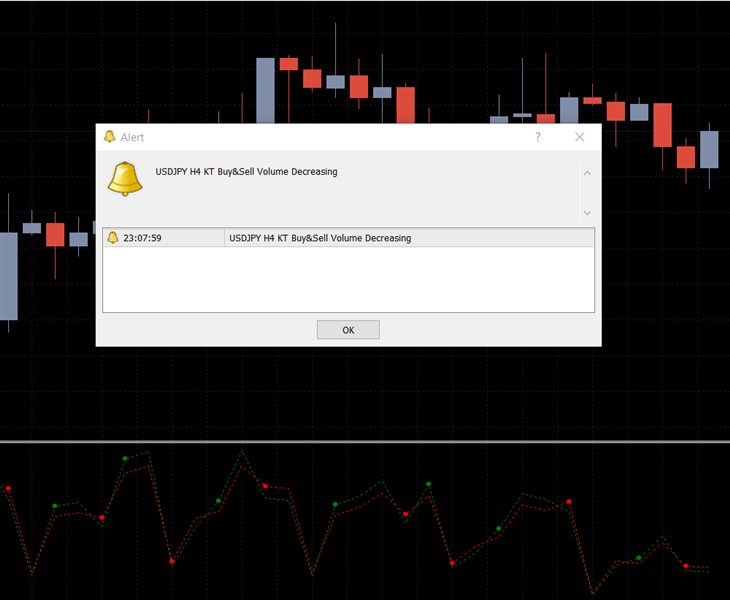
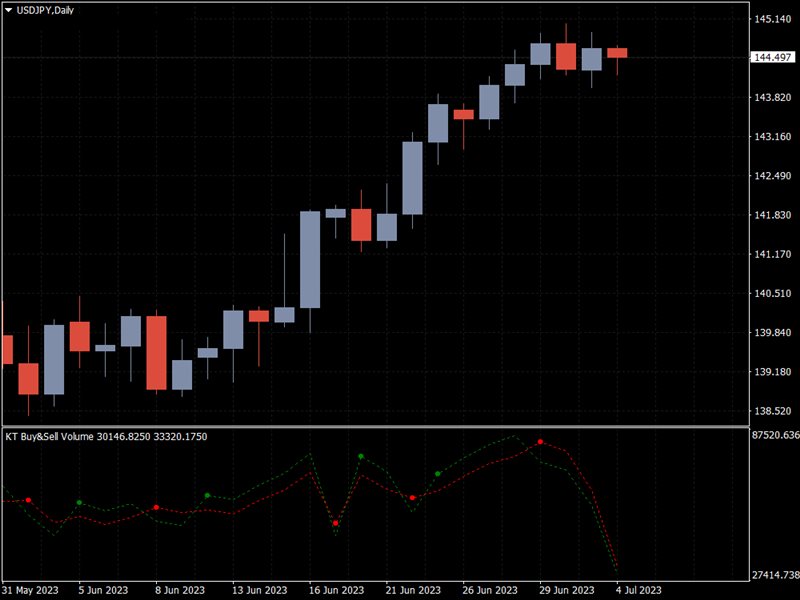
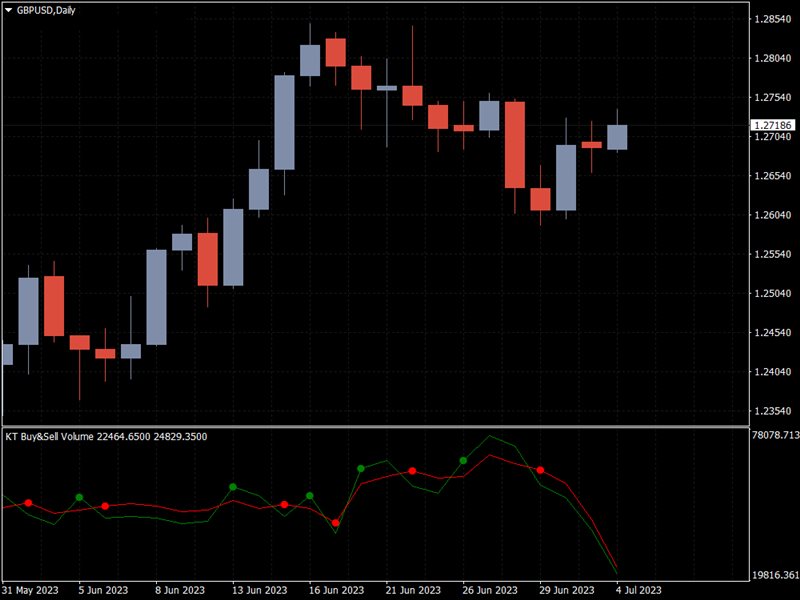
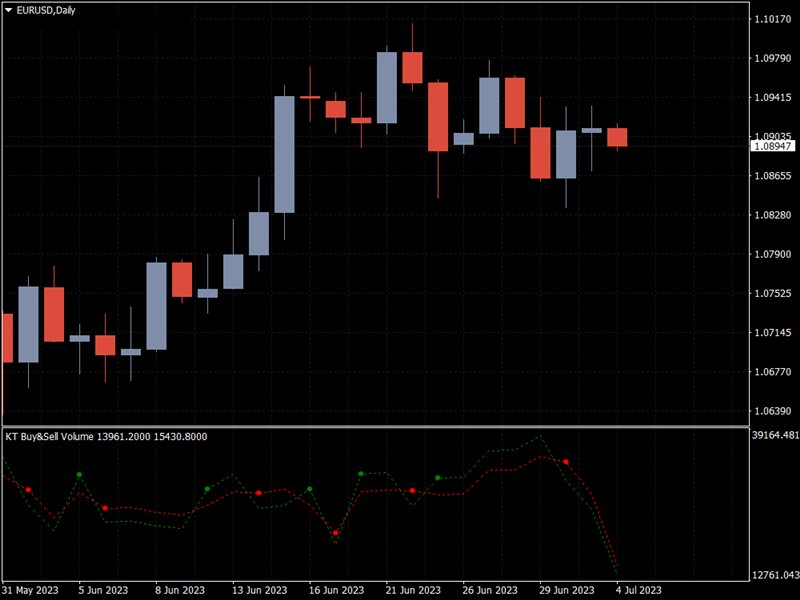
The indicator uses a dotted curve that undulates to show the fluctuations in market volume. The curve changes color, too, acting as a visual representation of bullish and bearish momentum. When the volume rises, the curve turns green, signaling a potential bullish move.
Conversely, when the trading volume decreases, the curve turns red, implying the market might be setting the stage for a bearish move.
Pro-Tips
- Conjunction With Price Trends: If the price is rising, but the market volume is decreasing, it might indicate that the upward trend is losing steam, and a price reversal could be imminent.
- Watch for Divergences: If the price is making higher highs, but the Buy Sell Volume oscillator is making lower highs, it could suggest that the upward trend is not backed by strong volume, and a price reversal might be near.
- Extreme Volume Spikes: A sudden spike in buying or selling volume could indicate strong market interest and a possible start of a new trend.
- Breakout Confirmation: If a price breakout or breakdown occurs on high volume, it usually suggests a real and strong move.
