• 概述
  • 评论
  • 评论

Envelope of Adaptive Moving Average

"Envelope of Adaptive Moving Average" 指标是一种帮助您在金融市场做出明智决策的工具。它旨在为您提供清晰的趋势方向以及交易中可能的入场和出场点。

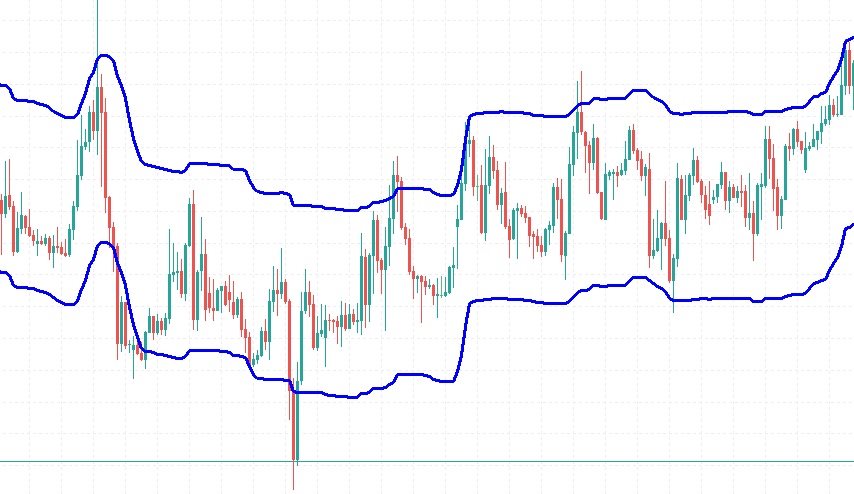
该指标基于自适应移动平均,这意味着它会自动调整以适应市场波动性的变化。这使其在既可能平静又可能波动的市场中特别有用。该指标显示两条包围自适应移动平均线的线条。这些线条有助于识别关键的支撑和阻力水平,从而使您更明智地决定何时买入或卖出资产。

尽管它是一种高级技术工具,但易于理解和使用,适用于新手和经验丰富的交易者。该指标能够适应不断变化的市场条件,使其在各种情况下都具备灵活性和有效性。它提供了市场趋势的清晰视觉表现,有助于避免冲动交易。该指标可以成为您交易工具箱中宝贵的工具。
推荐产品
Nyse Usdxy
Mitchell Dean Ede
5 (1)
Displays a USD DXY chart in a seperate window below the main chart. YOUR BROKER MUST HAVE THESE SYMBOLS FOR THE INDICATOR TO WORK Based on EUR/USD, USD/JPY, GBP/USD, USD/CAD, USD/CHF and USD/SEK All these pairs must be added to Market Watch for the indicator to work correctly As this is calculated using a formula based on the 6 pairs it will only work when the market is open. YOUR BROKER MUST HAVE THESE SYMBOLS FOR THE INDICATOR TO WORK Displays a USD DXY chart in a seperate window below the m
FREE
Strong Move
Triet Lam Minh
This indicator combines RSI(14) and ADX(14) to find out the signal that price moves strongly. When it appears signal (represent by the yellow dot), and price is going down, let consider to open a SELL order. Otherwise, let consider to open a BUY order. In this case, the strength of moving is strong (normally after sideway period), so  we can set TP by 3 times of SL  . 
FREE
IQuantum
Evgeniy Scherbina
The indicator IQuantum shows trading signals for 10 symbols in the daily chart: AUDCAD, AUDUSD, EURUSD, GBPCAD, GBPCHF, GBPUSD, NZDUSD, USDCAD, USDCHF, and USDJPY. Signals of the indicator are produced by 2 neural models which were trained independently from one another. The inputs for the neural models are normalised prices of the symbols, as well as prices of Gold, Silver and markers of the current day. Each neural model was trained in 2 ways. The Ultimate mode is an overfitted neural model
FREE
此工具提供了两个主要优势:它增强了MT5经济指标的使用便利性,并实现了与MT4的无缝数据共享。例如,您可以有效地利用超过十年前的经济指标数据进行训练和回测。此外,该工具兼容MT4的 PracticeSimulator ,使其成为一个从历史数据中的交易练习到MT4实时交易的宝贵工具。 为了在MT4中无缝共享经济指标 。 >> MT4版本 MT5经济指标的改进 历史数据访问 : 分析包括十多年前事件的经济指标数据,支持详细回测和历史回顾。 可定制的显示 : 经济指标在图表上以不显眼的方式显示,并可以调整与背景的融合度。 自动时间调整 : 自动调整时区和夏令时,确保历史事件的准确显示。 MT4的兼容性和优势 无缝数据共享 : 在MT4图表上直接使用MT5的经济指标数据,包括实时交易和训练场景。 与PracticeSimulator的集成 : 与 PracticeSimulator 兼容,可以在训练和策略测试中加入真实的经济事件。 多语言支持 : 经济指标可以以您的母语显示,使工具更加友好和易用。 此工具的独特功能是能够将MT5数据链接到MT4环境中。在MT5中运行该工具后,数据将被收集并同步
FREE
Range Box or Initial Balance
Cristian Mateo Duque Ocampo
5 (1)
The initial balance (IB) is a range in which the price spent its first two OPT periods after the opening. In other words, the opening balance is a range of the first hour after the market opened. The opening balance arose from room trading, as room traders observed the various ranges after the market opened. This indicator allows you to enter the starting and ending hours and minutes of a specific hourly time range so that the trader can set up different IBs according to the market. Automatic
FREE
Hello, This indicator is a unique high reliability 7-in-1 multicurrency indicator comprising these sub-indicator’s: A Trend Power Crossover Indicator. A Percent Change Crossover Indicator. A Currency Overbought/Oversold Indicator. A Currency Deviation Indicator. A Currency Impulse Signal Indicator. A Trend Power Indicator. A Currency Volatility Indicator. The main advantage of this indicator is that it's reasoning by currency and not by currency pair. The values of each sub-indicator are calcula
FREE
Aurea Stella EA – Illuminate Your Trading Path Like the guiding stars that lead sailors through uncharted waters, Aurea Stella EA empowers you to navigate the unpredictable seas of the financial markets. Craft Your Own Constellation of Strategies: Endless Combinations – Weave together Bollinger Bands, Stochastic, RSI, MACD, Envelopes, and Donchian Channels to create your unique trading patterns. Precision Control – Adjust stop loss, take profit, trailing stops, and choose whether to reverse
FREE
VolumesWithMedia
Jonathan Pereira
5 (1)
Volume is a widely used indicator in technical analysis, however there is a variation that is even more useful than Volume alone: the Moving Average of Volume. It is nothing more than a moving average applied to the popular Volume indicator. As the name says, Volume + MA serves to display the transacted volume (purchases and sales executed) of a certain financial asset at a given point of time together with the moving average of that same volume over time. What is it for? With the Volume + M
FREE
Free version of  https://www.mql5.com/en/market/product/44815 Simple indicator to calculate profit on fibonacci retracement levels with fixed lot size, or calculate lot size on fibonacci levels with fixed profit. Add to chart and move trend line to set the fibonacci retracement levels. Works similar as default fibonacci retracement line study in Metatrader. Inputs Fixed - select what value will be fix, lot or profit  (available in full version, lot is set on free version) Fixed value - value tha
FREE
Dark Bands MT5
Marco Solito
4.89 (196)
Dark Bands   is an Indicator for intraday trading. This Indicator is based on Counter Trend  strategy but use also Volatility. We can enter in good price with this Indicator, in order to follow the inversions on the current instrument. Key benefits Easily visible take profit/stop loss lines Reliable bands lines with futuristic colors, and  Intuitive directional arrows Useful statistics , which indicate the win rate of the signals Plus Package  available, leave a feedback to receive it for fr
FREE
TilsonT3
Jonathan Pereira
Tillson's T3 moving average was introduced to the world of technical analysis in the article ''A Better Moving Average'', published in the American magazine Technical Analysis of Stock Commodities. Developed by Tim Tillson, analysts and traders of futures markets soon became fascinated with this technique that smoothes the price series while decreasing the lag (lag) typical of trend-following systems.
FREE
Wa Candle Timer Percentage MT5
Wachinou Lionnel Pyrrhus Sovi Guidi
Wa Candle Timer Percentage MT5 is an indicator which shows the user how much time is remaining until the next candle will form. The percentage of the evolution of the current candle is also displayed. The user can set the percentage that the candle timer will change the color. These are the settings: 1- The percentage that the candle timer will change the color. 2- Color of Candle Timer when it's BELOW the percentage set by the user. 3- Color of Candle Timer when it's ABOVE the percentage set b
FREE
Breakout Session Box
Claus Dietrich
4 (2)
BREAKOUT-SESSION-BOX LONDON EU US ASIA Open watch the expectation of a volatile movement above or under the opening range We take the high of the range as Entry for a long trade and SL will be the low of the range and vice versa the low of the range as Entry for a short trade and the high for SL The size of the range is the distance to the TP (Take Profit) The range of the opening hours should not be larger than about 1/3 of the average daily range 4 breakout examples are already predefined: A
FREE
Highest High and Lowest Low (HH_LL) Indicator Description: The HH_LL Indicator is a trading tool designed to help traders identify key market points by automatically drawing Higher High (HH) and Lower Low (LL) lines across multiple timeframes. This indicator allows traders to easily spot significant levels on the chart, facilitating more accurate trading decisions. Key Features: Multi-Timeframe Analysis: The indicator supports various timeframes, including M30, H1, and H4. This enables traders t
FREE
Reversal Composite Candles
MetaQuotes Ltd.
3.57 (14)
该系统的思路是通过计算复合蜡烛来识别反转形态。 反转形态类似日本蜡烛条分析的 "锤头" 和 "吊颈" 形态。但它使用符合蜡烛替代单一的蜡烛,并且不需要复合蜡烛的小实体来确认反转。 输入参数: Range - 最大柱线数量, 计算复合蜡烛时用。 Minimum - 最小复合蜡烛大小 (传统的点数)。 ShadowBig and ShadowSmall - 影线 (复合蜡烛单元)。 Limit, StopLoss and TakeProfit - 开盘价, 止损位和止盈位, 它们是相对于复合蜡烛的收盘价 (复合蜡烛单元)。 Expiration - 订单过期时间 (单位柱线), 用于挂单 (Limit!=0.0)。 反向蜡烛条形态的判别如下。 它计算复合蜡烛参数,其自最后的完整柱线 (索引为 1) 至由 Range 输入参数定义的柱线数量。如果复合蜡烛大小大于由 Minimum 输入参数指定的数值, 它分析复合蜡烛的影线检测反转条件。 空头能量的特征是复合蜡烛的上影线为零, 多头能量的特征是复合蜡烛的下影线为零。 为确认空头趋势反转 (且多头开始),需要以下检查: 下影线的大小 (多头能量
FREE
This indicator uses a different approach from the previous version to get it's trendlines. This method is derived from Orchard Forex, and the process of making the indicator is demonstrated in there video   https://www.youtube.com/watch?v=mEaiurw56wY&t=1425s . The basic idea behind this indicator is it draws a   tangent line   on the highest levels and lowest levels of the bars used for calculation, while ensuring that the lines don't intersect with the bars in review (alittle confusing? I know
FREE
Simply Fair Value Gaps
Donaldo Sande Angiela
Introducing the Fair Value Gap Indicator : A Simple and Effective Trading Tool The Fair Value Gap Indicator is designed to help traders easily identify and utilize Fair Value Gaps (FVGs) in their trading strategies. FVGs highlight price imbalances that the market often revisits, offering potential trade entry or exit opportunities. Whether you're a beginner or an experienced trader, this indicator simplifies the process of spotting these valuable zones, allowing you to trade with clarity and co
FREE
Nexus Breakout line
Mohammed Kaddour
INTRODUCTION : The breakout strength meter is a trading tool that is used to identify which currencies are the strongest to breakout, and which currencies are the weakest to breakout. The settings for the indicator are easy, and if you cannot find the settings, please leave a comment The tools are completely free to use Please, if you like the indicator, please leave a comment and rate the indicator in order to develop it
FREE
FCandles Smoothed
Francisco Jesus Alonso Martin
FCandle Smoothed Tired of market noise and false signals ruining your trades? FCandle Smoothed is the solution you've been looking for. Our innovative MQL5 strategy is designed to smooth trading candles and give you a clear, precise market view. Identify the best entry and exit points with filtered and reliable signals. Reduce market noise and avoid false breakouts with our optimized algorithm. Suitable for any trader, whether you're a beginner or advanced, this strategy adapts to any trading st
FREE
New Day and New Week Opening Gap ICT NWOG NDOG MT5 The New Day and New Week Opening Gap ICT NWOG NDOG MT5 indicator is a powerful and practical tool designed for traders using MetaTrader 5. It helps detect price gaps that emerge at the start of a new trading day or week, making them visible on the chart. When the market closes at the end of a session, the reopening price may differ from the previous close, leading to a price gap. This indicator marks weekly price gaps ( NWOG ) in red and daily p
FREE
This utility is the demo version of the Binance Full Trader. This version is provided so the customers can test performance and options of the main version. ·        This version has these restrictions: 1.        Only BTCUSDT is available for price chart and Test Mode. 2.         The Real Mode is not accessible. 3.        The LIMIT and STOPLOSSLIMIT are not accessible. 4.       The Indicator mode is not accessible.   ·        The full version and the instruction of use can be downloadable from t
FREE
Breakout MV
Emmanouil Bampalos
Breakout MV :  This Expert Advisor offers you one of the most fundamental trading strategy,  combining Moving Average and Volums indicators!  Key Features : Consistent Performance : Breakout strategy has demonstrated a robust performance across various market conditions, by capitalizing on significant price movements. Strategic Trade Execution : We select the desired range, and once the price approaches these levels and the indicators confirm our entry, we open a trade. The trade will close eit
FREE
Middle of daily range
Raphael Gil Abreu De Oliveira
A simple and efficient indicator that plots and updates the 50% of the current day, for those who use this point as a reference in day trading. On trend days the 50% region tends to be a good resistance point, ideal for making new entries. On non-trend days (sideways) the 50% region is great for carrying out positions. In addition, for study or back-testing criteria, you can define the amount of previous days to be plotted by the indicator. For questions or suggestions, please contact us. A
FREE
Ichimoku Trend Alert is the Ichimoku Kinko Hyo indicator with Alerts and signal filters. Ichimoku Trend Alert features: Optional check of Ichimoku cloud, Tenkan sen(Conversion Line), Kijun sen(Base Line), Senkou span A, Senkou span B, and Chikou span relative to price, and more. Popup, email, and phone notification alerts for selected symbols and timeframes. There are 9 classic Ichimoku trend filters you can enable/disable in settings: Price/Cloud Order:   Checks the price position relative to
FREE
RSI Condition: The Relative Strength Index (RSI) for the current period is below a specified low threshold (RsiLow). This indicates oversold conditions. Candlestick Pattern: It checks for a specific candlestick pattern across three consecutive candles: The current candle (1) closes higher than it opens (bullish) The previous candle (2) closes lower than it opens (bearish) The current candle's close is below the high of the previous candle Price Action: The alert also checks that the current
FREE
RSI vs SMA Indicator
Asanka Priyasad Peiris Dadigamuwage
Special Offer ... It is totally free for all. New one coming soon................... About This Indicator: RSI vs SMA Indicator: A Comprehensive Technical Analysis Tool for Better for Identify the Short and Long Signals. The RSI vs SMA Indicator is a powerful technical analysis tool designed to understanding Market Price Fluctuation for Long or Short signals. This user-friendly Indicator good for both novice and experienced traders, providing valuable indication in price chart and separate wind
FREE
Renko Box
Andrey Dik
5 (1)
描述。 Renko图表形成的基础是价格范围。 如果价格超出其限制,图表显示一个框高于或低于前一个。 因此,我们看到价格走势没有额外的"噪音"和重要的支撑和阻力水平。 特征。 为了与专家顾问一起使用,实现了一个额外的缓冲区-一个盒子计数器. 为了方便和提高测试速度,用户可以使用"新框"事件,指示器在出现新框时生成该事件。 您可以设置"反转"框的大小。 无论测试开始点如何,指标始终构建相同。 没有"重绘"。 一旦到了那里,拳击就不会再改变了。 无论从哪里启动,它都将被绘制相同。 输入参数: RenkoBoxSize    = 20;  //Box size ReversBcnt      = 2;   //Box's for reverse RenkoBoxDrawCNT = 100; //Box's for draw Price           = bid; //bid, ask, (ask+bid)/2 RenkoBoxEventId = 123; //Box's event
FREE
这个EA叫 Dinosaur Hunter是因为,它能抓住非常大的行情,比如 5000-10000 点。 DH交易并不频繁,因为它要耐心的等待行情出现。 DH可以将多个货币对加载在一个Chart上,以增加交易次数。 信号 这是一个Demo版本,只支持 Fix Lot 0.01。要获得完整版本,请购买 Dinosaur Hunter Pro 。 这个EA已经通过2015至今的测试。测试采用数据来自Dukascopy。 如果你在ICMarkets上交易,可以直接使用我的配置参数。 如果你采用其它交易商,请先进行测试。 交易设置 关键设置时 MultiPairs,设置为true,根据PARAMETERS设置进行交易。 设置为false,根据Single Pair Settings 进行交易。 Single Pair Settings  Basic Period MA Period Pre Bars MA Fast Count MA Slow Count CCI Period Fast Trend Level Slow Trend Level CCI Level Open Hour
FREE
Show Pips for MT5
Roman Podpora
4.67 (21)
对于那些总是想了解帐户当前情况的人来说,此信息指示器将很有用。 -   更多有用的指标 该指标显示诸如利润点数、百分比和货币等数据,以及当前货币对的点差以及柱在当前时间范围内收盘的时间。 有多种选项可用于将信息线放置在图表上: 价格右侧(运行在价格后面); 作为评论(在图表的左上角); 在屏幕的选定角落。 还可以选择信息分隔符: | / \ # 该指标易于使用且信息丰富。可以在设置中禁用不必要的信息项目。 设置 外观类型     - 信息行的显示类型。有以下三种选择: 跟随价格     - 遵循价格; 作为评论     - 作为评论; 在屏幕的选定角落     - 在屏幕的选定角落。 附件图角     - 如果您选择屏幕选定角的显示类型,则此项目允许您选择四个捕捉角之一; 显示利润?       - 该参数负责以存款货币显示利润; 以百分比显示利润?       - 该参数负责以百分比形式显示利润; 显示传播?       - 该参数负责显示当前点差; 显示酒吧关闭时间?       - 该参数负责显示柱关闭之前的时间; 文字颜色     - 文字颜色; 盈利颜色     - 存在
FREE
Matrix Arrow Indicator Multi Timeframe Panel MT5 是一个免费的附加组件,是您的 Matrix Arrow Indicator MT5 的重要资产。它显示了当前 Matrix Arrow Indicator MT5 信号,用于 5 个用户自定义的时间范围和总共 16 个可修改的符号/工具。用户可以选择启用/禁用 Matrix Arrow Indicator MT5 包含的 10 个标准指标中的任何一个。所有 10 个标准指标属性也是可调整的,如 Matrix Arrow Indicator MT5 。 Matrix Arrow Indicator Multi Timeframe Panel MT5 还提供了更改它所附加的当前图表的选项,方法是单击 16 个可修改符号按钮中的任何一个。这将使您能够更快地在不同符号之间工作,并且不会再次错过交易机会。 如果您想使用这个免费的 Matrix Arrow Indicator Multi Timeframe Panel MT5 插件,您需要在此处单独购买 Matrix Arrow Indicato
FREE
该产品的买家也购买
Trend Screener Pro MT5
STE S.S.COMPANY
4.84 (76)
使用趋势筛选指标释放趋势交易的力量:由模糊逻辑和多货币系统提供支持的终极趋势交易解决方案! 使用趋势筛选器(由模糊逻辑提供支持的革命性趋势指标)提升您的趋势交易。 它是一个强大的趋势跟踪指标,结合了超过 13 种高级工具和功能以及 3 种交易策略,使其成为使您的 Metatrader 成为趋势分析器的多功能选择。 限时优惠:趋势筛选指标终身仅需 50 美元。 ( 原价 250$ ) (优惠延长) 体验趋势筛选器 100% 无需重新绘制的准确性,确保您的交易决策不受过去价格变化的影响。 释放多时间框架和多货币功能的多功能性,使您能够以无与伦比的信心在外汇、商品、加密货币和指数领域进行交易。 利用 Trend Screener 的综合策略套件增强您的交易: - 趋势跟踪策略和趋势延续策略 :趋势筛选器的趋势跟踪策略提供清晰的趋势延续信号,让您有效捕捉趋势走势并管理风险。 - 反转策略和早期入场点策略 :趋势筛选器的反转策略可检测市场方向的潜在变化,使您能够预测趋势反转并利用疲弱的市场趋势。通过早期入场点,您可以在潜在的趋势变化之前定位自己 获取可观的利润。 - 倒卖策略: 趋势筛选器的倒卖
Golden Trend Indicator MT5
Noha Mohamed Fathy Younes Badr
4.88 (16)
Golden Trend indicator  is The best indicator for predicting trend movement this indicator never lags and never repaints and never back paints    and give  arrow buy and sell    before the candle appear  and it will help you and  will make your trading decisions clearer its work on all currencies and  gold and crypto and all time frame This unique  indicator uses very secret algorithms to catch the  trends, so you can trade using this indicator and see the trend clear on charts  manual guide and
FX Power MT5 NG
Daniel Stein
5 (11)
FX Power:分析货币强度,助您做出更明智的交易决策 概述 FX Power 是一款专业工具,帮助您全面了解主要货币和黄金在任何市场条件下的真实强度。通过识别强势货币用于买入,弱势货币用于卖出, FX Power 简化了交易决策,并帮助您发现高概率的交易机会。不论您是想跟随趋势还是通过极端的 Delta 值预测反转,这款工具都能完美适应您的交易风格。别再盲目交易——用 FX Power 让您的交易更加智慧。 1. 为什么 FX Power 对交易者极具价值 实时货币和黄金强度分析 • FX Power 实时计算并显示主要货币和黄金的相对强度,助您全面了解市场动态。 • 监控领先或落后资产,轻松识别值得交易的货币对。 全面的多时间框架视图 • 跟踪短期、中期和长期时间框架的货币和黄金强度,以便将您的交易策略与市场趋势保持一致。 • 无论是快进快出的短线交易还是更长期的投资策略, FX Power 都能为您提供所需的信息。 Delta 动态分析用于趋势和反转 • 极端 Delta 值常常预示反转机会,而平缓的 Delta 变化则确认趋势延续。 • 使用 Delta 分析,轻
FX Volume MT5
Daniel Stein
4.82 (17)
FX Volume:从经纪商视角洞察真实市场情绪 简要概述 想要提升您的交易策略? FX Volume 可提供零售交易者和经纪商的持仓实时数据——远早于诸如 COT 之类的延迟报告。不论您希望获得持续稳定的收益,还是想在市场中多一分制胜的砝码, FX Volume 都能帮您识别重大失衡、确认突破以及完善风险管理。立即开启体验,让真实的成交量数据为您的交易决策带来革新! 1. 为什么 FX Volume 对交易者格外有用 极具准确度的早期预警 • 快速捕捉有多少交易者正在买入或卖出某个货币对——比大多数人提前一步。 • FX Volume 是 唯一 能够整合多家零售经纪商真实成交量数据并以简洁方式呈现的工具。 强力风险管理 • 及时识别多头或空头仓位的巨大不平衡,这往往预示着潜在的趋势反转,帮助您更自信地设置止损和目标位。 • 独家而真实的数据让每一次交易决策更具可靠性。 优化进场与出场点 • 发现“过度集中”的交易(大多数交易者都在同一方向),并通过真实成交量来确认突破。 • 避免依赖常见指标可能带来的误导信号,而是利用真实的实时成交量。 适配各种交易策略 • 将 FX
FX Levels MT5
Daniel Stein
5 (3)
FX Levels:适用于所有市场的高精度支撑与阻力 快速概览 想要精准确定适用于任何市场(外汇、指数、股票或大宗商品)的支撑与阻力吗? FX Levels 将传统的“Lighthouse”方法与前沿的动态分析相结合,实现近乎通用的准确性。依托真实经纪商经验和自动化的每日与实时更新, FX Levels 帮助您捕捉价格反转点、设置合理的盈利目标,并自信地管理交易。立即使用,体验更准确的支撑/阻力分析如何助力您的交易更上层楼! 1. 为什么 FX Levels 对交易者非常有利 极度精准的支撑 & 阻力区 • FX Levels 专为不同经纪商提供的行情源和时间设置而设计,可生成几乎相同的价位区,解决数据不一致的常见问题。 • 这意味着无论您在哪里交易,都能获得稳定一致的水平线,为策略打下更加牢固的基础。 结合传统与先进技术 • 通过将久经考验的“Lighthouse”方法与动态分析相融合, FX Levels 不仅限于每日刷新,还可针对新的价格波动进行即时更新。 • 您可以选择经典的静态方式,或实时捕捉新出现的水平,以贴近最新的市场行为。 识别清晰的反转点 • FX Lev
TPSproTREND PrO MT5
Roman Podpora
4.71 (17)
Algo Pumping
Igor Otkidach
PUMPING STATION – 您在外汇市场上的盈利泵站! 我们为您带来 PUMPING STATION ——一款革命性的外汇指标,它将把您的交易转变为持续盈利的机器!这不仅仅是一个辅助工具,而是一个功能强大的完整交易系统,帮助您实现稳定收益。 购买此产品后,您还将免费获得以下内容: 专属设置文件,帮助您自动配置并实现最大收益。 4小时的视频培训,教您如何使用 PUMPING STATION 策略进行交易。 Pumping Utility - 一个专门的半自动交易机器人,使您的 PUMPING STATION 交易策略更加盈利、便捷和简单。 购买 PUMPING STATION 后,请立即给我发送私人消息,我会将所有相关资源的访问权限发送给您。 PUMPING STATION 如何工作? 趋势控制: 实时分析市场走势,趋势永远是您的好朋友! 交易信号: 图表上的箭头清晰指示交易的时机和方向。 明确的交易目标: 指标自动确定最佳的交易平仓时间,让您在每一笔交易中都能获得最大利润。 回调交易: 内置基于布林带(Bollinger)的价格通道,精准捕捉修正结束的时刻,并发出新趋势开始的信
TPSpro RFI Levels MT5
Roman Podpora
4.53 (19)
指示       俄罗斯 -        英语   建议 与指示器一起使用     -       TPSpro 趋势专业版 -   MT4版本       交易中的一个关键要素是做出买卖交易工具决定的区域或水平。尽管主要参与者试图隐藏他们在市场中的存在,但他们不可避免地会留下痕迹。我们的任务是学习如何识别这些痕迹并正确解释它们。 主要功能: 向卖家和买家显示活跃区域! 该指标显示所有正确的初始买入和卖出脉冲水平/区域。激活这些水平/区域后,开始寻找切入点,水平会改变颜色并填充特定阴影。此外,还会显示箭头,以便更直观地了解情况。 显示更高时间范围内的级别/区域(MTF 模式) 添加了使用更高时间间隔显示级别/区域的功能。此外,该指标还具有自动趋势检测功能(   TPSproTREND PRO   )。 用于交易的单独专业的逐步算法。 该算法专为日内交易而设计,既可顺势交易,也可逆势交易。每个活动模板均提供详细说明。 适用于多种时间范围 。 TPSpro RFI 水平指标可用于图表上的任何时间范围,从一分钟(M1)开始一直到每月(MN)。 图形和声音警报。 该指标提供图形和声音指示,
IX Power MT5
Daniel Stein
4.86 (7)
IX Power:解锁指数、大宗商品、加密货币和外汇市场洞察 概述 IX Power 是一款多功能工具,可分析指数、大宗商品、加密货币和外汇市场的强弱表现。 FX Power 提供针对货币对的最高精度,利用所有可用货币对数据进行分析,而 IX Power 专注于基础资产的市场数据。这使得 IX Power 成为非外汇市场的理想选择,同时在需要简单外汇分析时也非常可靠。它可以无缝适用于任何图表,提供清晰的、有行动价值的洞察,帮助提升您的交易决策。 1. 为什么 IX Power 对交易者非常有价值 多市场强弱分析 • IX Power 分析指数、大宗商品、加密货币和外汇市场的强弱表现,为每个市场提供量身定制的洞察。 • 监控 US30、WTI、黄金、比特币等资产的表现,发现交易机会。 适用于更广泛的市场 • 对于外汇交易, FX Power 提供无与伦比的精度,通过分析所有相关货币对。 • IX Power 专注于基础资产的市场数据,非常适合非外汇市场及简化的外汇分析。 实时适应性 • 借助自适应算法, IX Power 实时响应市场数据变化,保持分析的最新性。 • 实时更新
Matrix Arrow Indicator MT5
Juvenille Emperor Limited
5 (13)
矩阵箭头指标 MT5   是一种独特的 10 合 1 趋势,遵循   100% 非重绘多时间框架指标 ,可用于所有符号/工具: 外汇 、 商品 、 加密货币 、 指数 、 股票 。 Matrix Arrow Indicator MT5 将在其早期阶段确定当前趋势,从多达 10 个标准指标中收集信息和数据,它们是: 平均定向运动指数 (ADX) 商品渠道指数 (CCI) 经典 Heiken Ashi 蜡烛 移动平均线 移动平均收敛散度 (MACD) 相对活力指数 (RVI) 相对强弱指数 (RSI) 抛物线SAR 随机振荡器 威廉姆斯的百分比范围 当所有指标给出有效的买入或卖出信号时,相应的箭头将打印在图表上,在下一根蜡烛/柱线开盘时,指示强劲的上升趋势/下降趋势。用户可以选择使用哪些指标,并可以单独调整每个指标的参数。 Matrix Arrow Indicator MT5 仅从选定的指标中收集信息,并仅根据其数据打印箭头。   Matrix Arrow Indicator MT5   还可以为所有新信号发送终端、推送通知或电子邮件警报。无论您是黄牛、日内交易者还是波段交易者, Mat
This indicator is based on the mathematics of the great trader W.D. Ganna. With its help, you can easily find strong levels by analyzing swings to find the optimal entry point. The indicator works on all instruments and all timeframes. The indicator is fully manual and has control buttons. All you need to do is press the NEW button, a segment will appear, which you can place on any movement, swing or even 1 candle that you want to analyze. By placing the segment, press the OK button. A grid (th
Basic Harmonic Patterns Dashboard MT5
Mehran Sepah Mansoor
4.57 (7)
该仪表盘显示所选符号的最新可用谐波形态,因此您可以节省时间并提高效率 /  MT4 版本 。 免费指标:  Basic Harmonic Pattern 指标列 Symbol:   显示所选符号 Trend:     看涨或看跌 Pattern:    形态类型(Gartley、蝴蝶、蝙蝠、螃蟹、鲨鱼、Cypher 或 ABCD) Entry:     入口价格 SL: 止损价 TP1: 第一止盈价 TP2: 第二次获利价格 TP3: 第三次获利价格 Current price:    当前价格 Age (in bars):   最后绘制的模式的年龄 主要输入 Symbols :   从 "28 种主要货币对 "或 "选定符号 "中选择。 Selected Symbols :   希望监控的符号,用逗号分隔("EURUSD,GBPUSD,XAUUSD")。如果您的经纪商为货币对设置了后缀或前缀,您必须在以下两个参数中添加(货币对前缀或货币对后缀)。 Max Iteration:   调整模式的最大迭代次数(如果该值越小,则模式越少,性能越快;如果该值越大,则模式越多,性能越慢)
Quantum TrendPulse
Bogdan Ion Puscasu
5 (13)
介绍 Quantum TrendPulse   ,这是一款终极交易工具,它将 SuperTrend   、   RSI 和 Stochastic 的强大功能整合到一个综合指标中,以最大限度地发挥您的交易潜力。该指标专为追求精准和效率的交易者而设计,可帮助您自信地识别市场趋势、动量变化以及最佳进入和退出点。 主要特点: 超级趋势整合: 轻松跟随当前的市场趋势并乘上盈利浪潮。 RSI 精度: 检测超买和超卖水平,非常适合把握市场逆转时机,可用作 SuperTrend 的过滤器 随机精度: 利用随机振荡在波动的市场中寻找隐藏的机会, 用作超级趋势的过滤器 多时间范围分析: 从 M5 到 H1 或 H4,在不同时间范围内关注市场动态。 可定制的警报: 当您的自定义交易条件得到满足时收到通知,这样您就不会错过任何交易。 无论您是新手还是经验丰富的交易员,   Quantum TrendPulse 都能为您提供所需的优势,帮助您增强策略并自信地进行交易。借助这一强大的指标,将洞察力转化为利润 — 掌控您的交易! ***购买 Quantum TrendPulse,即可免费获得 Quantum Tr
Gann Zone Pro MT5
Kirill Borovskii
This indicator identifies and displays zones, as it were areas of strength, where the price will unfold. The indicator can work on any chart, any instrument, at any timeframe. The indicator has two modes. The indicator is equipped with a control panel with buttons for convenience and split into two modes. Manual mode: To work with manual mode, you need to press the NEW button, a segment will appear. This segment is stretched over the movement and the LVL button is pressed. The level is displayed
Gold Stuff mt5
Vasiliy Strukov
4.92 (173)
Gold Stuff mt5 是专为黄金设计的趋势指标,也可用于任何金融工具。 该指标不会重绘,也不会滞后。 推荐时间框架 H1。 购买后立即联系我以获得设置和个人奖励!   你可以在我的个人资料中找到它。   重要! 购买后立即与我联系,以获得说明和奖金!   您可以免费收到我们的强力支持和趋势扫描指标的副本,请私信。大部头书!   设置 绘制箭头 - 打开关闭。 在图表上绘制箭头。 警报 - 打开关闭声音警报。 电子邮件通知 - 打开关闭。 电子邮件通知。 Puch-notification - 打开关闭。 推送通知。 接下来,调整色域。 Gold Stuff mt5 是专为黄金设计的趋势指标,也可用于任何金融工具。 该指标不会重绘,也不会滞后。 推荐时间框架 H1。 购买后立即联系我以获得设置和个人奖励!   设置 绘制箭头 - 打开关闭。 在图表上绘制箭头。 警报 - 打开关闭声音警报。 电子邮件通知 - 打开关闭。 电子邮件通知。 Puch-notification - 打开关闭。 推送通知。 接下来,调整色域。
FX Dynamic:借助可定制的 ATR 分析,追踪波动率与趋势 概述 FX Dynamic 是一款强大的工具,通过计算平均真实波幅(ATR)来为交易者提供日内和日间波动性方面的深度见解。通过设置 80%、100%、130% 等关键波动率阈值,您可以快速识别潜在的盈利机会,或者在市场超出常规范围时及时得到预警。 FX Dynamic 可根据您经纪商的时区进行调整,帮助您保持一致的波动率衡量标准,并能与 MetaTrader 平台完美结合,实现实时分析。 1. 为什么 FX Dynamic 对交易者极具价值 实时 ATR 洞察 • 仅需一眼便可了解日间与日内波动水平。当价格触及或突破 80%、100%、130% 的 ATR 阈值时,会发出提示,让您知道市场是否达到临界水平。 • 在波动完全爆发前预判可能的衰竭或突破走势。 多市场通用 • 适用于外汇、商品、指数等多种资产。 FX Dynamic 可以自动识别经纪商时区,也可手动进行调整。 • 您可选择只专注于某一特定品种,或在多市场保持一致的 ATR 标准。 更智能的风险管理 • 利用 ATR 门槛来优化止损或止盈位置。当市场
支撑和阻力筛选器是 MetaTrader 的一个级别指标,它在一个指标内提供多种工具。 可用的工具有: 1. 市场结构筛选器。 2. 看涨回调区。 3. 看跌回调区。 4.每日枢轴点 5.每周枢轴点 6. 每月枢轴点 7. 基于谐波形态和成交量的强大支撑和阻力。 8. 银行级区域。 限时优惠:HV 支撑和阻力指示器仅售 50 美元且终生可用。 (原价 125$) 通过访问我们的 MQL5 博客,您可以找到我们所有带有分析示例的高级指标: 单击此处 主要特点 基于谐波和音量算法的强大支撑和阻力区域。 基于谐波和成交量算法的看涨和看跌回调区域。 市场结构筛选器 每日、每周和每月的枢轴点。 文档 所有支持和阻力筛选器文档(说明)和策略详细信息均可在我们 MQL5 博客的这篇文章中找到: 单击此处。 接触 如果您有任何问题或需要帮助,请通过私信联系我。 作者 SAYADI ACHREF,金融科技软件工程师,Finansya 创始人。
FourAverageMT5
Mikhail Sergeev
5 (2)
FourAverage是趋势检测中的一个新词。 随着信息技术的发展和大量的参与者,金融市场越来越不适合用过时的指标进行分析。 传统的技术分析工具,如移动平均线或随机指标,其纯粹形式无法确定趋势的方向或其逆转。 一个指标可以根据14年的历史指示未来价格的正确方向,而不改变其参数吗? 与此同时,不要失去充足的横向市场走势? 答:可以。 我们的团队开发了一个指标,具有相当强大和有效的机制来适应不断变化的市场条件。 2025年,领先的趋势指标"FourAverage"正进入新的发展阶段。 现代加密货币和股票市场似乎是为此指标创建的。 独特的平滑公式允许您调整(识别模式)指标的任何特征的货币对或其他工具。 现在,为了盈利,一个指标就足够了,而这仅仅是个开始。 与其他工具结合使用或作为信号滤波器,FourAverage的好处是巨大的。 该指标有一个内置函数,绘制箭头并在指标上显示前一笔交易的结果。 这使得检查历史非常方便。 这是非常容易使用这个趋势指标。 1)确定具有良好增长潜力的资产。 2)使用一组内置指标设置或选择您自己的选项。 3)您正在等待指标的信号来开启交易。 4)打开一个位置,并获得利
首先,值得强调的是,这个交易工具是非重绘、非重画和非滞后的指标,非常适合专业交易。 在线课程,用户手册和演示。 智能价格行动概念指标是一个非常强大的工具,既适用于新手,也适用于经验丰富的交易者。它将超过20个有用的指标合并到一个指标中,结合了高级交易思想,如内圈交易员分析和智能资金概念交易策略。该指标侧重于智能资金概念,提供有关大型机构交易方式的见解,帮助预测它们的动向。 它在流动性分析方面尤其擅长,有助于理解机构的交易方式。它擅长预测市场趋势,并仔细分析价格波动。通过将您的交易与机构策略对齐,您可以更准确地预测市场走向。该指标多才多艺,擅长分析市场结构,识别重要的订单区块,并识别各种模式。 它擅长识别BOS和CHoCH等模式,理解动量的转变,并突出显示供需强劲的关键区域。它还擅长发现强大的不平衡,并分析价格创造更高高点或更低低点的模式。如果您使用斐波那契回撤工具,该指标可以满足您的需求。它还可以识别相等的高点和低点,分析不同的时间框架,并通过仪表板显示数据。 对于使用更高级策略的交易者,该指标提供了工具,如公平价值差指标和优惠和折扣区域的识别。它特别关注高时间框架订单区块,并
Gold Trend 5
Sergei Linskii
3.5 (2)
黄金趋势 - 这是一个很好的股票技术指标。该指标算法分析资产的价格走势,并反映波动性和潜在进入区。 最佳指标信号: - 卖出 = 红色柱状图 + 红色短指针 + 同方向黄色信号箭头。 - 买入 = 蓝色柱状图 + 蓝色多头指针 + 同方向水蓝色信号箭头。 该指标的优点 1. 该指标生成的信号准确度高。 2. 只有当趋势发生变化时,才能重新绘制已确认的箭头信号。 3. 您可以在任何经纪商的 MetaTrader 5 交易平台上进行交易。 4. 您可以交易任何资产(货币、金属、加密货币、股票、指数等)。 5. 最好在 H1 时间框架(中期交易)上进行交易。 6. 在指标设置中可更改个别参数(TF、颜色等),以便每位交易者都能轻松定制适合自己的指标。 7. 该指标既可作为交易系统的主要补充,也可作为独立的交易系统使用。   注意:交易的入場準確性和盈利能力僅取決於交易者的技能。 任何指標都只是交易者的助手,而不是行動指南。黃金法則 - 根據趨勢開單,獲利並等待下一個最佳訊號。 MetaTrader 4 黄金趋势指标版本  祝大家交易好运,稳定盈利!
Atomic Analyst MT5
Issam Kassas
4.32 (19)
首先值得强调的是,该交易指标是非重绘、非延迟的指标,这使其成为手动和机器人交易的理想选择。 用户手册:设置、输入和策略。 Atomic Analyst是一种PA价格行动指标,利用价格的力量和动量来寻找市场上更好的机会。配备了高级过滤器,可帮助去除噪音和假信号,并提高交易潜力。使用多层复杂的指标,Atomic Analyst扫描图表,并将复杂的数学计算转化为任何初学者都能理解并用来做出一致交易决策的简单信号和颜色。 “Atomic Analyst”是专为新手和经验丰富的交易者量身定制的综合交易解决方案。它将高级指标和一流功能融合为一体的交易策略,使其成为所有类型交易者的多功能选择。 日内交易和剥头皮策略:专为快速准确的日内交易和短期交易而设计。 日内和摆动交易策略:可用作追求价格大幅波动的日内和摆动交易者的可靠工具。 多货币和市场:凭借其可靠的精度,在不同的工具和市场上运作。 多个时间框架:可在多个时间框架上使用,性能良好。 稳定性:所有指标均不重绘、不重绘和不滞后,确保可靠的信号。 信号清晰度:提供箭头信号,用于清晰的入场和出场点。 实时警报:通过交易入场、SL和TP警报通知交易者
PZ Trend Trading MT5
PZ TRADING SLU
3.8 (5)
许多盈利交易者不仅知道如何识别市场趋势,而且也能把握趋势建立后的交易机会。 Pz 趋势交易 指标设计用来在趋势行情中尽可能的赚取利润。 已建立的趋势提供了一揽子交易机会,但大多数趋势交易指标完全忽视了它们,让交易者在趋势行情时完全不知道该如何做!一般趋势指标只通知有关的趋势变化,但根本不足以得到卓越的回报. Pz 趋势交易 指标比一般趋势指标显示多达 20 倍的交易 , 因为它注重所谓的市场时机。它不仅显示当前的市场趋势,也有回调,内柱线的突破和调整。它令您在趋势回调之后介入,安全的柱线内突破金字塔加仓,以及发现潜在的反转,和已知的调整。 趋势改变 一个趋势改变在市场方向变化时发生。趋势变化在图表上用带数字的彩色圆圈显示。蓝色 (1) 信号为上涨开始, 而红色 (1) 信号为下跌开始。趋势变化并非评估当前价格动作的结果, 它意味着交易设置是不定时地。如果您正确使用本指标, 在趋势变化时, 您将将已经入场 (参看下面的调整)。 回调 但凡趋势在运动中,行情上下抖动,盈利者收割利润,且其它参与者入场。趋势回调代表好的买入机会,通常是由主力获利离场导致。如果行情在回调后回归上行, 指标将
Easy Breakout MT5
Mohamed Hassan
5 (3)
After your purchase, feel free to contact me for more details on how to receive a bonus indicator called VFI, which pairs perfectly with Easy Breakout for enhanced confluence!     Easy Breakout MT5   is a powerful price action trading system built on one of the most popular and widely trusted strategies among traders: the   Breakout strategy ! This indicator delivers crystal-clear Buy and Sell signals based on breakouts from key support and resistance zones. Unlike typical breakout indicators
MetaForecast M5
Vahidreza Heidar Gholami
5 (2)
MetaForecast能够根据价格数据中的谐波来预测和可视化任何市场的未来走势。虽然市场不总是可预测的,但如果价格中存在模式,MetaForecast可以尽可能准确地预测未来。与其他类似产品相比,MetaForecast通过分析市场趋势可以生成更精确的结果。 输入参数 Past size (过去的尺寸) 指定MetaForecast用于创建生成未来预测模型的柱数量。该模型以一条黄色线绘制在所选柱上。 Future size (未来的尺寸) 指定应预测的未来柱数量。预测的未来以粉色线表示,并在其上绘制了蓝色回归线。 Degree (程度) 此输入确定了MetaForecast将在市场上进行的分析级别。 Degree 描述  0 对于程度0,建议使用较大的值来设置“过去的尺寸”输入,以覆盖价格中的所有高峰、低谷和细节。  1 (建议的) 对于程度1,MetaForecast可以理解趋势,并通过较小的“过去的尺寸”生成更好的结果。  2 对于程度2,除了趋势,MetaForecast还可以识别反转点。对于大于1的程度,必须使用较高的“细节”和“噪音减少”输入值。  大于2 不建议使用大于
Entry Points Pro for MT5
Yury Orlov
4.46 (130)
这款指标用于 MT5,可提供准确的入场交易信号,且无重绘。 它可应用在任何金融资产:外汇、加密货币、贵金属、股票、指数。 它将提供极其精准的评估,并告诉您何时开仓和平仓的最佳时机。 观看 视频 (6:22),其中包含一个仅处理单一信号的示例,该信号即可值回指标购价! 大多数交易者在 Entry Points Pro 指标的帮助下,在第一个交易周内即改善了他们的交易结果。 订阅我们的 Telegram 群 ! Entry Points Pro 指标的益处。 入场信号无重绘 如果信号出现,并得到确认,则它不会再消失;不像是重绘指标,它会导致重大的财产损失,因为它们可以在显示信号后再将其删除。 无差错开仓 指标算法可令您找到入场交易(买入或卖出资产)的理想时机,从而提高每位交易者的成功率。 Entry Points Pro 可操作任何资产 它允许您在 MT5 平台上交易任何经纪商的加密货币、股票、贵金属、指数、大宗商品和货币。 提供任何方向的信号 Entry Points Pro 指标提供针对任意价格走势的入场交易信号 - 上涨、下跌或横盘(横向)。 最大盈利潜力 离场信号
RelicusRoad Pro MT5
Relicus LLC
4.78 (18)
现在$ 147(更新后增加到$ 499) - 无限帐户(PC或Mac) RelicusRoad 用户手册 + 培训视频 + 访问 Private Discord Group + VIP 身份 一种看待市场的新方式 RelicusRoad 是世界上最强大的外汇、期货、加密货币、股票和指数交易指标,为交易者提供保持盈利所需的所有信息和工具。我们提供技术分析和交易计划,帮助每一位交易者取得成功,从初学者到高级。它是一个关键的交易指标,可以提供足够的信息来预测未来的市场。我们相信一个完整的解决方案,而不是图表上几个没有意义的不同指标。这是一个多合一指标,显示无与伦比且非常准确的信号、箭头 + 价格行为信息。 RelicusRoad 基于强大的人工智能,提供缺失的信息和工具来教育您并使您成为交易专家,成为成功的交易者。 几乎所有技术指标都滞后,这意味着它们只能报告已经发生的事情。因此,他们只确认您过去可以看到的价格已经在哪里。我们相信领先指标可以预测未来价格,而无需重新绘制,也不要过度依赖可能改变并导致重新绘制的滞后指标。如果您根据滞后指标进行交易并建立头寸,您就知道您已经大部分时间
Trend Line Map Pro MT5
STE S.S.COMPANY
4.09 (11)
趋势线图指标是趋势筛选器指标的插件。它用作趋势筛选器(趋势线信号)生成的所有信号的扫描仪。 它是基于趋势筛选器指标的趋势线扫描仪。如果您没有 Trend Screener Pro Indicator,Trend Line Map Pro 将无法使用。 It's a Trend Line Scanner based on Trend Screener Indicator. If you don't have Trend Screener Pro Indicator,     the Trend Line Map Pro will not work . 通过访问我们的 MQL5 博客,您可以下载趋势线图指标的免费版本。购买前试用,不受 Metatrader Tester 限制。 :  点击这里 1. 容易获得的优势 根据货币和时间范围显示买入和卖出信号。 评估自图表中出现箭头以来价格上涨或下跌的点数。 (趋势筛选指标箭头) 显示信号的时序。 获取多时间范围和多货币警报以购买和出售警报。 2. 如何使用趋势线图 如何显示买卖信号仪表板? 如果您有任何问题或需要帮助,请通过私
Timeframes Trend Scanner is a trend analyzer or trend screener indicator that helps you know the trend in all timeframes of symbol you're watching. This indicator provides clear & detailed analysis results on a beautiful dashboard, let you able to use this result right away without need to do any additional analysis. Please note that this indicator doesn't work with Strategy Tester. Sorry for that! How it works Step 1: Calculate values of 23 selected & trusted technical indicators (Oscillator &
EXCLUSIVE! JUST  10 COPIES  AVAILABLE!   BONUS AUX VIP Club 2024 : Include EA CAP, CEP, LDH, PSC307 & AO4C to enhance the performance of this tool to its maximum potential  Click Here to Download Files   ( for users only ) FREE Trading Education Available Daily via Zoom --- For More Info or Instant Message Click link ---  https://t.me/abcdwave Transform your trading with the "Five Magic Bullets" Indicator, tailored for traders who embrace the power of Elliott Wave Chaos Theory.
Bill Williams Advanced
Siarhei Vashchylka
5 (9)
Bill Williams Advanced is designed for automatic chart analysis using Bill Williams' "Profitunity" system. The indicator analyzes four timeframes at once. Manual (Be sure to read before purchasing) Advantages 1. Automatically analyzes the chart using the "Profitunity" system of Bill Williams. The found signals are placed in a table in the corner of the screen. 2. Equipped with a trend filter based on the Alligator indicator. Most of the system signals are recommended to be used only according t
作者的更多信息
SuperTrend for MT5
Ulises Calderon Bautista
5 (4)
当涉及到金融市场时,"SuperTrend"这一备受欢迎的指标是一款技术分析工具,有助于识别趋势的方向以及市场可能的入场或离场点。该指标基于平均真实波幅(ATR),它根据价格范围来衡量市场的波动性。在其他平台上,它是免费提供的,这里也不例外! 该指标通常以三种方式使用: 识别当前趋势:当价格位于该线的上方时,被视为上升趋势,当价格位于下方时,被视为下降趋势。 用作止损水平。 作为动态支撑/阻力:在上升趋势中,该线位于价格下方,充当动态支撑水平。在下降趋势中,该线位于价格上方,充当动态阻力水平。 此指标的独特之处在于,它不仅可以帮助交易者确定趋势,还可以提供有效的风险管理策略。它是一个多功能工具,适用于各种市场和交易风格,从而为交易者提供了更大的灵活性和可操作性。无论是趋势追踪还是反转交易,"SuperTrend"都为交易者提供了关键的视觉指引,使他们能够更好地做出决策并取得成功。
FREE
Correlated MT5
Ulises Calderon Bautista
Correlation occurs when the price of two or more currency pairs move together. Being positive correlation, where prices move in the same direction or negative correlation, where they move in opposite directions. As a trader, it's important to understand that relation, as it can unconsciously affect your account's risk exposure. Correlated is an Expert Advisor that identifies and takes advantage of divergent movements in strongly correlated currency pairs. It also shows a table of yields, standa
Double or Triple EMA Envelope
Ulises Calderon Bautista
5 (1)
指数移动平均线(双重或三重)包络指标是一种技术分析工具,旨在帮助您识别金融市场中的趋势和潜在的逆转点。该指标为交易员提供了选择两种指数移动平均线的灵活性:双重指数移动平均线(DEMA)或三重指数移动平均线(TEMA)。 主要特点: 双重或三重指数移动平均线:根据您的分析偏好和需求,切换在DEMA和TEMA之间。 可定制的包络线:定义自己的带宽参数并调整包络线的外观以适应您的交易风格。 趋势识别:包络线有助于可视化市场趋势,从而更容易识别看涨和看跌趋势。 潜在的逆转点:价格触及包络线可能表明潜在的逆转点,使您能够做出明智的决策。 用户友好:该指标易于在您的MetaTrader 5平台上安装和使用。 立即免费下载此指标,提升您在MetaTrader 5中的技术分析能力!
FREE
筛选:
无评论
回复评论