• 概述
  • 评论 (2)
  • 评论 (6)
  • 新特性

ON Trade Waves Patterns Harmonic Elliot Wolfe

5

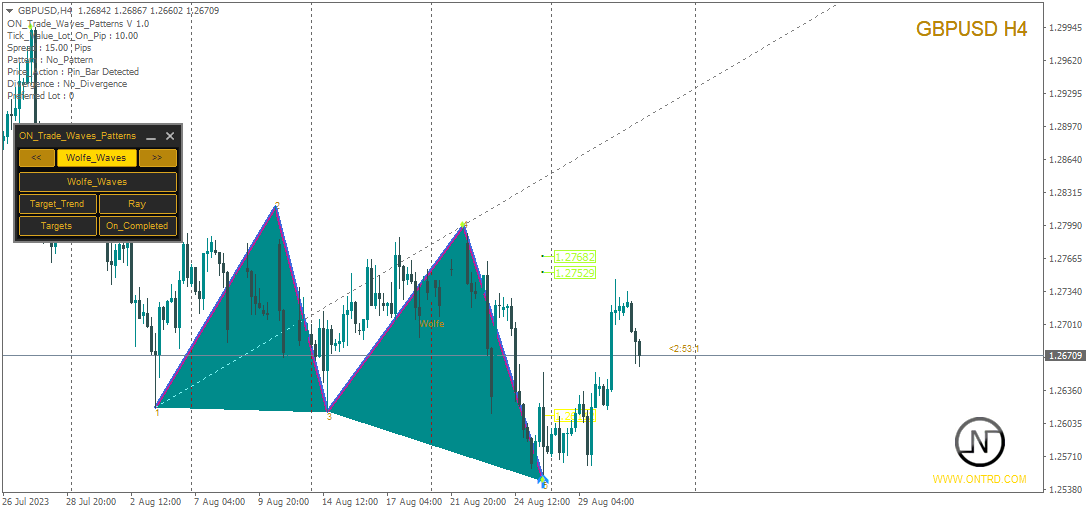
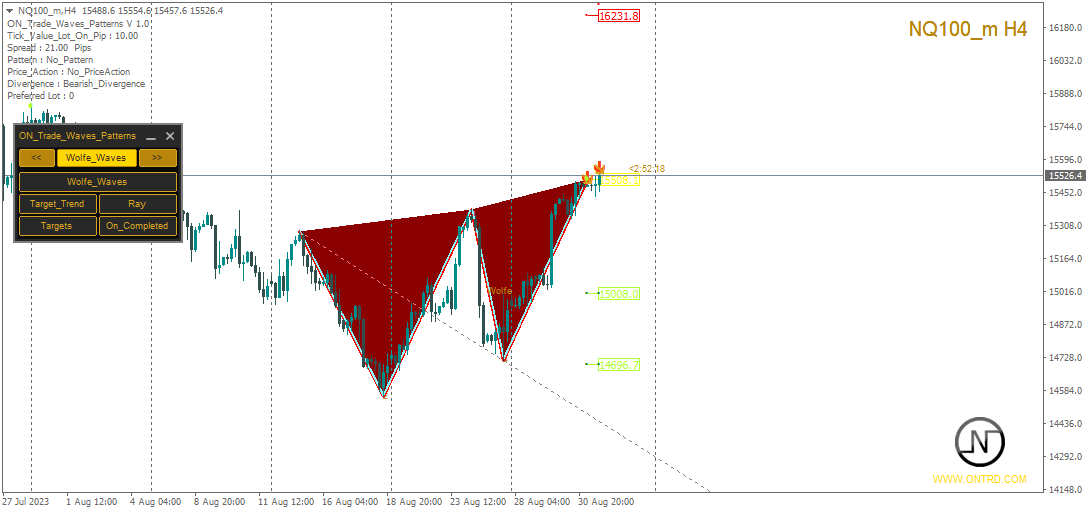
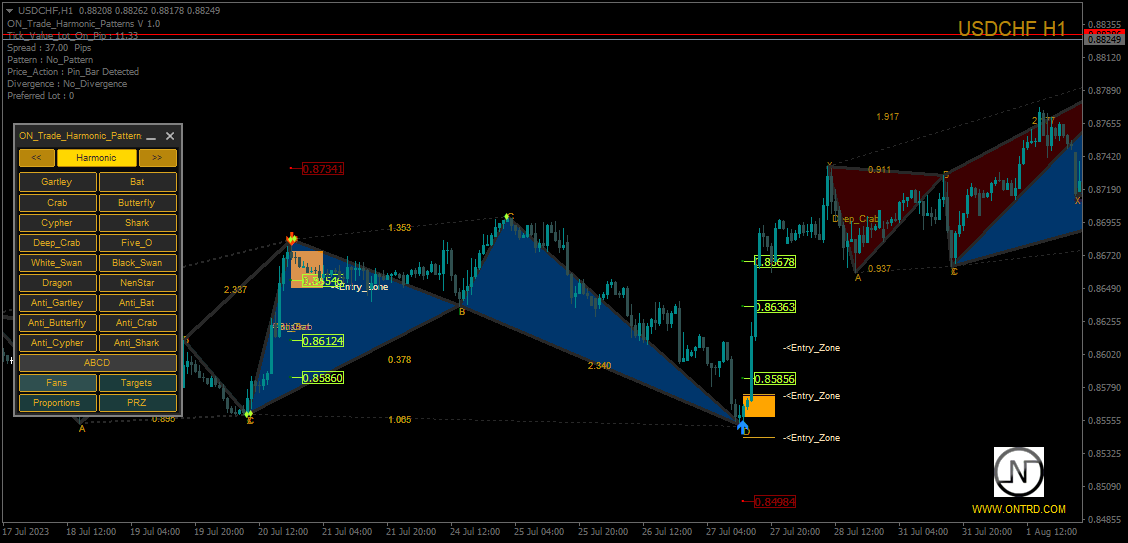
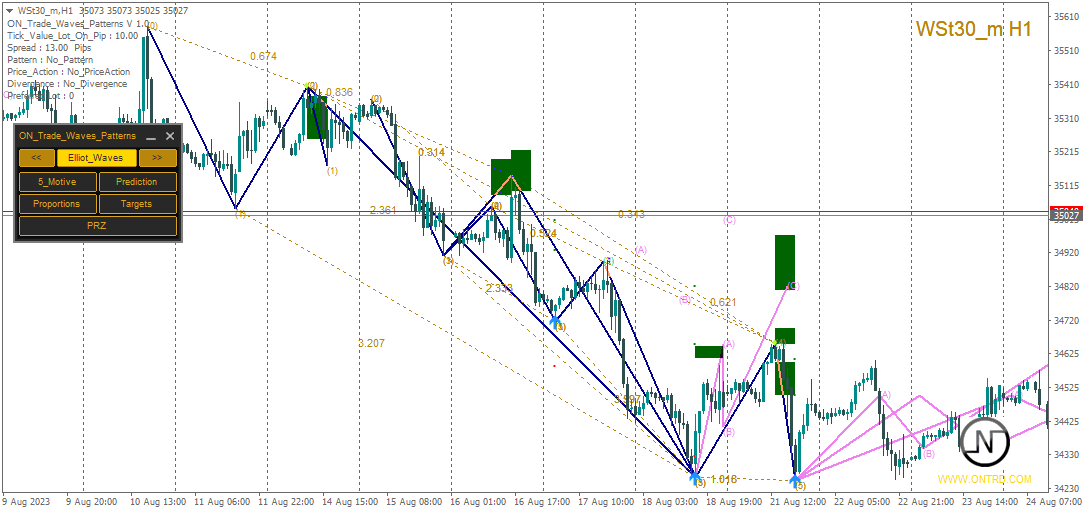
介绍 ON Trade Waves Patterns Harmonic Elliot Wolfe,这是一款高级指标,旨在使用手动和自动方法检测各种市场模式。以下是它的工作原理:

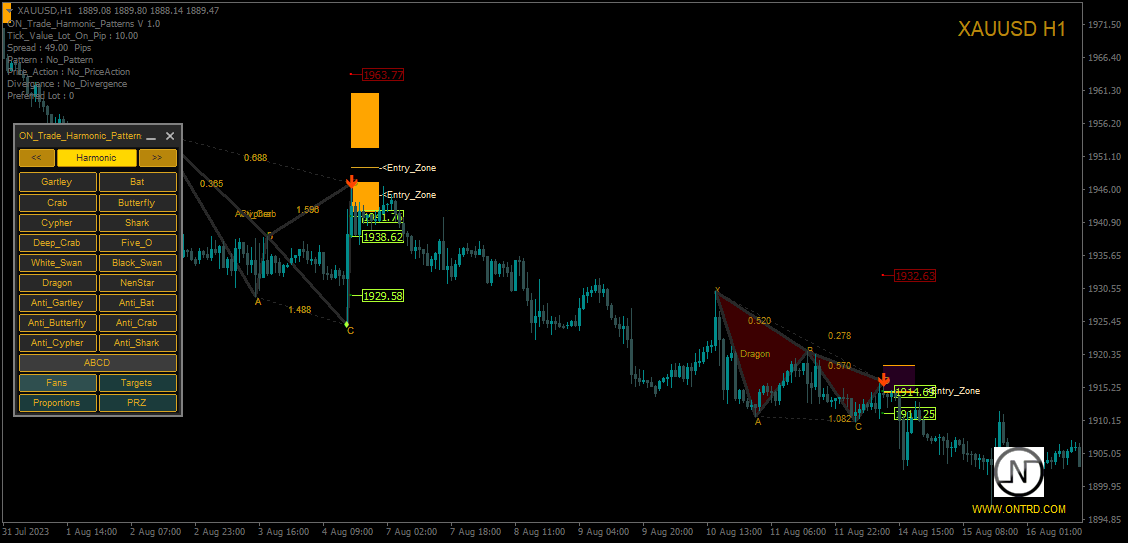
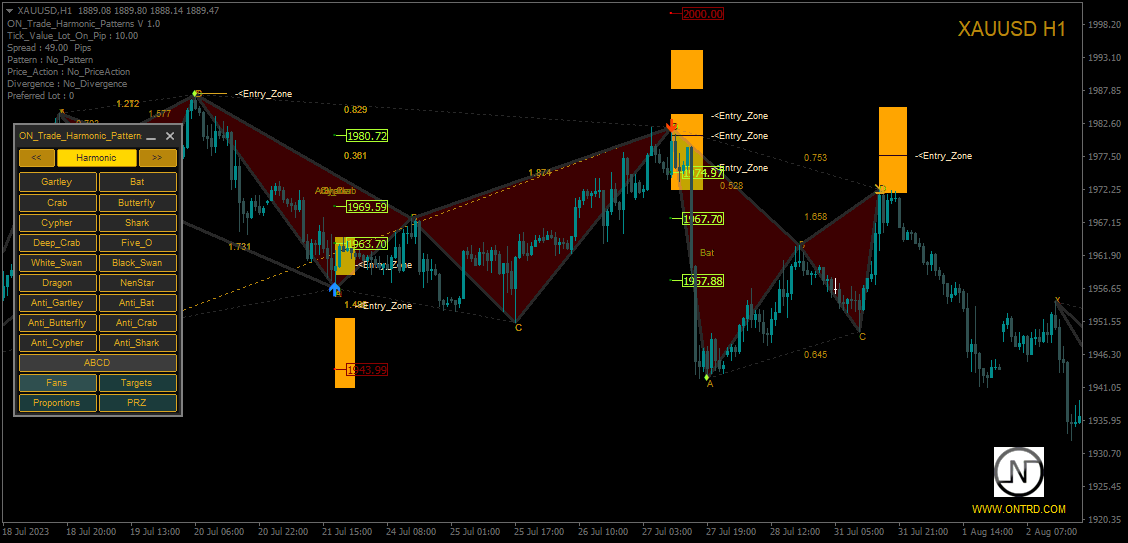
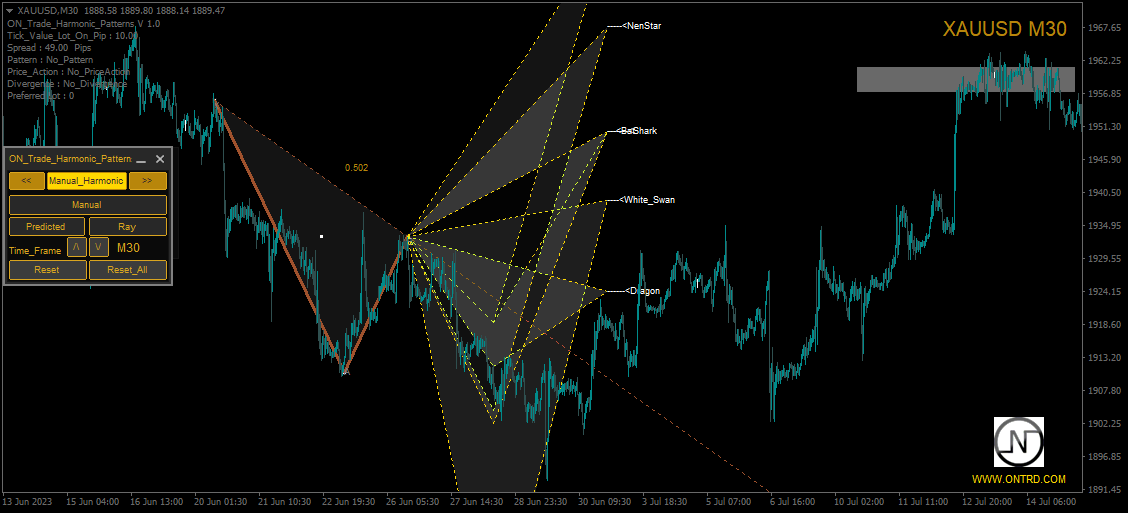
谐波模式: 该指标可以识别出现在您图表上的谐波模式。这些模式对于练习谐波交易理论的交易者非常重要,正如Scott Carney的书《谐波交易第1卷和第2卷》所描述的那样。无论您是手动绘制它们还是依赖自动检测,ON Trade Waves Patterns都可以胜任。

控制面板: 我们配备了一个用户友好的控制面板,它会保存您的图表和时间帧设置,使您可以轻松切换不同配置。您甚至可以最小化它以最大化图表空间。如果您更喜欢使用其他分析工具,只需单击关闭按钮即可隐藏所有指标数据。

模板保存: 当您自定义设置或添加其他指标,如移动平均线或布林带时,该指标会自动保存您的模板。这意味着您可以随时轻松加载您喜欢的设置。

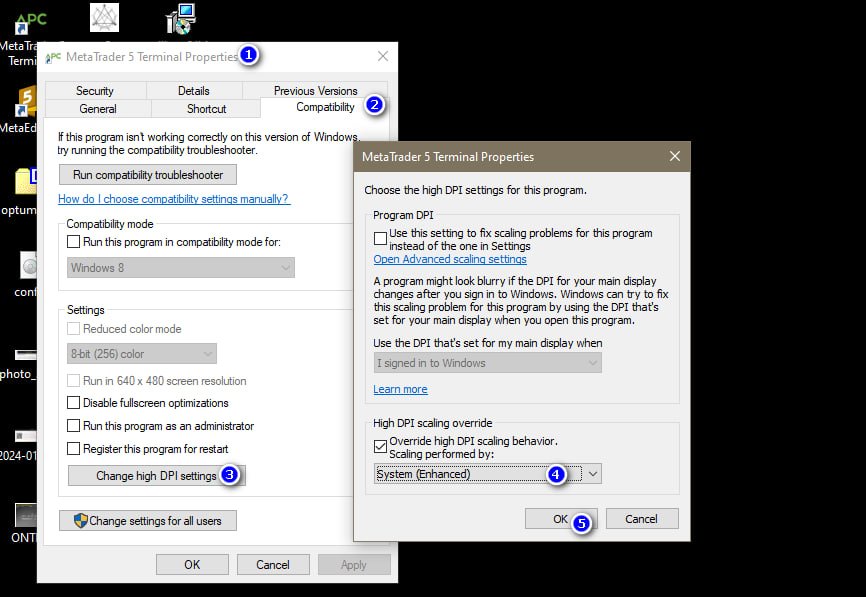
优化显示: 对于Windows 10用户,我们建议调整您的DPI设置以获得高清设备上的最佳屏幕体验。右键单击MetaTrader图标,选择“兼容性”,然后选择“更改高DPI设置”,将其设置为“系统(增强)”。

附加功能: ON Trade Waves Patterns Harmonic Elliot Wolfe不仅仅限于谐波模式。它还提供了其他一些有价值的功能:

  • 价格和时间警报线,让您随时了解情况。
  • 斐波那契风扇以补充您检测到的模式。
  • 用于高级分析的枢轴、Camarella和模式射线。
  • 将手动绘制的对象从较高时间帧加载到较低时间帧的能力。
  • 提供目标、止损水平和入场点的警报和通知系统作为信号。
  • 检测黄色和橙色箭头的分歧,提供额外的确认。
  • 为每个模式自动计算最佳手数,帮助您有效管理风险。
  • 识别价格行动模式,如Pinbar、Inside Bar和Outside Bar。

与专家顾问(EAs)的集成: 如果您喜欢算法交易,您可以使用提供的代码将该指标的缓冲区应用于EA。

ON Trade Waves Patterns Harmonic Elliot Wolfe是您识别和分析模式的全面工具,提供一系列功能,以增强您的交易策略。

通过查看我们的用户手册 [插入链接] 了解更多关于这个强大指标的信息。立即开始最大化您的交易潜力吧!


评论 2
Sameer Haque
528
Sameer Haque 2023.09.10 16:06 
 

Highly accurate and very versatile. A great addition to my toolkit.

推荐产品
Introduction to X3 Chart Pattern Scanner X3 Cherart Pattern Scanner is the non-repainting and non-lagging indicator detecting X3 chart patterns including Harmonic pattern, Elliott Wave pattern, X3 patterns, and Japanese Candlestick patterns. Historical patterns match with signal patterns. Hence, you can readily develop the solid trading strategy in your chart. More importantly, this superb pattern scanner can detect the optimal pattern of its kind. In addition, you can switch on and off individu
Elliott Wave Trend MT4
Young Ho Seo
4 (7)
Elliott Wave Trend was designed for the scientific wave counting. This tool focuses to get rid of the vagueness of the classic Elliott Wave Counting using the guideline from the template and pattern approach. In doing so, firstly Elliott Wave Trend offers the template for your wave counting. Secondly, it offers Wave Structural Score to assist to identify accurate wave formation. It offers both impulse wave Structural Score and corrective wave Structure Score. Structural Score is the rating to sh
Introduction to Harmonic Volatility Indicator Harmonic Volatility Indicator is the first technical analysis applying the Fibonacci analysis to the financial volatility. Harmonic volatility indicator is another level of price action trading tool, which combines robust Fibonacci ratios (0.618, 0.382, etc.) with volatility. Originally, Harmonic Volatility Indicator was developed to overcome the limitation and the weakness of Gann’s Angle, also known as Gann’s Fan. We have demonstrated that Harmonic
Gartley Projection D
Oleksandr Medviediev
3.71 (7)
具有经过验证的概念和盈利能力的最佳、最有效、可靠的产品。感谢您的考虑。  该指标根据H.M.Gartley的发展(《股票市场利润》,1935年)识别和确认谐波模式(XABCD)。 它将D点投影为透视投影中的一个点(在设置中指定ProjectionD_Mode = true)。 不会重绘。当工作时间段的柱形图关闭时,如果已识别的模式点在Patterns_Fractal_Bars柱中未移动,则在图表上出现一个箭头(指向预期价格运动的方向)。从此刻起,箭头将永久保留在图表上。 注意:连续出现2-3个或更多箭头 - 这是市场条件的变化,而不是重绘。 总共有85种模式(包括Gartley-222和Gartley-222WS,完整列表可在评论部分的Google Drive链接中找到)。在所有已识别的模式中,只有最新识别的模式填充了单一颜色。 参数 DrawPatterns(true/false)- 以实心颜色绘制模式 ProjectionD_Mode(true/false)- 定义D点作为透视投影模式 Patterns_Fractal_Bars - 在认定为形
Harmonic Pattern Plus MT4
Young Ho Seo
4.47 (19)
Introduction Harmonic Patterns are best used to predict potential turning point. Traditionally, Harmonic Pattern was identified manually connecting peaks and troughs points in the chart. Manual harmonic pattern detection is painfully tedious and not suitable for everyone. You are often exposed under subjective pattern identification with manual pattern detection. To avoid these limitations, Harmonic Pattern Plus was designed to automate your harmonic pattern detection process. The functionality
BeST_Gann Swing Oscillator is an MT4 indicator that is based on the corresponding work of Robert Krausz who introduced it in the book “ A.W.D Gann Treasure Discovered ” . The Gann Swing Oscillator is a range-bounding technical indicator that oscillates between +1 and -1 and thus it describes the market swings. Generally when the market is in an upswing, the Gann Swing Oscillator describes it as 2 higher highs with the value of +1 while after an upswing, the downswing is expected. Also the do
Abcde MT4
Mahsa Farjami
ABCDE指标: 这个指标基于价格行为的主要ABC模式(即突破、回撤、运动)。这些模式类似于上涨基础上涨模式,需要进行趋势分析和背离分析等一系列分析来检查并发出准确的信号。它将提供相当准确的交易信号,并告诉您什么时候开仓和平仓最为合适。它可以应用于任何金融资产:外汇、加密货币、贵金属、股票和指数。 主要特点: •   非常易于使用 •   多时间框架警报 •   固定价格的止损和获利订单。 •   可以与任何交易工具一起使用(外汇、差价合约、期货等) •   电子邮件提醒 •   电话通知 •   它将提供相当准确的交易信号,并告诉您何时最好开启和关闭交易。 •   在图表上显示开仓线、止损、获利。 •   有免费演示版本。 推荐设置: •    EURUSD,M15(15分钟图表) •    显示趋势验证:True •    显示增量蜡烛图:True 什么是理想的入场点? 进入交易的最佳点是由星形和钻石形态所代表的E点。这些模式将在设置中启用“显示趋势验证”和“显示增量蜡烛图”时显示出来。 我该如何使用ABCD指标进行交易?
Reversal Pattern Pro
Boonyapagorn Rodvattanajinda
Reversal Patterns Pro Reversal Patterns Pro is a Price Action (PA) analytical tool that scans the reversal patterns.  - Finds and marks the most dependable Japanese candlestick patterns in real-time. - Supports all time frames (Best for Scalping) - Doesn't repaint making it an exceptional indicator for Expert Advisors. Input parameters : - Support & Resistance Mode ( true or false ) for enabling advanced filtering - Donchian Period - RSI Period - RSI Oversold Level - RSI Overbought Level - 
ABCD Harmonic Patterns
Mehmet Ozhan Hastaoglu
Thanks to this indicator, you can easily see the new ABCD harmonic patterns in the chart. If the two price action lengths are equal, the system will give you a signal when it reaches the specified level. You can set the limits as you wish. For example, You can get the signal of the price, which occurs in the Fibonaci 38.2 and 88.6 retracements, and then moves for the same length, at the level you specify. For example, it will alarm you when the price reaches 80% as a percentage. In vertic
El indicador "MR BEAST ALERTAS DE LIQUIDEZ" es una herramienta avanzada diseñada para proporcionar señales y alertas sobre la liquidez del mercado basándose en una serie de indicadores técnicos y análisis de tendencias. Ideal para traders que buscan oportunidades de trading en función de la dinámica de precios y los niveles de volatilidad, este indicador ofrece una visualización clara y detallada en la ventana del gráfico de MetaTrader. Características Principales: Canal ATR Adaptativo: Calcula
Introduction to Smart Renko The main characteristics of Renko Charting concern price movement. To give you some idea on its working principle, Renko chart is constructed by placing a brick over or below when the price make the movement beyond a predefined range, called brick height. Therefore, naturally one can see clear price movement with less noise than other charting type. Renko charting can provide much clearer trend direction and it helps to identify important support and resistance level
Gann Price Level
Kirill Borovskii
The indicator is designed to work on any trading platform. The program is based on proprietary algorithms and W.D.Ganna's mathematics, allowing you to calculate target levels of price movement based on three points with the highest degree of certainty. It is a great tool for stock trading. The indicator has three buttons: NEW - call up a triangle for calculation. DEL - delete the selected triangle. DELS - completely remove all constructions. The probability of achieving the goals is more than 80
Inside Bar Indicator MT4
Nedyalka Zhelyazkova
5 (12)
This inside bar indicator MT4  is suitable if you are doing inside bar trading. So what this MT4 inside bar indicator does is identifies inside bars for you as they form on your charts. Inside bar is a famous trading pattern in which the bar carry higher low and lower high compared with the previous bar, also known as mother bar. With, a lesser time frame like the 1 hour chart, daily inside bar chart will sometimes appears to be similar to a triangle pattern. Inputs AlertOn - enable alerts Ema
FREE
AndInvest Impulse
Bruno Ravardiere De Oliveira Goncalves
Em uma negociação no Mercado Financeiro nada é mais importante que saber o momento certo de entrar em uma negociação. O AndInvest Impulse auxilia traders a capturar o momento exato de abrir uma negociação, para isto ele desenha topos e fundos facilitando a leitura do Price Action e após um breve momento de realização do mercado ele identifica o retorno da ponta compradora ou vendedora de força antecipada e sem repintura. Comprovação de Resultados: https://youtu.be/CA1_ZtZY0vk Funciona em qualque
The reason why many traders new to using the Fibonacci retracement tool find it hard to effectively use it is because they are having trouble identifying swing points that are significant enough to be considered. Main Features Show Fibonacci number with LL to HH in multitimeframe Show 23.6,38.2,50,61.8,78.6,88.6,100,112.8,127.2,141.4,161.8,200,224,261.8,314,361.8 and 423 of Fibonacci number Easy to use with simple interface. Real time information for the Fibonacci number . Settings Global
Introduction to Chart Pattern MT Chart Pattern MT is a chart pattern scanner to detect the triangle pattern, falling wedge pattern, rising wedge pattern, channel pattern and so on. Chart Pattern MT uses highly sophisticated chart pattern detection algorithm. However, we have designed it in the easy to use with intuitive user interface. Chart Pattern MT will show all the patterns in your chart in the most efficient format for your trading. You do not have to do tedious manual pattern detection an
Monster Harmonic Indicator
Paul Geirnaerdt
4.61 (31)
Monster Harmonics Indicator is a harmonic pattern indicator. It recognizes Gartley, Bat, Crab, Butterfly, Cypher, White Swan, Black Swan, Shark and several other patterns. Projected patterns that are not yet completed are recognized, too. Monster even shows the PRZ (Potential Reversal Zone). Users can add their own user defined patterns to Monster. Besides the current pattern, Monster also shows all patterns in the symbols history. Monster will provide alerts for developing patterns. Introduced
Black series MT4
Dmitriy Kashevich
1 (1)
Black series MT4 - The indicator is designed for trading on binary options with Timeframe M1-M5-M15 Multicurrency (Works on cryptocurrency and currency pairs) The signal appears when the candle opens Up to 90% correct signals There is no signal redrawing at all Can be used with other indicators. Good for scalping! In Settings there is: -Indicator working methods -I Allert Arrow color Red signal down Blue signal up Also watch the video how the indicator works and signals
Introduction to Fractal Pattern Scanner Fractal Indicator refers to the technical indicator that makes use of the fractal geometry found in the financial market. Fractal Pattern Scanner is the advanced Fractal Indicator that brings the latest trading technology after the extensive research and development work in the fractal geometry in the financial market. The most important feature in Fractal Pattern Scanner is the ability to measure the turning point probability as well as the trend probabi
Trend lines master
The Trading Team Ltd
5 (1)
Launch promotion For a limited time only:  30$ instead of 157$ Summary Create precise trend lines in a second Description This indicator will draw your trend lines automatically with great precision, saving you some precious time. It uses Bill Williams Fractals to identify the key points and draws both inner and outer trend lines. Features Automatically draws precise trend lines
Gioteen Volatility Index (GVI)   - your ultimate solution to overcoming market unpredictability and maximizing trading opportunities. This revolutionary indicator helps you in lowering your losing trades due to choppy market movements. The GVI is designed to measure market volatility, providing you with valuable insights to identify the most favorable trading prospects. Its intuitive interface consists of a dynamic red line representing the volatility index, accompanied by blue line that indicat
This indicator detects Inside Bar Narrow Range 4 and Inside Bar Narrow Range 7 two powerful patterns on 28 pairs on all timeframes.  "Inside Bar Narrow Range 4"  is an inside bar with the narrowest range out of the last 4 bars so "Inside Bar Narrow Range 7" an inside bar with the narrowest range  out of the last 7 bars. Hence, IBNR4 and better IBNR7 are an objective criterion for identifying  decreased range and volatility. Once we find an IBNR4 or an IBNR7 pattern, we aim to trade the breakou
The Raven Binary Options Indicator
Ellan Dirgantara Tholkhah
1 (1)
UPDATE: Works EXTREMELY well for EURJPY! --> more than 66% win rate monthly Guarantee! I want to introduce you the next-gen unique adaptive Binary options Indicator. This will destroy EURUSD & EURJPY The Raven is so sharp and efficient that it will pick the tops and bottoms of ANY type of market. Can also be used as a Forex Scalper. The Raven signal is based on multiple confirmation analysis. Gets confirmation from the most consistent signals known to man; Ichimoku, SMA, Bollinger Bands; and als
本指标是实践实战交易完善的波浪自动分析的指标 !  黄金实战 案例... 注:波浪分级用西方叫法不习惯,因 受到缠论(缠中说禅)命名方式习惯的影响,我是将基础波浪命名为 笔 , 将二级波段命名为 段 , 同时具有趋势方向的段命名为 主趋段 (以后笔记中都是这种命名方式,先告知大家),但是算法上和缠论关系不大切勿混淆.反映的是本人分析盘面总结的 千变万化纷繁复杂的运行规律 . 对波段进行了标准化定义,不再是不同人不同的浪  ,   对人为干扰的画法进行了排除,在严格分析进场起到了关键的作用 . 使用这个指标,等于将交易界面提升美感,抛弃最原始的K线交易带你进入新的交易层次.如果不是为了交易,在宣传上也将使客户观感提升层次. 指标内容: 1. 基础波浪 (笔) : 首先我们找出了价格波动过程中的基础波动拐点,当然他的有序性还不算太强,为下一步的计算提供基础. 2. 二级波段( 段 ) :在基础波浪的基础上,通过算法分析得到层级更明显的二级波段,二级波段为波浪提供了分析基础 3. 波浪( 浪 ): 有着更清晰的趋势,更清晰直观的方向.分析一个波浪是否延续,需要看二级波段的形态,分
This is an arrow indicator without a future function,developed based on the most advanced profit trading algorithms.It has the most innovative and advanced dual trend analysis module, as well as the latest and highly effective market trend prediction algorithm.Trends are your friends, and following larger trends can earn the maximum profit in foreign exchange. This indicator helps traders identify current trends and track them. Someone once made a profit of 10 times in a week by relying on it.No
Swing High Low Fibonacci
Frank Wesley Iii Mccallister
This indicator identifies the major and minor swing high and low points on a chart. It then takes the most recent swing and draws a fibonacci pattern of retracement and extension levels to give you an idea of where price may move next. It allow allows you to set a pair of moving averages to help identify the direction of the overall trend. There are configuration parameters for the major and minor swing and the moving averages.
Auto Levels
Yaroslav Varankin
Auto Level this tool is able to determine the levels of support and resistance. search and display when the price has broken through the level and when it pushed off from it. the indicator can be useful if you use resistance support levels in your trading. or the highs and lows of the price, then it will greatly simplify your work and help you more quickly and more accurately determine the rebound or breakdown of the current trend or tendencies level. blue line bottom uptrend red line on top dow
MIDAS Trading Tools
Carl Gustav Johan Ekstrom
4.67 (15)
The introduction of the MIDAS Trading Tools indicator represents the culmination of my trading expertise and innovative application. By incorporating new concepts and collaborating with fellow traders like Robert Young (US), we have enriched and enhanced this indicator. In the sections below, you'll find detailed descriptions of the variables comprising this indicator. MIDAS which is an acronym for Market Interpretation/Data Analysis System is the innovative work of the late technical analyst P
PZ Penta O MT4
PZ TRADING SLU
The Penta-O is a 6-point retracement harmonacci pattern which usually precedes big market movements. Penta-O patterns can expand and repaint quite a bit. To make things easier this indicator implements a twist: it waits for a donchian breakout in the right direction before signaling the trade. The end result is an otherwise repainting indicator with a very reliable trading signal. The donchian breakout period is entered as an input. [ Installation Guide | Update Guide | Troubleshooting | FAQ | A
PZ Trend Trading
PZ TRADING SLU
4.8 (5)
许多盈利交易者不仅知道如何识别市场趋势,而且也能把握趋势建立后的交易机会。 Pz 趋势交易 指标设计用来在趋势行情中尽可能的赚取利润。 已建立的趋势提供了一揽子交易机会,但大多数趋势交易指标完全忽视了它们,让交易者在趋势行情时完全不知道该如何做!一般趋势指标只通知有关的趋势变化,但根本不足以得到卓越的回报. Pz 趋势交易 指标比一般趋势指标显示多达 20 倍的交易 , 因为它注重所谓的市场时机。它不仅显示当前的市场趋势,也有回调,内柱线的突破和调整。它令您在趋势回调之后介入,安全的柱线内突破金字塔加仓,以及发现潜在的反转,和已知的调整。 趋势改变 一个趋势改变在市场方向变化时发生。趋势变化在图表上用带数字的彩色圆圈显示。蓝色 (1) 信号为上涨开始, 而红色 (1) 信号为下跌开始。趋势变化并非评估当前价格动作的结果, 它意味着交易设置是不定时地。如果您正确使用本指标, 在趋势变化时, 您将将已经入场 (参看下面的调整)。 回调 但凡趋势在运动中,行情上下抖动,盈利者收割利润,且其它参与者入场。趋势回调代表好的买入机会,通常是由主力获利离场导致。如果行情在回调后回归上行, 指
该产品的买家也购买
Apollo Pips PLUS SP
Oleg Rodin
5 (3)
请在购买产品之前阅读下面的信息! Apollo Pips PLUS SP 是一款独特的产品!它适合那些想要获得我的新“APOLLO PIPS”指标以及“超级包”奖金以及访问我所有交易指标的人! 通过购买 Apollo Pips PLUS SP 产品,您实际上购买的是全新版本的 Apollo Pips 指标。此版本的指标具有改进的算法和易于使用的参数,使您有机会在任何市场和任何交易风格中使用该指标。 该产品的购买者还可以免费访问我的所有其他指标,作为我的超级奖励!如果您想获得我所有的交易工具,那么该产品非常适合您!:) 但这还不是全部!:) 该产品的所有购买者也有资格免费获得我的新指标!:) 如果我有一个新的交易指标可用,您将能够在我的特权“SUPER PACK”终身奖金计划中完全免费获得它! 购买后请联系我以获得我的交易提示和超级礼包奖金!
Gold Channel XAUUSD
Paulo Rocha
5 (2)
Gold Channel is a volatility-based indicator, developed with a specific timing algorithm for the XAUUSD pair, which consists of finding possible corrections in the market. This indicator shows two outer lines, an inner line (retracement line) and an arrow sign, where the theory of the channel is to help identify overbought and oversold conditions in the market. The market price will generally fall between the boundaries of the channel. If prices touch or move outside the channel it is a tra
PZ Day Trading
PZ TRADING SLU
3.67 (3)
该指标仅使用价格行为分析和donchian渠道以锯齿形检测价格反转。它是专门为短期交易而设计的,根本不需要重新粉刷或补漆。对于精明的交易者来说,这是一个绝佳的工具,旨在增加他们的运作时间。 [ 安装指南 | 更新指南 | 故障排除 | 常见问题 | 所有产品 ] 极易交易 它在每个时间段都提供价值 实施自我分析统计 它实现了电子邮件/声音/视觉警报 基于可变长度的突破和拥挤区域,该指标仅使用价格行为来选择交易并对市场快速做出反应。 显示过去信号的潜在利润 该指标分析其自身的质量和性能 突围的损失突出显示并解决 该指标是不可重涂和不可重涂的 该指标将帮助盘中交易者不要错过单个价格反转。但是,并非所有价格反转都是一样的,也不是具有相同的可行质量。决定要突破哪些突破而忽略哪些取决于交易者的良好判断。 如何解释统计数据 该指标研究其自身信号的质量,并在图表上绘制相关信息。将分析每笔交易,并在图表的左上角显示总体历史结果,这使您可以针对任何给定的工具和时间范围自行优化指标参数。每个乐器和时间表都有其自己的最佳设置,您可以自己找到它们。 最大优惠交易:对于任何给定的交易,MFE都是
Enigmera
Ivan Stefanov
5 (4)
ENIGMERA:市场核心 https://www.enigmera.com 简介 该指标和交易系统是金融市场的一种非凡方法。ENIGMERA 利用分形周期精确计算支撑位和阻力位。它能显示真实的累积阶段,并给出方向和目标。 该系统无论在趋势中还是在修正中都能发挥作用。 它是如何运行的? ENIGMERA 由三条线组成:支撑/阻力线、目标线和偏离线。与一般市场指标将过去的数据推断为现在和未来的情况不同,该系统能提供当前的完整情况。如果你处于支撑位,这意味着真正的支撑;如果你处于阻力位,这意味着真正的阻力。如果突破某一水平,则表示趋势发生变化。没有重绘。 由于市场在不断变化,ENIGMERA 不断调整其评估工具,定期修改策略。  这保证了每种情况都能得到全面评估。这一市场指标的独特性显而易见,其能力不言而喻。  ENIGMERA 为金融分析师和咨询师提供服务,他们需要可靠的见解与客户分享,也为投资者提供服务,他们需要最精确和最可靠的保证。 该系统能够达到最佳精度,使交易者能够自信、清晰地评估他们的选择。 ENIGMERA 将 20 年的交易专长和知识整合到一个综合软件
TPSpro RFI Levels
Roman Podpora
4.83 (24)
Connect Indicator
Sukunthakan Ngernbamrung
Connect Indicator is a tool used for connecting indicators between the MQL market and MT4. The connected indicators are made by our group and can be used for other applications, such as sending messages to the Line application or Telegram application. If you have any questions, please don't hesitate to ask us to receive support. Function and indicator buffer Buffer one is the high price of the previous candle. Buffer two is the high price of the previous candle. Usage To connect indicators to fu
Indicator : RealValueIndicator Description : RealValueIndicator is a powerful tool designed specifically for trading on the EURUSD pair. This indicator analyzes all EUR and USD pairs, calculates their real currency strength values, and displays them as a single realistic value to give you a head start on price. This indicator will tell you moves before they happen if you use it right. RealValueIndicator allows you to get a quick and accurate overview of the EURUSD currency pair tops and bottoms,
Pair Trading Station MT4
Young Ho Seo
3.67 (3)
How to use Pair Trading Station Pair Trading Station is recommended for H1 time frame and you can use it for any currency pairs. To generate buy and sell signal, follow few steps below to apply Pair Trading Station to your MetaTrader terminal. When you load Pair Trading Station on your chart, Pair Trading station will assess available historical data in your MetaTrader platforms for each currency pair. On your chart, the amount of historical data available will be displayed for each currency pai
PZ Mean Reversion MT4
PZ TRADING SLU
2.33 (3)
采用专业和量化方法进行均值回归交易的独特指标。它利用了价格以可预测和可衡量的方式转移并返回均值这一事实,这允许明确的进入和退出规则大大优于非量化交易策略。 [ Installation Guide | Update Guide | Troubleshooting | FAQ | All Products ] 清晰的交易信号 非常容易交易 可定制的颜色和尺寸 实现性能统计 优于大多数交易策略 显示合适的止损和止盈水平 它实现了电子邮件/声音/视觉警报 这个怎么运作 该指标从更高的时间范围测量完全可定制的移动平均线的标准偏差,并使用趋势跟踪方法精确地找到交易。交易是通过深入当前图表的价格行为发现的,并在价格返回到平均价格区间时关闭,根据您选择的更高时间范围计算。由于其编码方式,该指标将远离高波动性和强劲趋势市场,并且仅在可预测的情况下进行交易,在可接受的波动性与方向性比率范围内,回归均值是可行的。 指标剖析 绿线是更高时间范围内的移动平均线(也就是平均值) 虚线区域是移动平均线周围的典型价格区间 蓝线是看涨交易的突破价格 红线是看跌交易的突破价格 交易是针对均值进行的,并在
ECM Channel MT4
Paulo Rocha
5 (1)
ECM Elite Channel is a volatility-based indicator, developed with a specific time algorithm, which consists of finding possible corrections in the market. This indicator shows two outer lines, an inner line (retracement line) and an arrow sign, where the channel theory is to help identify overbought and oversold conditions in the market. The market price will generally fall between the boundaries of the channel. If prices touch or move outside the channel, it's a trading opportunity. The
TrendMaestro
Stefano Frisetti
5 (3)
note: this indicator is for METATRADER4, if you want the version for METATRADER5 this is the link:  https://www.mql5.com/it/market/product/108106 TRENDMAESTRO ver 2.4 TRENDMAESTRO recognizes a new TREND in the bud, he never makes mistakes. The certainty of identifying a new TREND is priceless. DESCRIPTION TRENDMAESTRO identifies a new TREND in the bud, this indicator examines the volatility, volumes and momentum to identify the moment in which there is an explosion of one or more of these data a
Gann Greed Don Hall
Kirill Borovskii
This product is based on the methodologies of Gann, his follower Don E. Hall. The Indicator builds a working view grid, which is used to analyze graphics. The Pyrapoint tool, developed by Don Hall, is a grid based on the Pythagorean cube. In his calculations he uses the Gann Square 9 methodology and the relationship between Price and Time. This tool is used to predict changes in trend and overall market actions. More information about the method   HERE
Dragon Multi Indicator MT4
Mansour Babasafary
5 (4)
3 Indicators in 1 indicator Strategy based on price action Made specifically for the best forex currency pairs Can be used in the best time frame of the market at a very reasonable price This indicator is basically 3 different indicatos . But we have combined these 3 indicators in 1 indicator so that you can use 3 indicators at the lowest price. All three strategies are based on price action. But based on different trends. Long term, medium term and short term Attributes : No repaintin
Max Paynex
Abdulkarim Karazon
Max Payne 是一个反转/趋势信号指标,以箭头的形式给出信号,该指标在同一柱收盘时给出信号,该指标可以在图表上以不同周期多次下降,以获得信号的双重/三重确认 该指标具有高度可调性,可以适应任何交易风格,同时它不会重新绘制或背面绘制,购买后您将获得屏幕截图中显示的完整系统以及使用的模板。 ----------------- 如何交易: 等到您在同一柱上获得三次确认,同时趋势过滤器(购买后您将获得的佩恩趋势)与方向一致 开仓并将止损设置为买入交易的黄金箭头(模板)下方和卖出交易的黄金箭头(模板)上方,您的退出信号是第一个相反的白点信号(模板)。 ----------------- 参数 : 信号周期:箭头周期 滤波器:信号滤波器 距离:箭头距蜡烛的距离 计数柱:显示多少历史信号 警报 --------------------------------------
Market Swing Index MSI
Elias Mtwenge
5 (1)
JULY OFFER 80% OFF next price for unlimited version will be 17000$. This is the only time you can get this institutional and professional indicator at this price for unlimited version. Don't dare to miss this. The tool I am about to introduce to you you can't compare it with other tools due to its strategy and accuracy level in predicting the next price directional movement . This tool is designed for serious traders who have decided to make a difference through trading. Be the next person to wi
Swing Master Indicator
Elias Mtwenge
5 (1)
Dear Traders this is my another tool called " Swing Master Indicator ". As the name above the indicator is designed to help you in swing trading by capturing the low and highs of the price. You may us this tool with any trading strategy and style from scalping to position trading. It is made for level of traders including newbies and advanced traders even prop-firms, hedge funds and banks to help them make sold market analysis. I create tools for serious traders who want to make a difference in
The indicator " ZigZag on Trend " is an assistant in determining the direction of price movement, as well as a calculator of bars and points. It consists of a trend indicator, which follows the price direction by the trend line presented in the form of a zigzag and a counter calculating the number of bars traversed in the direction of the trend and the number of points on the vertical scale. (calculations are carried out by the opening of the bar) The indicator does not redraw. For convenience,
ON Trade Optuma Astro
Abdullah Alrai
5 (4)
当然可以!以下是您提供的文本的中文翻译: 引入 MT4 天文指标:您的终极天体交易伙伴 您准备好将交易体验提升到天文高度了吗?不用再寻找,就在我们的革命性 MT4 天文指标中。这个创新工具超越了传统的交易指标,利用复杂的算法提供无与伦比的天文洞察力和精确计算。 指尖上的宇宙信息: 瞻仰一个详尽的面板,展示了一宝藏般的天文数据。了解行星的地理/太阳心坐标,太阳/地球距离,亮度,伸长度,星座,黄道和赤道坐标,甚至是水平坐标——每个细节都经过精心计算并呈现得美轮美奂。指标生成的垂直线对应于时间值,为您的交易旅程提供了宇宙的视角。 行星线条与关系: 在您的图表上欣赏行星线条的魔力,具有可自定义的比例和角度。通过直观的控制面板轻松切换每个行星线条的可见性。通过连结、六分、四分、三分、对冲和逆行等指标,发现行星关系的艺术。在您选择的时间范围内探索这些宇宙构造,使您能够识别重要的交易机会。 揭示甘恩的智慧: 通过受甘恩启发的平方垂直线揭示潜在的反转时机。这种创新修改将甘恩历经考验的原则带入现实,帮助您提前了解市场的转向和趋势。 月亮引导: 在您的图表上优雅地导航月相,因为新月和满月点缀其间。月亮周期
SMT Divergences MT4
Diego Arribas Lopez
5 (2)
MT5 Version SMT Divergences MT4 SMT Divergences is one of the most innovative indicators in the market. It offers the possibility of analyzing price divergences between 2 pairs. These divergences highlight and help to foresee what banks and institutions are planning to do. SMT divergences also provides you with a kill zones indicator and the possibility of filtering divergences occurring during these kill zones.  The strategy tester is limited in MT4. Contact the author to get your Demo Version
Bomb Bank Signal
Igor Pereira Calil
炸彈銀行訊號:您對 MetaTrader 4 的信心指標 Bomb Bank Signal 是 MetaTrader 4 的一個強大指標,旨在識別金融市場中最相關的趨勢。如果您正在尋找一種能夠準確預測運動的工具,那麼炸彈庫就是您需要的盟友。 運作原理: 該指標結合了三種不同的方法——成交量分析、蠟燭收盤價和對稱趨勢——來偵測和發出買賣機會訊號。當炸彈銀行識別出買入機會時,它就像一顆「炸彈」;當它偵測到賣出訊號時,它就像一個「頭骨」。 為什麼炸彈銀行不一樣? 完全可靠性:炸彈庫訊號不會刪除訊號。訊號一旦發出,就會一直存在,確保您不會錯過任何機會。 極為準確:炸彈庫不會發出錯誤訊號。它會即時更新您的訊息,隨著市場的變化進行調整,但保持先前訊號的透明度。 即時更新:訊號被即時識別並在必要時更新,使您能夠快速響應市場變化。 最大化您的結果: 炸彈銀行訊號是識別趨勢持續走勢的理想選擇。例如,如果您已經做空並且指標在 M15 發出買入訊號,那麼現在就是平倉或部分下單的最佳時機,反之亦然。 此外,經過仔細分析,我們建議您遵循M30、H1和H4上的訊號,停損僅50點。這使
Contact us to receive a comprehensive user guide after purchasing. William Delbert Gann, commonly known as W.D. Gann, was an exceptional market analyst renowned for his unique trading style in the early 20th century.  His trading techniques were based on a blend of mathematics, geometry, astrology, and ancient mathematics. Gann believed that stock market movements followed specific patterns and cycles, rather than being random. His methodologies, celebrated for their accuracy and relevance, con
NOTE: PRICE WILL RISE VERY SOON. DON'T SKIP THIS OFFER! Dear traders I am glad to introduce the " Market Swing Scanner Board" indicator to you. This indicator was made mainly to be used in combination with the Market Swing Index Indicator. You use the  "Market Swing Scanner Board"  indicator to scan for trading opportunities on the  Market Swing Index Indicator . This tool is designed for serious traders who have decided to make a difference through trading. Be the next person to witness this st
Gann Swing Structure
Kirill Borovskii
5 (1)
This indicator is based on the mathematics of the great trader W.D. Ganna. With its help, you can easily find strong levels by analyzing swings to find the optimal entry point. The indicator works on all instruments and all timeframes. The indicator is fully manual and has control buttons. All you need to do is press the NEW button, a segment will appear, which you can place on any movement, swing or even 1 candle that you want to analyze. By placing the segment, press the OK button. A grid (th
The indicator of a Professional Trader is an arrow indicator for predicting the direction of price movement. I have been working on this indicator since 2014. You can use this indicator as your main indicator, use its entry signals, and use it as your only indicator to find entry points. About the product: Recommended TF [H4-D1-W1]   . The indicator predicts the direction of the next candle. Fits a variety of tools; Flexibility in settings for different instruments and intervals through the
这是最赚钱的指标。它的表现非常出色。无论市场上有什么兴趣,你都能看到。 几乎在所有情况下,它都只会给你一个长期的市场观点,但不要被愚弄,以为它是受事件约束的。不是这样的。它能找到市场上最大的利益所在,并将其展示给你。别忘了,最大的资金(利益)每天都不会在市场上出现。这是您没有遇到过的情况。月租金可能会给您一到两个信号,仅此而已。但当我们谈论大资金时,他们就是这样行事的。 如果您想了解更多,请点击这里。 这是最赚钱的指标。它的表现非常出色。无论市场上有什么兴趣,你都能看到。 几乎在所有情况下,它都只会给你一个长期的市场观点,但不要被愚弄,以为它是受事件约束的。不是这样的。它能找到市场上最大的利益所在,并将其展示给你。别忘了,最大的资金(利益)每天都不会在市场上出现。这是您没有遇到过的情况。月租金可能会给您一到两个信号,仅此而已。但当我们谈论大资金时,他们就是这样行事的。 如果您想了解更多,请点击这里。
The Th3Eng Ninja indicator is based on an analysis of the right trend direction with perfect custom algorithms. It show the true direction and the best point of the trend. With Stop Loss point and Three Take Profit points. Also it provides a secondary entry points in dots arrows style. And Finally it draws a very helpful lines from entry level to TP1, TP2, TP3, SL levels or the reverse signal, and all current/old signals status. How to use the indicator No complicated steps ,   Just follow 2
Please send me Direct message on MQL5 CHAT after purchasing the Indicator for Training and Installation Support There are some additional files that is important to use with the Indicator . So be sure to contact me after purchasing the Indicator So that I can add you for training and support . If you find any difficulty with installation then send me Direct message here So that I can connect with you via Anydesk or Teamview for the product installation. " Smart Order Block Indicator " to find
Max Min Cycle
Vitalyi Belyh
Cyclical indicator for trading and predicting the direction of the market. Shows the cyclical behavior of the price in the form of an oscillator. Gives signals for opening deals when rebounding from the upper and lower boundaries of the oscillator. In the form of a histogram, it shows the smoothed strength of the trend. Will complement any trading strategy, from scalping to intraday. The indicator does not redraw. Suitable for use on all symbols/instruments. Suitable time frames for short-term
Full Forex Market View Dashboard
Opengates Success International
5 (2)
完整的外汇市场视图仪表板指示器 这是一个自定义指标,旨在让交易者全面了解市场上正在发生的事情。 它使用实时数据访问市场并显示成功交易所需的每一点信息。 安装: 在将此指标附加到您的窗口图表之前,请转到您的 MT4 的市场观察面板并隐藏所有您不需要或交易的货币对,并将其余货币对留在那里。 原因是 FFMV 仪表板将显示出现在 MT4 市场观察中的所有货币对。 它最多可以显示 30 个或更少的货币对。 如果它超过您 MT4 的市场观察中的那个,它会模糊和毁坏 FFMV 仪表盘上的字体和图像! 它不会正确显示。 用法:      单人交易      对于篮子交易(见截图如何)      也可用于多单交易      确认从您自己的交易系统等收到的信号的有效性。 成分:      时间范围:从 M1 到 MN1 当前蜡烛状态(买入/卖出      趋势:币种整体走势      影响:货币变动的幅度/波动性,见下文:      建立:货币正在建立      好:货币越来越严重      高:币值值得关注      强:要考虑方向  
Gann Signal
Kirill Borovskii
Gann Signal is a very simple indicator at first glance, but hidden inside is many years of experience in studying W.D.Ganna methods. The indicator gives accurate BUY/SELL signals, without redrawing. The indicator is very easy to use. All you need to do is attach it to your chart and follow its recommendations. The indicator constantly analyzes the market for entry opportunities. When such an opportunity appears, the indicator gives a signal in the form of an arrow. I repeat, all signals are NOT
作者的更多信息
ON Trade Optuma Astro
Abdullah Alrai
5 (4)
当然可以!以下是您提供的文本的中文翻译: 引入 MT4 天文指标:您的终极天体交易伙伴 您准备好将交易体验提升到天文高度了吗?不用再寻找,就在我们的革命性 MT4 天文指标中。这个创新工具超越了传统的交易指标,利用复杂的算法提供无与伦比的天文洞察力和精确计算。 指尖上的宇宙信息: 瞻仰一个详尽的面板,展示了一宝藏般的天文数据。了解行星的地理/太阳心坐标,太阳/地球距离,亮度,伸长度,星座,黄道和赤道坐标,甚至是水平坐标——每个细节都经过精心计算并呈现得美轮美奂。指标生成的垂直线对应于时间值,为您的交易旅程提供了宇宙的视角。 行星线条与关系: 在您的图表上欣赏行星线条的魔力,具有可自定义的比例和角度。通过直观的控制面板轻松切换每个行星线条的可见性。通过连结、六分、四分、三分、对冲和逆行等指标,发现行星关系的艺术。在您选择的时间范围内探索这些宇宙构造,使您能够识别重要的交易机会。 揭示甘恩的智慧: 通过受甘恩启发的平方垂直线揭示潜在的反转时机。这种创新修改将甘恩历经考验的原则带入现实,帮助您提前了解市场的转向和趋势。 月亮引导: 在您的图表上优雅地导航月相,因为新月和满月点缀其间。月亮周期
Gann 方块指标是一种强大的市场分析工具,基于 W.D. Gann 在其“市场预测数学公式”一文中介绍的数学概念。该指标融合了与平方数(如 144、90 和 52)有关的 Gann 技术,以及平方 9。此外,它还融入了  关于如何将平方 9 与通道和星形图案结合使用的方法。 用户手册和使用方式: 在使用该指标之前,我们建议您阅读用户手册,并与我们联系以获得任何澄清。您可以在我们的网站上找到完整的用户手册。 该指标提供了 MT5 的完整版本供购买,也提供了 MT4 的免费版本供测试。提供了两个版本的链接供您方便使用。 主要特点和功能: Gann 方块指标为您的交易环境提供了全套工具,使您能够基于几何图案和 Gann 的概念做出明智的决策。以下是主要特点: 平方 9 分析: 该指标可以绘制与平方 9 有关的各种元素,包括水平线、星形图案、网格、Gann 扇形等。这在您的图表上提供了 Gann 的几何概念的视觉表示。 Gann 方块: 该指标绘制了 Gann 方块 52、90 和 144,使您能够可视化和分析它们与价格走势的关系。 自由 Gann 星形图案: 该指标使您能够直接在图表上绘制
Shepherd Harmonic Pattern
Abdullah Alrai
4.68 (59)
这个指标将检测手动和自动方法在图表上绘制的谐波模式。 您可以从此链接查看用户手册: 添加您的评论并联系我们以获得它 有一个免费版本可以在mt4上尝试此产品。 您可以使用它来检测Gartley和Nenstar模式: https://www.mql5.com/en/market/product/30181 您可以从以下链接购买完整的MT4版本: https://www.mql5.com/en/market/product/15212 注意 指标具有控制面板,并将保存每个(图表和时间框架)设置。 您可以将其最小化以在图表上获得更多空间,并且如果您更喜欢使用其他分析工具,则可以按关闭按钮隐藏所有指标数据 当您使用此指标并更改设置,添加诸如移动平均线或布林带之类的指标时,此指标将自动保存您的模板编辑,并且您可以随时加载它们。 如果您使用的是Windows 10,请右键单击MetaTrader图标>兼容性>更改高DPI设置>系统(增强)以获得最佳屏幕设置(应在高清设备中完成)。 指标只是谐波交易理论的解释,用于检测图表上的谐波模式。 如果您想学习它,可以搜索Scott Carney的书,名为“Ha
该指标旨在与艾略特波浪理论相结合,提供了两种不同的工作方式: 自动工作: 在此模式下,指标会自动检测图表上的所有五个动机波浪,并为您提供预测和潜在的逆转区域。它还可以提供警报和推送消息。这种自动功能简化了识别和分析艾略特波浪模式的过程。 手动工作: 此选项适用于喜欢手动方法的交易员,用于手动绘制九个不同等级的波浪。每个等级都可以在它们出现后通过调整图表上的绘制线条来单独定义。此功能简化了手动绘制波浪的过程,使其更加高效。需要注意的是,所有绘图数据将保存在平台的数据文件夹中,以备将来参考。 参数: Name: 指标名称。 Use_System_Visuals: 启用或禁用指标主题,以匹配交易平台的整体外观。 Explain_Comment: 允许启用或禁用波浪编号的解释性注释,有助于理解已识别的波浪。 Show_Last_Candle_Counter: 启用或禁用蜡烛计时器,提供有关当前蜡烛收盘的剩余时间的信息。 Candle_Counter_Color: 蜡烛计时器文本的颜色。 Basic_Wave_Color: 用于表示波浪的主要颜色。 Bullish_Wave_Color: 当检测
This indicator has a lot of numerology analyzing methods that can support your analyzes or can work as custom strategy by it self ..we will start to explain them one by one :  this the trial version of this product to have this product here is the link : https://www.mql5.com/en/market/product/118782   1- Range channel that draws the limits of daily movements to detect places of buy and places of sell . 2- Angler will detect Dynamic numeral levels that result of time and price squaring with cus
FREE
ON Trade Manager
Abdullah Alrai
5 (1)
該產品可讓您控制您的訂單和帳戶,具有許多功能 1- 它將根據您的帳戶大小/停損大小/1 手數的對點值計算正確的手數。 2-它將為您提供當前訂單情況,具體取決於線路位置(目標 sl tp )。 3-按下 1 個按鈕即可移動所有訂單 target / sl 。 4-它將為您提供有關您的帳戶的資訊以及開立訂單所需的保證金。 5-它具有關閉所有訂單(符號或全部)的功能。 6-具有保本、保利功能。 7- 所有配對都易於使用。 請不要忘記添加您的評論 該產品可讓您控制您的訂單和帳戶,具有許多功能 1- 它將根據您的帳戶大小/停損大小/1 手數的對點值計算正確的手數。 2-它將為您提供當前訂單情況,具體取決於線路位置(目標 sl tp )。 3-按下 1 個按鈕即可移動所有訂單 target / sl 。 4-它將為您提供有關您的帳戶的資訊以及開立訂單所需的保證金。 5-它具有關閉所有訂單(符號或全部)的功能。 6-具有保本、保利功能。 7- 所有配對都易於使用。 請不要忘記添加您的評論
FREE
Shepherd Gann Squares Free
Abdullah Alrai
4.86 (37)
該指標是一種市場分析方法,基於 W.D. Gann 撰寫的“市場預測的數學公式”文章,根據 9 的平方和 144 的平方方法。 用戶手冊: Add Your review And contact us to get it 您可以從以下位置購買完整的 MT5 版本: https://www.mql5.com/en/market/product/28669 您可以免費在 MT4 上進行測試: https://www.mql5.com/en/market/product/15316 本產品可以為您繪製 9 的正方形作為級別 / 星星 / 網格 / 江恩迷 / 。 它還將繪製江恩平方:52 / 90 /144。 它將直接在圖表上繪製可移動的自由江恩星。 它也將繪製江恩菱形。 它有很多計算器,讓您能夠為您的條目計算最佳手數。 指標有一個面板,它允許您: 在 144/90/52 方格/9 方格/江恩自由星/江恩鑽石/命理工具/手數計算器和帳戶信息之間移動。 指標將保存您在配置文件上的所有工作,您可以隨時加載和卸載它。 您可以在按下按鈕時
FREE
Shepherd Harmonic Patterns Free
Abdullah Alrai
4.73 (26)
This indicator will detect harmonic patterns that are drawn on the chart by manual and automatic methods. You can see user manual from this link: https://www.mql5.com/en/blogs/post/719257 There is a free version (it detect only Gartley and Nenstar Patterns) to try this product. You can buy the full MT4 version from: https://www.mql5.com/en/market/product/104689 Notes When you use this indicator and change the settings, add indicators like Moving Average or Bollinger Bands, this indicator will
FREE
金克拉价格计算器指标介绍 您是否有兴趣随时了解黄金在您的本地货币中的价格?不用再寻找了,金克拉价格计算器指标为您提供了实时计算每克黄金价格的创新工具,以您喜欢的本地货币来计算。借助此指标,您可以利用金融洞察力做出明智的决策。 主要特点: 本地化的黄金价格: 金克拉价格计算器指标为您提供金属每克价格,特别是黄金每克价格,以您熟悉的本地货币进行定制。这意味着您可以方便地在与您相关的货币中跟踪黄金的价值。 用户友好的设置: 我们的指标旨在为您的方便而设计。您可以从指标设置中直接调整设置,或者直接在主要图表上进行调整,实现无缝和个性化的体验。 参数解释: Use_System_Theme (使用系统主题): 有了选择您喜欢的颜色方案的选项,您可以轻松将指标的视觉外观与您的交易环境相结合。 Ounce_Value (盎司价值): 此参数指的是您本地货币中一盎司黄金的国家价值。它是后续计算的基本组成部分。 Reference_Carat (参考克拉): 参考克拉表示基于其进行的计算。这使您可以将计算与您感兴趣的特定类型的黄金对齐。 Calculated_Carat (计算克拉): 此参数基于参考克
FREE
ON Trade Pivots
Abdullah Alrai
ON Trade Pivots is A technical indicator that Draws all Pivot levels depending on time frame that defined in settings. Notes It will be good tool for all traders who use pivot levels in their trades. Let me inform you that this indicator draw this level as buffers not as objects then you can connect it easily to EA. This indicator allow you to find pivots levels for any time frame not only daily you are free to choose time frame from settings. Parameters Use_System_Visuals - Enable /Disable
FREE
该指标的目的在于在您的交易图表上可视化表示唐奇安通道。唐奇安通道是一种直观的技术工具,用于描述特定时期内的最高高点和最低低点之间的范围。此指标增强了价格运动的视觉分析,为潜在的突破和趋势延续点提供了洞察力。唐奇安通道可以应用于当前时间框架和更高的时间框架,如果您选择启用该选项的话。 指标的主要特点: Use_System_Visuals:此参数允许您在使用系统视觉样式和自定义指标外观之间进行切换。当激活时,指标的视觉元素将与您的交易平台整体主题相匹配。 Signal_from_HT_Timeframe:启用此选项允许您从更高的时间框架接收信号。换句话说,您可以考虑在更长的时间框架上观察唐奇安通道的行为,以影响您在当前时间框架上的交易决策。 HT_Timeframe:当激活Signal_from_HT_Timeframe时,此参数允许您选择更高的时间框架,从中您希望接收信号。比较唐奇安通道在不同时间框架上的行为可以为交易决策提供有价值的背景。 Period:此参数定义计算唐奇安通道的时期。它确定用于建立通道上限和下限的条形或蜡烛数量。 Down_Side和Up_Side:这些参数允许您为
FREE
该指标提供了一种基于'回归通道工具'概念的强大市场分析方法。通过利用此工具,交易员可以在图表上对回归通道获得出色的控制,从而使他们能够做出更明智的交易决策。 '回归通道工具'是交易员工具箱中的一个强大工具。它旨在为价格趋势和潜在支撑和阻力水平提供有价值的见解。该工具特别适用于在趋势内部可视化修正波动,提供了对价格动态的综合视图。 以下是更详细地了解使用此指标的关键功能和优势: 通道水平和支撑/阻力: 该指标的主要优势之一是其能够生成作为动态支撑和阻力区域的通道水平。这些水平在确定潜在的入场和出场点方面至关重要,增强了交易策略的精确性。 修正波动水平: 通过启用修正波动水平,交易员可以在更大的趋势内识别潜在的修正。这个功能有助于识别回撤,并帮助交易员利用有利的价格波动。 直接控制: 该指标的控制面板允许无缝地操纵回归通道。交易员可以微调填充和射线选项等设置,提供符合其分析风格的通道定制视图。 更高时间框架分析: 为了获得更广泛的视角,该指标具有从更高时间框架加载数据的功能。这个功能可以帮助交易员评估不同时间尺度上的趋势和通道,促进对市场动态的更全面了解。 如何使用: 设置趋势线: 首先,
介绍我们强大的外汇指标,旨在增强您的交易策略并为您提供对市场趋势的准确洞察。这款先进的工具采用了复杂的定制算法,精确分析蜡烛测量数据,通过调整以获得最佳精度。结果是一组精确绘制在您的图表上的箭头,指示战略进场点。 这款指标的精髓在于它能够利用蜡烛图案的力量,并将其与精心校准的调整相结合。通过这样做,它为市场的动态提供了独特的视角,为您的交易决策提供了优势。 这款指标的一个突出特点是其在H1时间框架上的出色表现。专门在此时间框架上交易的交易者会发现它提供了多个准确的入场机会。然而,我们相信协同效应的力量。虽然此指标是一个强大的独立工具,但当它与更广泛的交易策略结合使用时,其表现会更上一层楼。通过将其与您现有的方法相结合,您可以释放其全部潜力,并加强您的交易结果。 让我们更详细地看看让您控制交易体验的参数: 使用系统主题: 您的交易环境在您的关注度方面起到作用。选择与您共鸣的图表主题,为您创造一个舒适且视觉吸引力的工作环境。 使用通知: 即使您没有积极监视图表,也能保持信息更新。启用此功能,可以将通知直接发送到您的设备,及时向您传达市场的重要发展。 使用警报: 在交易中,时机至关重要。通过
"该指标基于Bystra模式理论检测入场点,并提供放置限价单的入场值,带有目标和止损水平。这使您能够计算您的风险百分比。 注意事项: 该指标具有允许在专家顾问(EAs)中使用的缓冲区。 在使用此产品时,务必进行良好的资金管理。 当您更改时间框架时, 指标将保存在上次会话中使用的模板。 如果您需要一本书来学习这种方法,请在购买后与我们联系并分享您的评论。 参数: 使用系统视觉效果 - 启用/禁用此产品的视觉主题。 相对速度 - 启用/禁用仅在最后一波的快速运动中检测模式。 显示最后一根蜡烛计时器 - 启用/禁用蜡烛计时器。 蜡烛计时器颜色 - 蜡烛计时器文本的颜色。 多头模式颜色 - 多头模式的颜色。 空头模式颜色 - 空头模式的颜色。 发送警报 - 启用/禁用警报。 发送通知 - 启用/禁用移动平台的推送通知。 发送电子邮件 - 启用/禁用电子邮件警报。 显示目标 - 启用/禁用在图表上显示目标。 历史条数 - 最大历史条数。" 如果您有更多问题或需要进一步帮助,请随时问我!
Fibo Star指标旨在在交易图表上以星形图案绘制斐波那契扇形。 这些斐波那契扇形是用于分析价格走势的有力工具,可以提供有关潜在支撑和阻力水平的见解。此指标配备了一个用户友好的控制面板,旨在简化绘制和配置扇形的过程,从而节省时间和精力。 使用说明: 此指标仅适用于手动使用。为了有效地使用它,请按照以下步骤操作: 辨认出您希望基于其绘制斐波那契扇形的高点和低点。 将紫色线放在这些高点和低点上。 一旦价格与这些线条交互,观察指标如何作为动态支撑和阻力水平运作。 参数: Use_System_Theme: 此参数允许您选择首选主题,以使指标的外观与您交易平台的整体样式相匹配。 Levels_Color: 选择您要为斐波那契扇形的水平使用的颜色。 Levels_Style: 定义斐波那契扇形水平的样式,根据您的喜好调整外观。 Levels_Width: 调整斐波那契扇形水平的宽度,以增强在图表上的可见性。 Levels_Ray: 启用或禁用从斐波那契扇形水平延伸的射线的显示。 Lvl0 - Lvl8: 为每个水平指定比例值。这些值在确定斐波那契扇形的角度和位置时起着关键作用。 Star_Co
“Currency Strength Indicator” 是一个功能强大的工具,旨在为交易员提供有关外汇市场中各种货币相对强度的信息。通过根据其相应的时间框架计算和绘制每种货币的力度,该指标为交易员提供了识别潜在交易机会的机会,尤其是在观察到显著的背离或交叉时。 指标的关键特点: 1. 货币强度计算: 该指标根据其指定的时间框架计算每种货币的强度。此计算涉及在指定的时间段内对一种货币相对于其他货币篮子的表现进行评估。这有助于交易员了解货币的相对强弱。 2. 收缩和背离: 当两种货币的力度之间出现收缩或背离运动时,这可能表明潜在的交易机会。例如,如果一种货币显著增强,而另一种货币在减弱,这可能表明潜在的入场点。 3. 穿越零水平: 该指标还识别了货币强度穿越零水平的情况。上穿零水平可能表明强势趋势,而下穿零水平可能意味着弱势趋势。这些交叉可以作为交易决策的额外确认。 4. 可自定义的显示: 交易员可以选择在其图表上显示哪些货币强度。该指标允许启用或禁用特定货币的强度显示,如 USD、EUR、GBP、AUD、NZD、JPY、CHF 和 CAD。 5. 强度时间框架: “Strength
用于检测强势价格行动模式的技术指标:Pin Bar、Inside Bar 和 Outside Bar 介绍: 在技术分析领域,价格行动模式是潜在市场走势的重要指标。我们开发了一款先进的技术指标,可以在图表上简化强势价格行动模式的识别。我们的指标专门用于检测三种基本模式:Pin Bar、Inside Bar 和 Outside Bar。 检测到的关键模式: Pin Bar: Pin Bar 模式是单根蜡烛图形成,表示市场趋势可能发生反转。它的特点是小的实体和长的上引线或下引线。看涨的 Pin Bar 表示可能的看涨反转,而看跌的 Pin Bar 暗示看跌反转。 Inside Bar: Inside Bar 模式是指单根蜡烛的整个价格范围都在前一根蜡烛的价格范围之内。该模式表明市场暂时整理或无决策,通常会在两个方向中的一个发生突破之前出现。 Outside Bar: Outside Bar 模式,也称为“吞没”模式,出现在一根蜡烛的范围完全包围前一根蜡烛的范围时。看涨的 Outside Bar 可能预示看涨反转,而看跌的 Outside Bar 可能表明看跌反转。 指标功能: 我们的指标
基于数字学的MetaTrader支持和阻力指标 简介: 通过我们的基于数字学的MetaTrader支持和阻力指标,解锁技术分析的新维度。这个独特的工具利用数字学的力量,在您的图表上识别关键的支持和阻力水平,为您提供有关潜在价格变动的有价值见解。 关键概念: 交易中的数字学: 数字学是对数字及其在我们生活中的意义的神秘研究。将数字学原理应用于交易,涉及到识别具有象征意义的特定数字,并使用它们来预测可能吸引买入或卖出活动的价格水平。 指标功能: 我们的指标利用数字学的隐藏模式,在您的图表上绘制支持和阻力水平。这些水平是从在金融市场中具有显著意义的关键数字中获得的。 学习的首选步骤: 了解数字学:在使用该指标之前,花些时间了解数字学的基础知识及其在交易中的相关性。了解重要数字、它们的含义以及它们与金融市场的关系。 指标安装:首先,在您的MetaTrader平台上安装基于数字学的支持和阻力指标。按照用户指南中提供的安装说明操作。 选择时间框架:打开您喜欢的交易工具的图表,选择您想要分析的时间框架。该指标适用于不同的时间框架,可以用于识别短期和长期交易的数字学水平。 调整指标参数:根据您的交易偏
This indicator will give you entries as result of scalping strategy that will be applied on 14 symbols in same time and you are able to be notified with this entries  Note :   This indicator for scalping on 5 minutes timeframe only . How to use it : 1-Open chart and adjust settings (edit symbols names as your platform names , activate the alert system if you need it . 2-Wait for any signal you have it from this scanner you will have it as alert and as notification and you will see it on bo
This indicator gives you the signal of real cross on stochastic indicator. This indicator is easy to attach to an ea. This indicator will work best on All time frames. Arrow appears depending on many algorithms that study the cross parameters. Indicator properties Use_System_Visuals: enable/disable visual styles. Stochastic_K_Period. Stochastic_D_Period. Stochastic_Slowing. Use_Notifications: enable/disable Push Notifications. Use_Alert: enable/disable Alerts. Use_E_Mail: enable/disable Email
ON Trade VSA
Abdullah Alrai
推出“ON Trade VSA” - 您的终极VSA分析工具! 通过我们的前沿指标“ON Trade VSA”,解锁量价分析(VSA)的强大功能。VSA是交易员用来衡量市场强度、识别趋势并做出明智决策的强大方法。让我们深入了解使“ON Trade VSA”成为您交易武器库中不可或缺的工具的关键功能: 多彩的成交量蜡烛图 :通过我们独特的功能,根据成交量蜡烛的平均移动赋予不同的颜色,您可以洞察市场动态,快速发现市场情绪的变化。 强劲趋势检测 :我们的指标不仅仅停留在基本层面。它准确地识别并绘制图表上的最强趋势,为您提供清晰的市场方向图景。 成交量-区间乘数 :通过绘制成交量乘以区间,揭示隐藏的模式。通过分析成交量与价格范围之间的关系,您将能够了解市场波动性和潜在的突破点。 波动性洞察 :通过我们的波动性趋势线来可视化市场波动性。这些线条帮助您解读市场动态,有助于及时做出交易决策。 行动提醒 :通过实时提醒始终掌握交易动态。“ON Trade VSA”在重要市场事件发生时通知您,确保您不会错过任何交易机会。 通过“ON Trade VSA”提升您的交易策略,体验最佳VSA分析。无论您是经验
This product is a part of  ON Trade Waves Patterns Harmonic Elliot Wolfe you can test free version on EURJPY from this link  Wolf Waves Indicator 探索 Wolf Waves - 您的终极交易工具! 您是否正在寻找一种强大的工具,能够轻松地在任何时间框架上识别 Wolf Waves?不用再找了!我们的 Wolf Waves 指标可以轻松完成这项任务。以下是为您呈现它的理由: 主要特点: 自动检测: 我们的 Wolf Waves 指标使用复杂的算法自动查找关键点并在您的图表上绘制相应的线条。不再需要手动搜索模式。 用户友好: 无论您是专业交易员还是对 Wolf Waves 还不熟悉,我们的指标都非常易于使用。 精准性: 它非常精确,降低了虚假信号的数量,提高了您的信心。 信息丰富: 该指标不仅限于模式检测。它还提供入场点、止损水平和利润目标等重要交易信息,帮助您做出明智的交易决策。 适用于 EA: 如果您进行自动化交易,此指标可以无缝集成
This program serves as an effective tool for sending messages through a Telegram bot using the MetaTrader platform. It enables you to send your trading recommendations related to the orders you open on the trading platform directly to your Telegram channel or group. These messages may include details about open trades and can be accompanied by illustrative images of the orders. Alternatively, they can be configured to be without images based on your preferences. This means that if you are the ow
介绍我们的新指标:[ON Trade Breakout Zone] 对所有交易者而言简单而强大的市场分析工具! 适用于专业人士和初学者 您准备激发您的交易策略吗?我们最新的指标旨在简化市场分析,并赋予各个层次的交易者力量。无论您是经验丰富的专业人士还是初学者,[ON Trade Breakout Zone] 是您解锁市场潜在利润的关键。 如何使用 [ON Trade Breakout Zone]: 每天,这个智能工具都会使用其先进的算法在您的图表上轻松绘制区域。以下是如何充分利用它的方法: 区域识别: [ON Trade Breakout Zone] 准确识别图表上的关键区域,让您轻松发现潜在的交易机会。 交易执行: 等待价格移动到绘制区域的任一侧。 如果价格上涨超过购买线,请考虑输入购买交易,目标设置在上部绘制的水平。 如果价格下跌到卖出线以下,请考虑输入卖出交易,目标设置在下部绘制的水平。 风险管理: 在中心线上设置止损水平,以实现有效的风险管理。 资金管理: 遵循合理的资金管理规则,以优化您的交易策略。 独立使用: ON Trade Breakout Zo
This indicator has a lot of numerology analyzing methods that can support your analyzes or can work as custom strategy by it self ..we will start to explain them one by one :   1- Range   channel that draws the limits of daily movements to detect places of buy and places of sell . 2-   Angler   will detect Dynamic numeral levels that result of time and price squaring with custom numeral method that works like support and resistant and will support your analyzes 3-   Shepherd Levels   it is l
ON Trend
Abdullah Alrai
轻松掌握趋势交易的力量 这个指标专为各个水平的交易者设计——无论您是新手、中级交易者,还是专业人士。它通过精准识别任意货币对的真实趋势,简化了交易过程。 为什么选择这个指标? - 轻松交易:不再需要复杂的分析。只需将指标加载到图表上,等待买入或卖出的信号,无需整天盯盘。 - 清晰的进场信号:指标提供明确的进场点,蓝色箭头表示买入,红橙色箭头表示卖出。此外,趋势线的颜色可视化确认当前市场趋势。 - 理想的时间框架:为了获得最佳效果,建议使用5分钟时间框架。通过在H1时间框架上再次应用指标来确认您的信号,您将获得更精准的数据。 - 配备扫描仪更强大:使用我们内置的扫描仪,轻松识别所有货币对的趋势。只需留下评论,我们会免费将其发送给您。 开始更智能地交易,而不是更辛苦。让这个指标成为您在市场中的向导,帮助您轻松做出自信和及时的决策。
ON Trade Gann Squares MT5
Abdullah Alrai
5 (1)
Gann 方块指标是一种强大的市场分析工具,基于 W.D. Gann 在其“市场预测数学公式”一文中介绍的数学概念。该指标融合了与平方数(如 144、90 和 52)有关的 Gann 技术,以及平方 9。此外,它还融入了  关于如何将平方 9 与通道和星形图案结合使用的方法。 用户手册和使用方式: 在使用该指标之前,我们建议您阅读用户手册,并与我们联系以获得任何澄清。您可以在我们的网站上找到完整的用户手册。 该指标提供了 MT5 的完整版本供购买,也提供了 MT4 的免费版本供测试。提供了两个版本的链接供您方便使用。 主要特点和功能: Gann 方块指标为您的交易环境提供了全套工具,使您能够基于几何图案和 Gann 的概念做出明智的决策。以下是主要特点: 平方 9 分析:   该指标可以绘制与平方 9 有关的各种元素,包括水平线、星形图案、网格、Gann 扇形等。这在您的图表上提供了 Gann 的几何概念的视觉表示。 Gann 方块:   该指标绘制了 Gann 方块 52、90 和 144,使您能够可视化和分析它们与价格走势的关系。 自由 Gann 星形图案:   该指标使您能够直接
该指标提供了一种基于'回归通道工具'概念的强大市场分析方法。通过利用此工具,交易员可以在图表上对回归通道获得出色的控制,从而使他们能够做出更明智的交易决策。 '回归通道工具'是交易员工具箱中的一个强大工具。它旨在为价格趋势和潜在支撑和阻力水平提供有价值的见解。该工具特别适用于在趋势内部可视化修正波动,提供了对价格动态的综合视图。 以下是更详细地了解使用此指标的关键功能和优势: 通道水平和支撑/阻力:   该指标的主要优势之一是其能够生成作为动态支撑和阻力区域的通道水平。这些水平在确定潜在的入场和出场点方面至关重要,增强了交易策略的精确性。 修正波动水平:   通过启用修正波动水平,交易员可以在更大的趋势内识别潜在的修正。这个功能有助于识别回撤,并帮助交易员利用有利的价格波动。 直接控制:   该指标的控制面板允许无缝地操纵回归通道。交易员可以微调填充和射线选项等设置,提供符合其分析风格的通道定制视图。 更高时间框架分析:   为了获得更广泛的视角,该指标具有从更高时间框架加载数据的功能。这个功能可以帮助交易员评估不同时间尺度上的趋势和通道,促进对市场动态的更全面了解。 如何使用: 设置
当然可以!以下是您提供的文本的中文翻译: 引入   MT4 / MT5 天文指标:您的终极天体交易伙伴 您准备好将交易体验提升到天文高度了吗?不用再寻找,就在我们的革命性 MT4 天文指标中。这个创新工具超越了传统的交易指标,利用复杂的算法提供无与伦比的天文洞察力和精确计算。 指尖上的宇宙信息:   瞻仰一个详尽的面板,展示了一宝藏般的天文数据。了解行星的地理/太阳心坐标,太阳/地球距离,亮度,伸长度,星座,黄道和赤道坐标,甚至是水平坐标——每个细节都经过精心计算并呈现得美轮美奂。指标生成的垂直线对应于时间值,为您的交易旅程提供了宇宙的视角。 行星线条与关系:   在您的图表上欣赏行星线条的魔力,具有可自定义的比例和角度。通过直观的控制面板轻松切换每个行星线条的可见性。通过连结、六分、四分、三分、对冲和逆行等指标,发现行星关系的艺术。在您选择的时间范围内探索这些宇宙构造,使您能够识别重要的交易机会。 揭示甘恩的智慧:   通过受甘恩启发的平方垂直线揭示潜在的反转时机。这种创新修改将甘恩历经考验的原则带入现实,帮助您提前了解市场的转向和趋势。 月亮引导:   在您的图表上优雅地导航月相,
筛选:
a_sane3
532
a_sane3 2023.09.22 13:16 
 

用户没有留下任何评级信息

Sameer Haque
528
Sameer Haque 2023.09.10 16:06 
 

Highly accurate and very versatile. A great addition to my toolkit.

回复评论
版本 1.1 2023.10.21
- improvements