• 概述
  • 评论 (6)
  • 评论 (26)
  • 新特性

Trend Forecaster

5

!!!CHRISTMAS SALE!!!

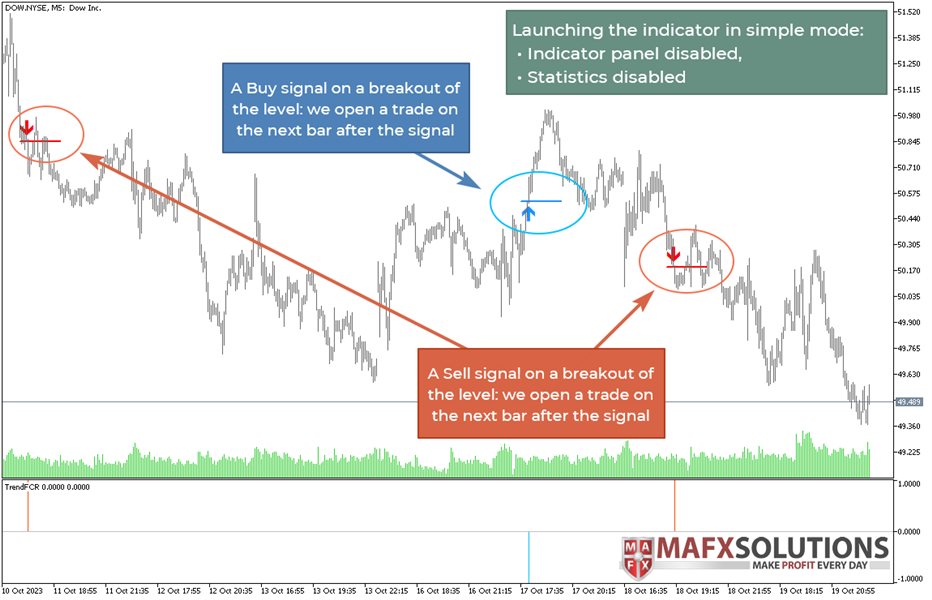
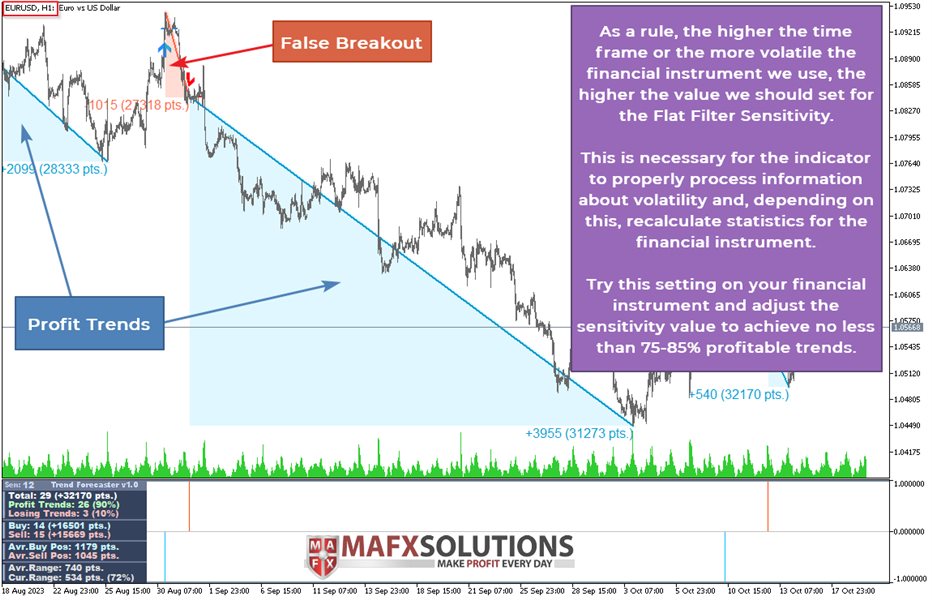
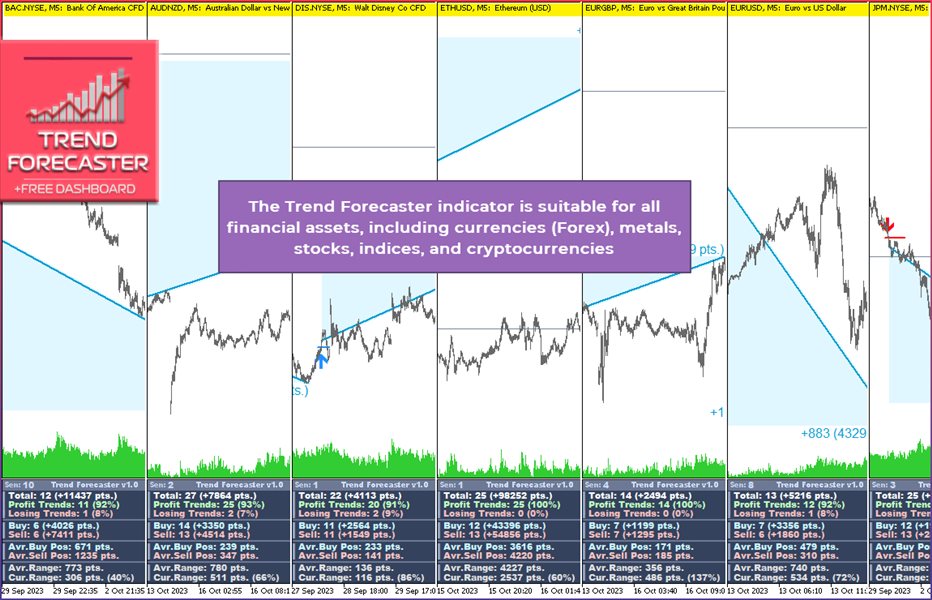
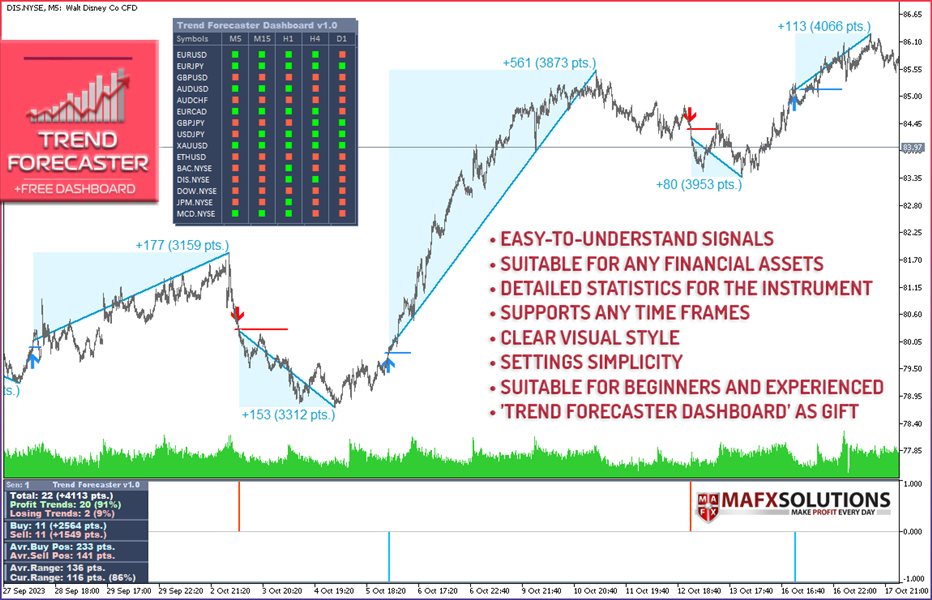
The Trend Forecaster indicator utilizes a unique proprietary algorithm to determine entry points for a breakout trading strategy. The indicator identifies price clusters, analyzes price movement near levels, and provides a signal when the price breaks through a level. The Trend Forecaster indicator is suitable for all financial assets, including currencies (Forex), metals, stocks, indices, and cryptocurrencies. You can also adjust the indicator to work on any time frames, although it is recommended to use M5 as the working time frame.

The indicator is extremely easy to set up – multiple internal algorithms are combined into a single essential variable! Add this powerful professional tool to your arsenal for identifying entry points, the current trend, and the maximum potential of any trading instrument. If you are a day trader, you can determine in advance whether it's worth opening a position or if the financial asset is already weak and you should wait for new signals.

Trend Forecaster Manual: https://www.mql5.com/en/blogs/post/754607

The Trend Forecaster indicator is a powerful professional tool that allows both novice and experienced traders to swiftly assess the current situation of a financial instrument. This indicator is built upon another of my indicators, Reversal Master for MT4, which has received numerous positive reviews. The MT5 version has been fundamentally re-worked to take advantage of the new features offered by MT5 for code analysis and optimization. Therefore, the MT5 version represents a fundamentally new product, with fresh capabilities and enhanced functionality.


Benefits of the Trend Forecaster Indicator

  • Simple and Easy-to-Understand Signals
  • You don't need to be a financial analyst to utilize Trend Forecaster signals. You receive a product that is easy to use, yet complex in terms of internal calculations and filters, which will elevate your trading to a new level.

  • Suitable for Any Financial Assets
  • Whether you trade in currencies, stocks, futures, or perhaps cryptocurrencies, all markets are at your disposal with the Trend Forecaster indicator.

  • Detailed Statistics for the Financial Instrument
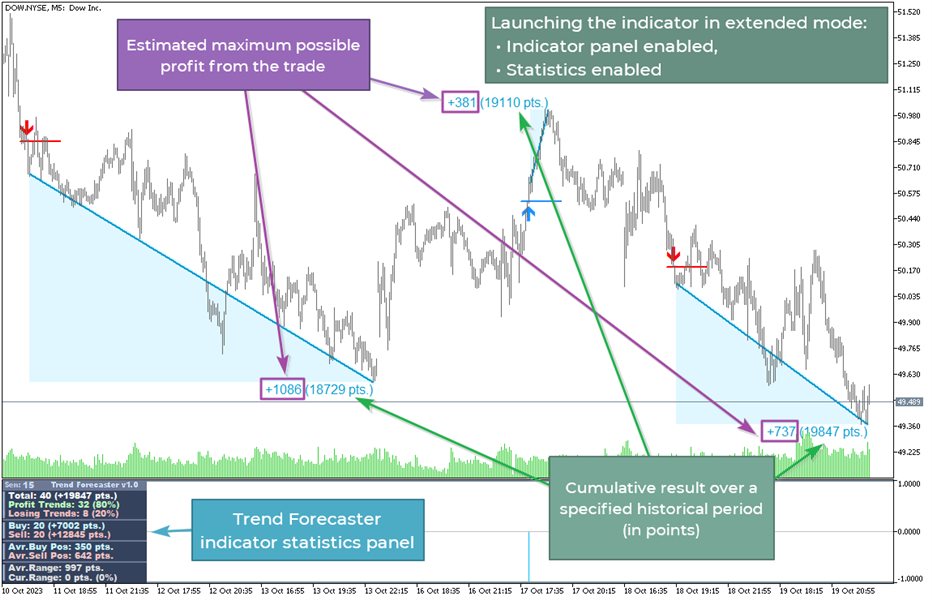
  • The Trend Forecaster indicator provides comprehensive analytics for the financial instrument. With this feature, you can quickly assess the total profit of the instrument over a specific time period, the profit potential of the instrument, and the expected profit from a trade. You can also determine whether it's worth opening a position at the moment or if the financial instrument has exhausted its potential.

  • Clear Visual Presentation of Information
  • Through collaboration with a focus group, we identified the optimal visual solutions to make the analysis process easier than ever before. Additionally, the ability to disable or toggle various modules has been preserved, allowing you to customize the visual representation of the indicator to your liking.

  • The indicator supports operation on any time frames
  • Do you trade on M1 or Daily timeframes? Or perhaps you use non-standard timeframes like M2 or H3? It doesn't matter – you can use any timeframe you prefer, easily adjusting the flat filter sensitivity with just one setting.

  • Simplicity of Configuration
  • This is an indisputable breakthrough in the field of indicator development – numerous complex calculations and functions for continuous market analysis are all concealed behind a single significant setting, the Flat Filter Sensitivity adjustment. All other settings pertain solely to the visual aspects of the indicator.

  • Availability of Various Alert Types
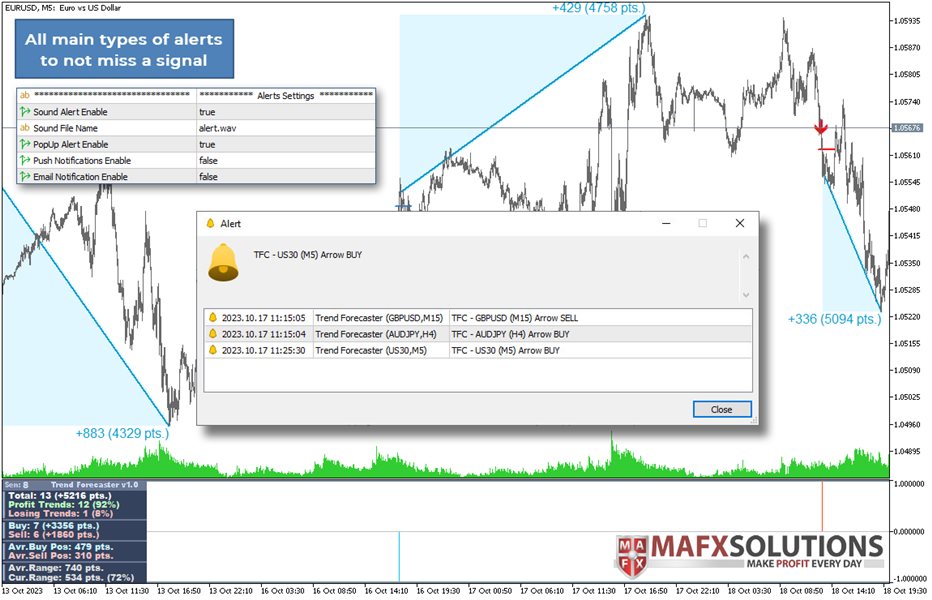
  • In practice, it's not always enough for the indicator to display the signal only on the financial instrument's chart. It's important for the trader to receive information about it, even when they are not at the monitor at that moment. In the Trend Forecaster indicator, all major types of alerts are present: sound notifications, pop-up alerts, Push notifications, and Email messages.

Please note that to receive Push-notifications and Email messages, pre-configuration of the MetaTrader 5 terminal is required (refer to the terminal's documentation)
  • The indicator is suitable for both beginners and experienced traders
  • It doesn't matter what level of experience you have. You can start your journey with the Trend Forecaster indicator if you are a beginner trader. Furthermore, you can streamline and enhance your trading performance, even if you already have another trading system, as the Trend Forecaster indicator can be used as a standalone product or as an addition to develop your own trading strategy.

  • Special Bonus for Trend Forecaster Indicator Buyers
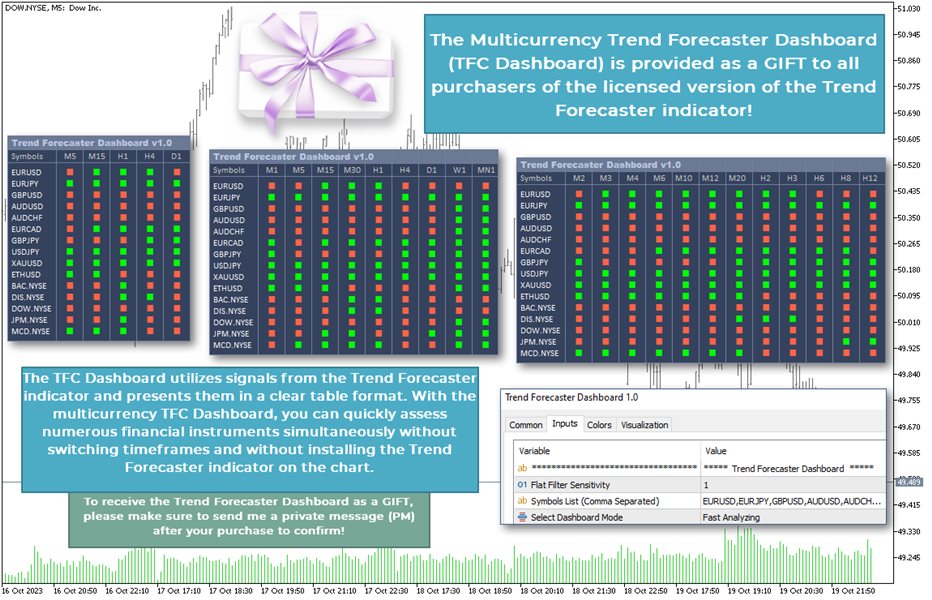
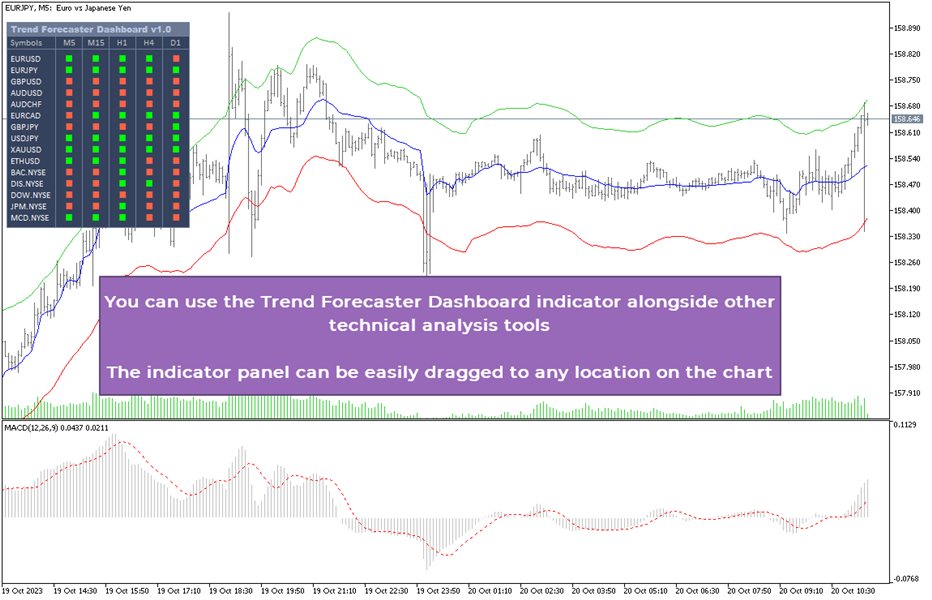
  • I want to express my gratitude to all my colleagues, friends, and buyers for their support, and as a token of my appreciation, I am offering you the Trend Forecaster Dashboard, a multi-currency panel, as a gift. By simply installing the panel on any price chart, you gain the ability to view current signals across a multitude of financial instruments and timeframes that you configure in the settings. This significantly streamlines and expedites market analysis. You can then proceed to select a specific financial instrument for more precise analysis and trade execution.

To receive the Trend Forecaster Dashboard as a gift, please make sure to send me a private message (PM) after your purchase to confirm!


Basic Functional Concepts of the Trend Forecaster Indicator

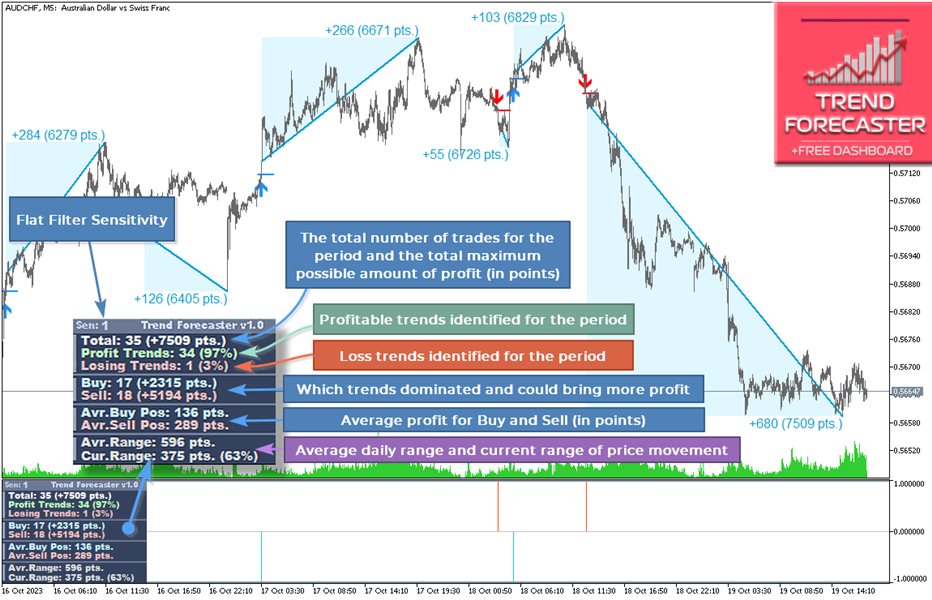
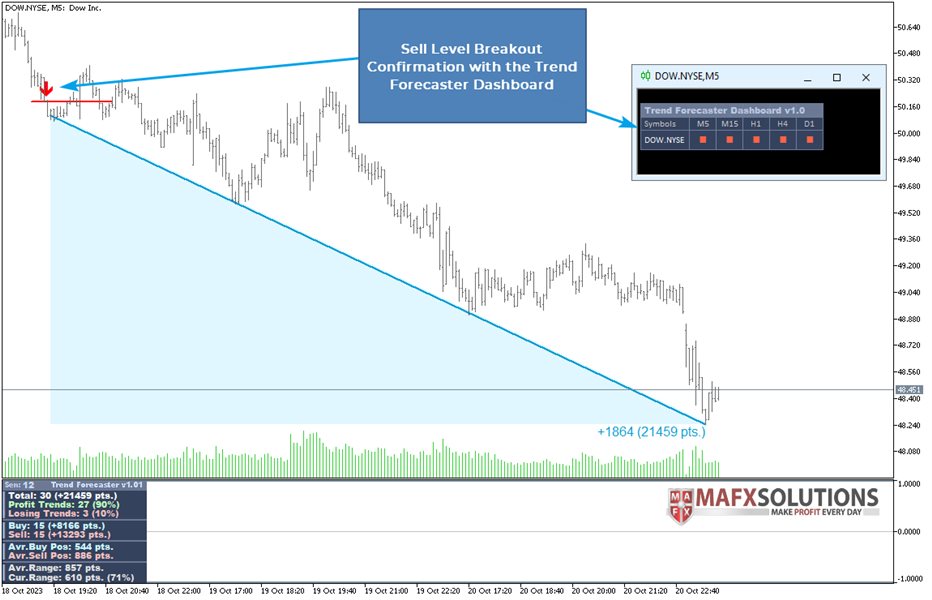
The main purpose of the indicator is to display the maximum potential profit for the current financial instrument, as well as the average profit per trade and the buying or selling advantage for the instrument. Additionally, it safeguards the trader from opening a position when the current market range for the instrument reaches the average market range, which can lead to trend exhaustion and a subsequent reversal.

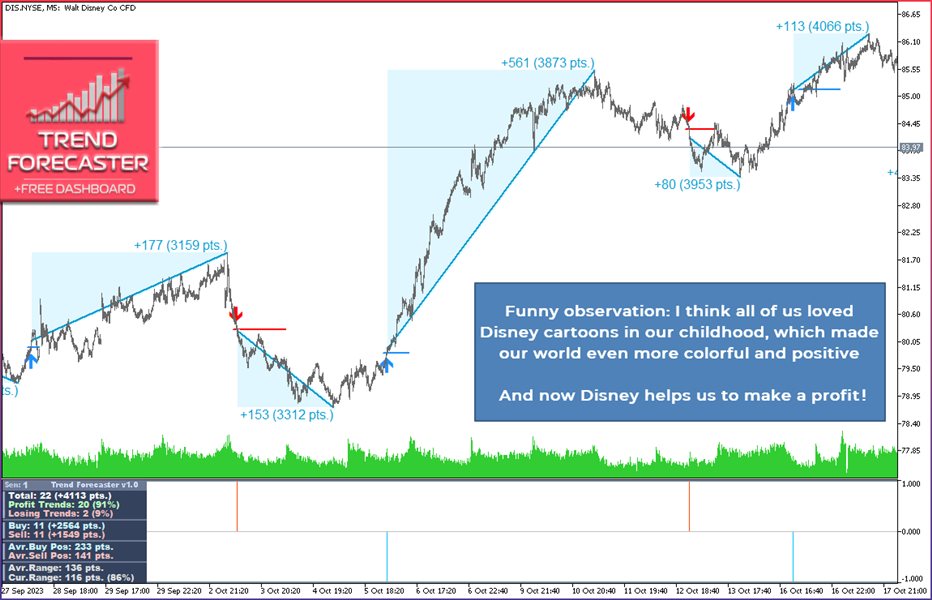
As long as the current position remains open, the indicator continues to monitor price movements and updates data on the maximum potential profit in line with the price. When a counter signal appears, the indicator records the profit value and includes it in the instrument's statistics, then proceeds to monitor the new signal. Signal arrows do not repaint after appearing.


Indicator Settings

Main Settings:

Flat Filter Sensitivity The Flat Filter Sensitivity – the main indicator setting
Show Expected Profit/Loss Display of expected Profit/Loss statistics on the price chart and on the indicator panel in the subwindow of the chart. When this option is turned off, the indicator panel in the subwindow is automatically disabled
Show Info Panel Display of the indicator panel in the subwindow of the chart. When this option is turned off, financial instrument statistics are only displayed on the price chart
Panel Mode Indicator panel display mode for saving space on the chart:
Compact Mode – only the key statistics
Normal Mode – normal operating mode
Extended Mode – extended mode with full info set
Show Summary Profit at Chart Displaying the cumulative profit on a price chart
Number of Bars to Analyze The number of bars to analyze to adjust the depth of historical data analysis

Signal Settings:

Sound Alert Enable Sound signal for a buy or sell signal alert
Sound File Name The name of the sound file to be played for the sound signal (the sound file should be located in the 'Sounds' folder of the terminal)
PopUp Alert Enable Pop-up notification
Push Notifications Enable Sending a Push-notification
Email Notification Enable Sending an email message
Please note that to receive Push-notifications and Email messages, pre-configuration of the MetaTrader 5 terminal is required (refer to the terminal's documentation)

Visual Settings:

Select Color Theme Selecting a color scheme:
Off – the color scheme is disabled. In this case, custom color settings are used (as described below)
Light Theme – light theme
Dark Theme – dark theme
Buy Arrow Color The color of the 'Buy' arrow
Sell Arrow Color The color of the 'Sell' arrow
Profit Line Color The color of the line connecting the open price and the maximum profit point
Loss Line Color The color of the line for a losing position if the price does not move in the direction of the signal
Profit Line Background Color The color of the glow around the profit line for better visibility on the chart
Loss Line Background Color The color of the glow around the loss line for better visibility on the chart
Draw Profit/Loss Triangle Zones Display/hide the profit/loss zone as a triangle

Tips for Using the Trend Forecaster Indicator and the Additional Trend Forecaster Dashboard Panel

  • Opening trades when gaps occur
  • A trade entry signal occurs when a significant level is breached. I recommend avoiding trades where the level is breached on a gap.

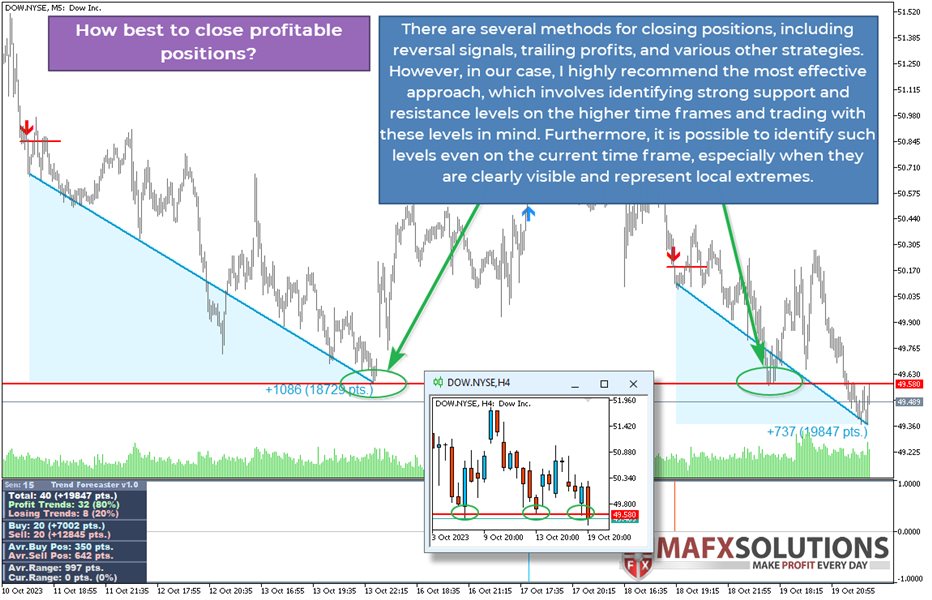
  • How best to close profitable positions?
  • The simplest and, in my opinion, not the most effective method is to close positions based on the opposite signal. However, such an approach can be quite effective in volatile financial instruments. The next method is using various types of trailing stops, such as moving the stop based on fractals. In this case, it's better to use a larger fractal size than the standard one. The most effective method, which I recommend, is to identify strong levels on the daily time frame and trade with consideration of these levels.

  • How is it best to close losing positions?
  • Along with closing positions based on the opposite signal, you can also consider the following option. If, after breaking through a level, the price doesn't continue its movement in the desired direction for a relatively long time, consolidates near the level, or retraces back below the level, you can contemplate closing positions without waiting for the opposite signal. As an example for determining a failed breakout, you can use a simplified count of bars during which the price didn't settle in the profit zone.

  • How can Average Range (Avr.Range) and Current Range (Cur.Range) help avoid a flat market with the risk of a reversal movement?
  • In trading, there is a simple truth - no one can ever accurately predict how far the price will go and when it will reverse. Fortunately, there are tools and possibilities that can significantly reduce the risk of opening positions in an exhausted market. The Average Range parameter shows us the average intraday volatility of a financial instrument. This is the value that the instrument typically moves within a day. Like all averages, it does not take into account extremely large or extremely small price movements. However, as such extreme movements are more the exception than the rule, this parameter allows us to estimate the average profit we can expect within a day on the analyzed financial instrument.

    The Current Range parameter shows us how much the price has already moved within the day. Consequently, the higher the value of the Current Range relative to the Average Range, the less profit potential remains for us. In other words, if you see that the price has already covered 80% (for example) according to the Current Range, then you have approximately 20% of the Average Range left for potential profit. It's worth giving it some thought before entering such a trade. Keep in mind that with such a small price range, there is an increased risk of the market going flat and experiencing a subsequent reversal.

  • How can Trend Forecaster Dashboard improve our results?
  • The well-known fundamental rule in trading tells us that the trend is our friend. While trading against the trend is possible, aligning your position with the trend makes the trading process significantly calmer and more effective. The additional indicator, Trend Forecaster Dashboard (TFC Dashboard), provides us with an extra advantage in our trading process. For instance, let's consider a scenario where we are trading EURUSD on an M5 time frame (which, by the way, happens to be my preferred time frame for more precise entry and exit points). Suppose we receive a Sell signal. However, we observe that the TFC Dashboard is indicating Buy signals on the H1 and H4 time frames. If we were to enter Sell positions on M5 at this point, our position would be contrary to the trend on the higher time frames, which is not favorable. To avoid this, we simply wait for a new buy signal on M5 that aligns with the trend on the higher time frames.

    Another scenario could occur where the higher time frames have reversed and are now indicating Sells. In this case, on M5, we would also wait for a Sell signal in the direction of the trends on the higher time frames. As for the signal on the Daily chart, it's good if it also confirms the direction. However, if the TFC Dashboard signals that all time frames from M5 to H4 are in the Buy zone while the Daily is in the Sell zone, in such a case, I often disregard the Daily time frame information if I'm trading on M5. I can close my Buy positions a few times before feeling the impact of the Daily time frame. However, if H1 or H4 start to turn against your direction, it's better not to take risks or use additional confirming signals and set closer profit targets.

And one more important rule that I want to share with you in this short manual:

The indicator shows the maximum possible profit we can obtain from a trade, but you should understand that technically, achieving such profits pip by pip is impossible every time. Strong support and resistance levels, as mentioned earlier, can be very helpful in this regard. Additionally, use the following important rule when searching for suitable financial assets for trading. Try to select instruments for trading where the Profit Trends to Losing Trends ratio is better than 75% to 25%. In other words, anything better than that is a suitable option. For example, 96% to 4%, as I see at the time of writing this description on the charts of Disney and Dow.


You can find more detailed information on the practical application of the Trend Forecaster indicator in the indicator's manual.

Please take note! All my products can be purchased exclusively here, on the official MQL5 website. Beware of scammers and counterfeit copies of my products! When you buy licensed versions, you receive support and my trading advice along with practical guidance on using my products. And, of course, you'll get free updates for my products, which include various enhancements and additional functionality. All of this is forfeited when you acquire a questionable copy from third-party sources. I cannot be held responsible for the quality and functionality of code bought from third parties!

For all matters related to purchasing, installation, and usage of the indicator, please write in private messages (PM)!


About the reviews

Dear friends, I sincerely hope you are enjoying my developments. I would greatly appreciate it if you could share your valuable feedback on my products! As a trader and programmer, it is essential for me that my products are beneficial and assist you in trading. Your feedback directly influences future enhancements and inspires me to make my products even better for you. Thank you for your support and loyalty!

评论 6
Alberto Gauer Borrego
6901
Alberto Gauer Borrego 2024.07.26 13:11 
 

Not only the indicator gives very good trend signals, but the support and attention given by the dev Alexey is also superb, thanks buddy

amnonwr2 Waskar
235
amnonwr2 Waskar 2024.07.24 20:08 
 

working very well thanks for the product

Steffen Schmidt
342
Steffen Schmidt 2024.06.21 22:05 
 

I am without doubt, this is the most superior, excellent and outstanding software indicator for MT5 for a fraction of the price the big guys are charging, it’s your chance to acquire this valuable trading software now. It’s the closest thing to Holy Grail, still within 97%-99.99% chance of succeeding.

推荐产品
All 11 indicators quickly turn off and turn on quickly! Set of indicators: 2 indicators "TREND"   : - fast = line 4 colors - slow = dots 4 colors The coloring of the indicators depends on the direction of the trend and the RSI indicator: 1) uptrend and RSI<50% 2) uptrend and RSI>50% 3) downtrend RSI<50% 4) downtrend RSI   >   50% Set indicator periods for each timeframe: M5 M10 M15 M30 H1 H2 H4 H6 H12 D1 W1 MN Do not enter trades if at least 1 of the indicators is horizontal. For a
Adjustable Consecutive Fractals  looks for 2 or more fractals in one direction and sends out a on screen alert, sound alert and push notification, for strong reversal points . Adjustable Consecutive Fractals, shows the fractals on chart along with a color changing text for buy and sell signals when one or more fractals appear on one side of price. Adjustable Consecutive Fractals is based Bill Williams Fractals . The standard Bill Williams fractals are set at a non adjustable 5 bars, BUT withe
Rocket Trend
Andriy Sydoruk
The Rocket Trend indicator is trending. The indicator draws two-color points connected by lines along the chart. This is a trend indicator, it is an algorithmic indicator. It is easy to work and understand when a blue circle appears, you need to buy, when a red one appears, sell. The indicator is used for scalping and pipsing, and has proven itself well. Rocket Trend is available for analyzing the direction of the trend for a specific period of time. Ideal for novice traders learning the laws o
The Plasma Trend indicator is a simple technical indication that is used to determine the current trend direction in the market. The Plasma Trend indicator is a powerful tool for determining the direction of the trend in the Forex market. It is based on both standard technical indicators and proprietary mathematical calculations, which provides a more accurate and reliable trend determination. Its implementation in the form of lines of two colors simplifies the visual determination of a change
General Description In the simplest terms this is a contrarian intra-day scalping system. Built to try and let correct trades run as far as possible and flip the trade when indicated. The indicator looks at historical daily trading ranges to lay out levels at which it takes long and short positions based on the statistical levels. The indicator is built around index futures, mainly around S&P and the DOW but can be used an any futures contract mainly using AMP Futures to trade. The indicator is
Godfather mt5
Ivan Simonika
The intelligent algorithm of the Godfather indicator accurately determines the trend, filters out market noise and generates entry and exit levels. The indicator will help in finding entry points when analyzing the price chart. The program first receives a "snapshot" of the graph, then analyzes it. The results are reported to the trader in the form of signals. The main purpose of this indicator is to determine the moments of entries and exits from transactions, so the indicator displays only th
Market Session Pro
Kambiz Shahriarynasab
The  Market Sessions Indicator for MT5 helps you  predict market turnarounds  by detecting major supply and demand areas. These pivot points tend to occur after a new session has started and the previous one is still open. It is also used to gauge how many points or pips the market moves on average during a session. This helps us to place better our take profits and stop losses. The indicator works on all forex pairs, gold, silver, commodities, stocks, indices and any other instrument that your
Urgently mt5
Tatiana Savkevych
The Urgently indicator is designed to quickly determine the situation in the market, reflect the state of the market and signal profitable levels for opening trades. Market conditions change quickly enough, requiring constant calibration of trading strategies. Recommended for use in conjunction with any of the oscillators. The Urgently forex market trend indicator shows the trend direction and entry points. It smooths out price fluctuations when generating a signal by averaging the data and the
The utility displays the order book, as well as increases its depth, remembering the location of applications that have gone beyond the current "window" view. With the utility user can perform quick trading actions in one click - placing/cancelling/editing of explicit and hidden orders, and also opening/editing positions. Utility features The orders book display works only on those trading symbols for which it is broadcast by the broker. To reset the information about the rows that were record
Market Session Visual
Kambiz Shahriarynasab
The  Market Sessions Indicator for MT5 helps you  predict market turnarounds  by detecting major supply and demand areas. These pivot points tend to occur after a new session has started and the previous one is still open. It is also used to gauge how many points or pips the market moves on average during a session. This helps us to place better our take profits and stop losses. The indicator works on all forex pairs, gold, silver, commodities, stocks, indices and any other instrument that yo
The new update makes this indicator a complete tool for studying, analyzing and operating probabilistic patterns. It includes: On-chart Multi-asset percentage monitor. Configurable martingales. Twenty-one pre-configured patterns, including Mhi patterns and C3. An advanced pattern editor to store up to 5 custom patterns. Backtest mode to test results with loss reports. Trend filter. Hit operational filter. Martingale Cycles option. Various types of strategies and alerts. Confluence between patter
这是一个会自我学习的指标。你需要设定一个起始时间,并下载相应的历史数据,让它进行学习。学习的规则限制尽量少,给予指标最大的自由度。因此,以学习期间的最佳结果为选取原则,并不保证每次交易都是盈利的。通常而言,学习时间越长,结果越可靠。 在策略测试器中,你需要设定时间参数,早于测试开始的时间,以便让指标有充足的学习时间。 指标会发出买入或者卖出的信号,以箭头的方向作出区分。指标亦会发出关闭信号,以不同颜色的圆点作区分。 *************************************************************************************************************************************
Cycles Forecast
Pooriya Alirezaee
This indicator is based on a mathematical formula and an ANN combined, designed to make a model(using previous prices) of the most recent market condition (any chart*) in order to use the model as a forecasting tool. *This indicator can operate on any chart/timeframe, but it's suggested you use multiple timeframes for each trade because this method relies solely on the time factor, you can not use this indicator to predict price volatility, but if it's fit correctly it will show you when the nex
Ugenesys AI MT5
Odaine Ramon Mcmillan
uGenesys AI - 90% Accurate Daytrading Indicator Introducing the ultimate forex trading indicator system, uGenesys AI, powered by cutting-edge AI technology and advanced analytical techniques, including Time-Series Analysis and Genetic Algorithms. Our AI-powered trading system leverages the power of time-series analysis to identify trends and patterns in historical price data, allowing traders to make informed predictions about future market movements. By analyzing vast amounts of data, our sys
Reliable Scalping Indicator MT5
Oliver Gideon Amofa Appiah
Reliable Scalping Indicator   RELIABLE SCALPING INDICATOR ( RSI ) As the name implies, this indicator gives reliable BUY and SELL signals on your chart. NO FANCY INDICATORS, NO MESSING WITH YOUR CHARTS. IT DOES NOTHING TO YOUR CHARTS EXCEPT TO SHOW ARROWS FOR BUYS AND SELLS. It DOES NOT repaint and has alerts and notifications which you can allow. It has chart notifications, mobile and email notifications and alerts. THIS INDICATOR PRODUCES ABOUT 85% ACCURATE SIGNALS WHICH IS VERY ENOUGH TO MAKE
TrendAccess
Robert Hess
Description: TrendAccess can optimize your trading time by showing you the trend via two different calculation modes quick and easy. No more searching for Trends. Just open the chart and look at the trend display. Features: Shows Uptrend, Downtrend and "No Trend" indicator Shows the calculated ZigZag Profile Works on all timeframes Two different calculation Modes (MACD and Candle-based calculation) Settings: Variable  Standard Value Description  Calculation Mode  Candle based  C
MR Trend Corrections 5
Sergey Khramchenkov
We publish the indicator as a useful tool in trading and call this indicator the "Swiss Army Knife" because it provides many possibilities and combinations to help understand the material on the "Masters of Risk" trading system. The indicator itself is not part of the tools used in the "Masters of Risk" trading system. The indicator consists of 3 separate multi-timeframe indicators, which in combination with each other help to reduce the "noise" of false signals. The first of the indicators ar
Eazy Indicator
Isaac Agyei Poku
Forex BUY and SELL signals from the best Heiken Ashi Smoothed indicator. Draw bullish/bearish bars on the chart. Accurate trend detector. Heiken Ashi Smoothed is a simple MT5 indicator that draws bullish and bearish bars in the chart to reflect the direction of the trend. The indicator consists of orange bearish bars and green bullish bars. When the trend changes its direction, the indicator changes its color. The indicator is a modernization of the traditional Heiken Ashi indicator. Moving Aver
Hello There, Today I want to show you my new researchable fore BUY SELL indicator, it work all asset, and also work Derive Volatility asset! it work all time frame, but i recommend start 5 minute to H1 when you receive a signal just take trade and stay wait for your take profit asset All Major Pair And minor IT WORK ALSO XAUUSD Fantastic results,  for more info,,, message us thank you   
Market Profile iMT5
Kyra Nickaline Watson-gordon
Definition : A Market Profile is an intra-day charting technique (price vertical, time/activity horizontal). Market Profile is best understood as a way to see order in the markets. Market Profile was a way for traders to get a better understanding of what was going on, without having to be on the trading floor. The current indicator is developed based on Easy-to-Use architecture including a wide range of visual settings. Major Features of Indicator : Various Views of Market Profile The indica
DuhokTrend
Ismael Nayif Ismael Ismael
How to Add a Product Description (MetaTrader Market) To add the product description effectively in MetaTrader's Market, follow these steps: 1. Log into the MetaTrader Market: Go to your MQL5 account . Navigate to the "Seller's Dashboard" or "Products" section. Select your product, DuhokTrend . 2. Writing the Description: To enhance the product's rating, write a detailed and structured description : Template for Product Description: DuhokTrend - Advanced Indicator for Trend Analysis Overview:
Trend Turn
Ivan Simonika
The implementation of the Trend Turn trend indicator is simple - in the form of lines of two colors. The indicator algorithm is based on standard indicators as well as its own mathematical calculations. The indicator will help users determine the direction of the trend. It will also become an indispensable advisor for entering the market or closing a position. This indicator is recommended for everyone, both beginners and professionals. How to interpret information from the indicator. We se
RAD Real Acummulation and Distribution
Jose Alejandro Jacome Jimenez
RAD CRITICAL LEVES RAD indicator tracks “Relevant Volume” in real time, identifying accumulation and distribution processes, projecting them in the chart as SUPPORT or RESISTANCE zones. Natural   support   and resistance levels are generated by Volume Accumulation and Distribution processes. As these processes evolve, levels at which the relevant volume in the market place is positioned, become difficult areas to cross upwards or downwards. By using this information, traders can identify very s
True Day
Aurthur Musendame
5 (1)
True Days is a tool designed specifically for the trader who wants to catch intraday volatility in price charts.  True day makes it easier for the trader to avoid trading in the dead zone - a period in time where markets are considered dead or non volatile. The trader can concentrate on finding opportunities only during periods of profound market movements. By default the indicator gives you a true day starting at 02:00 to 19:00 hours GMT+2. You can adjust according to your Time Zone. By deafult
FREE
Supply and Demand Zones MT5
Peter Mueller
4.75 (4)
The Supply and Demand Zone Indicator is a powerful and easy-to-use tool designed to help traders identify critical supply and demand zones on the chart. These zones can provide valuable insight into potential market reversals, breakouts, and important price levels where buyers or sellers are likely to take control. Key Features: Automatic Zone Detection : The indicator automatically identifies supply and demand zones based on historical price action and support/resistance levels, taking the gues
FREE
TPSproTREND PrO MT5
Roman Podpora
4.54 (13)
Ultimate Retest
Nguyen Thanh Cong
5 (4)
Introduction The "Ultimate Retest" Indicator stands as the pinnacle of technical analysis made specially for support/resistance or supply/demand traders. By utilizing advanced mathematical computations, this indicator can swiftly and accurately identify the most powerful support and resistance levels where the big players are putting their huge orders and give traders a chance to enter the on the level retest with impeccable timing, thereby enhancing their decision-making and trading outcomes.
FREE
Scissors Pattern
Kambiz Shahriarynasab
Configure scaffolding charts and signals based on the scissor pattern, which works great at low times. Buy and sell signs based on 2 previous candle patterns It works on the active time form, and when detecting the pattern in 4 time frames, 5 minutes, 15 minutes, 30 minutes and one hour, the alert can be set to notify us of the formation of this pattern. MetaTrader version 4 click here How to use: When there is an opportunity to buy or sell, the marker places a scissors mark on
该指标具有独有的支撑阻力计算方案  , 是独一无二的交易系统    。 指标特性 想象一下,如果您能提前精确的判断出重要的交易支撑阻力区域以及点位,您的交易将如何改善   ?  基于独特的计算方式,指标通过对趋势进行分析,通过对当前的支撑阻力进行分析后,得出现在重要的支撑阻力以及做单方向,计算得到的止盈和止损建议,以及关键的进场点位建议. 在交易策略中,进场点位和趋势方向同样非常关键,前者点位不同所面临的风险是不同的,止损的点数也是成倍放大. 本指标分析了当趋势进行后,暂时进入调整时间,分析了此时的重要进场支撑阻力并计算风险控制一定的止损,和止盈,合理的盈亏比. 本指标支持周期设置,可以设置其他周期.  大周期重要支撑阻力,以及小周期辅助判断可以在同一图表中完成. 基本显示 显示历史支撑阻力的价格标签。 显示历史进场位置大概建议范围,以及止盈和止损建议,目标预测. 显示当前方向的判断,以及进场点位,以及止盈止损建议 . 基本设置 设置计算的周期。 警报设置 接近报警 碰触报警 报警弹窗 报警邮件发送 发送推送警报 颜色设定 可以设置不用的实时支撑阻力颜色 可以设置不用的历
Pullback Hunter
Anton Polkovnikov
PULLBACK HUNTER (回调猎手) 每个交易员的终极梦想是什么?要毫不迟疑地看到反转将在哪里发生。当然,这也是一种魔法,虽然... 没有什么是不可能的。但与此同时,我为你准备了一个指标,它可以实时标记当前运动的修正结束,或者简而言之,它可以捕捉到反转的情况。什么是主旨?许多人在价格向开仓方向移动时练习反弹。他们在新极点的形成过程中这样做。一切都很好,但在这种情况下,头寸的加权平均价格并不理想。但如果我们等待回调并在趋势中买入,我们将获得一个良好的平均价格。这个指标显示了矫正运动可能结束的地方。 什么是重要的?不建议 "正面 "使用指示器。也就是说,在向上的箭头上买入,等待向下的箭头来关闭购买。指标的最佳用途是设定一个位置。通过这个额外的工具,你可以过滤你的方向,并在箭头上买入(或做空)被过滤的方向。例如,你使用累积三角洲。它向你展示了整个市场的购买情况。你等待上升的箭头,然后买入。使用额外的分析工具来退出头寸。 该指标的原理是什么?箭头是价格测试支撑或阻力水平的地方。这些水平是由指标内部的算法计算出来的。一个相同的蜡烛图可能同时测试几个支撑位。这可以通过箭头的颜色看出。如果烛
该产品的买家也购买
RelicusRoad Pro MT5
Relicus LLC
5 (17)
现在$ 147(更新后增加到$ 499) - 无限帐户(PC或Mac) RelicusRoad 用户手册 + 培训视频 + 访问 Private Discord Group + VIP 身份 一种看待市场的新方式 RelicusRoad 是世界上最强大的外汇、期货、加密货币、股票和指数交易指标,为交易者提供保持盈利所需的所有信息和工具。我们提供技术分析和交易计划,帮助每一位交易者取得成功,从初学者到高级。它是一个关键的交易指标,可以提供足够的信息来预测未来的市场。我们相信一个完整的解决方案,而不是图表上几个没有意义的不同指标。这是一个多合一指标,显示无与伦比且非常准确的信号、箭头 + 价格行为信息。 RelicusRoad 基于强大的人工智能,提供缺失的信息和工具来教育您并使您成为交易专家,成为成功的交易者。 几乎所有技术指标都滞后,这意味着它们只能报告已经发生的事情。因此,他们只确认您过去可以看到的价格已经在哪里。我们相信领先指标可以预测未来价格,而无需重新绘制,也不要过度依赖可能改变并导致重新绘制的滞后指标。如果您根据滞后指标进行交易并建立头寸,您就知道您已
TPSpro RFI Levels MT5
Roman Podpora
4.67 (15)
指示       俄罗斯 -        英语   建议 与指示器一起使用     -       TPSpro 趋势专业版 -   MT4版本       交易中的一个关键要素是做出买卖交易工具决定的区域或水平。尽管主要参与者试图隐藏他们在市场中的存在,但他们不可避免地会留下痕迹。我们的任务是学习如何识别这些痕迹并正确解释它们。 主要功能: 向卖家和买家显示活跃区域! 该指标显示所有正确的初始买入和卖出脉冲水平/区域。激活这些水平/区域后,开始寻找切入点,水平会改变颜色并填充特定阴影。此外,还会显示箭头,以便更直观地了解情况。 显示更高时间范围内的级别/区域(MTF 模式) 添加了使用更高时间间隔显示级别/区域的功能。此外,该指标还具有自动趋势检测功能(   TPSproTREND PRO   )。 用于交易的单独专业的逐步算法。 该算法专为日内交易而设计,既可顺势交易,也可逆势交易。每个活动模板均提供详细说明。 适用于多种时间范围 。 TPSpro RFI 水平指标可用于图表上的任何时间范围,从一分钟(M1)开始一直到每月(MN)。 图形和声音警报。 该指标提供图形和声音指示
CBT Quantum Maverick 高效的二元期权交易系统 CBT Quantum Maverick 是一款精心设计的高性能二元期权交易系统,专为追求精准、简单和纪律的交易者打造。无需自定义,该系统经过优化,可直接使用并产生高效结果。只需遵循信号操作,稍加练习即可掌握。 主要特点: 信号精准度: 基于当前K线生成下根K线交易信号,无频繁重绘。 市场多样性: 专为二元期权交易设计,兼容多种经纪商和资产类别,适应不同交易偏好。 兼容性: Deriv Synthetic Charts :适用于任何时间框架。 OTC Charts :来自如 Quotex、PocketOption、Binomo、Stockity、IQOption、Exnova、OlympTrade、Deriv、Binolla 和 Homebroker 的经纪商,可导入 MT5(一周内提供免费导入支持,之后需支付服务费用)。 外汇、加密货币和商品市场 :扩展资产利用。 高收益二元资产 :建议使用90%以上的高回报率资产。 额外优势: 全面的交易计划: 提供系统化和纪律性交易的分步支持计划。 高效时间利用: 每天
Quantum TrendPulse
Bogdan Ion Puscasu
5 (4)
介绍 Quantum TrendPulse   ,这是一款终极交易工具,它将 SuperTrend   、   RSI 和 Stochastic 的强大功能整合到一个综合指标中,以最大限度地发挥您的交易潜力。该指标专为追求精准和效率的交易者而设计,可帮助您自信地识别市场趋势、动量变化以及最佳进入和退出点。 主要特点: 超级趋势整合: 轻松跟随当前的市场趋势并乘上盈利浪潮。 RSI 精度: 检测超买和超卖水平,非常适合把握市场逆转时机,可用作 SuperTrend 的过滤器 随机精度: 利用随机振荡在波动的市场中寻找隐藏的机会, 用作超级趋势的过滤器 多时间范围分析: 从 M5 到 H1 或 H4,在不同时间范围内关注市场动态。 可定制的警报: 当您的自定义交易条件得到满足时收到通知,这样您就不会错过任何交易。 无论您是新手还是经验丰富的交易员,   Quantum TrendPulse 都能为您提供所需的优势,帮助您增强策略并自信地进行交易。借助这一强大的指标,将洞察力转化为利润 — 掌控您的交易! ***购买 Quantum TrendPulse,即可免费获得 Quantum T
FX Volume MT5
Daniel Stein
4.93 (14)
利用外汇交易量在外汇交易中获得真正的优势:终极成交量指标 外汇交易量(FX Volume)是第一个也是唯一一个从内部人士的角度揭示真实市场情绪的交易量指标。通过对机构市场参与者和经纪商的定位提供独到的见解,FX Volume 使您能够以通常只为主要参与者保留的先见之明进行交易。告别 COT 报告的延迟,FX Volume 可以在您的图表上即时为您提供这些关键信息,使您能够做出更快、更明智的交易决策。 为什么外汇交易量对您的交易至关重要? 使用 FX Volume,您可以获得无与伦比的独特市场数据,为您提供一般交易量指标无法提供的洞察力。以下是您可以在图表上直接跟踪的数据: 仓位比率:查看各种货币的多空比率,清晰了解市场情绪。 比率变化:查看所选时间段内多头头寸的百分比变化。 总交易量:实时跟踪各货币的总交易量(多头和空头)。 详细的多头和空头交易量:准确了解每种货币的买卖量。 净多头交易量:查看多头和空头头寸之间的差额,以衡量净情绪。 净多头百分比变化:以百分比的形式了解净多头情绪的变化,以便快速比较。 成交量-价格相关性:跟踪成交量如何影响价格,找到潜在转折点。 如何访问
MetaForecast M5
Vahidreza Heidar Gholami
5 (2)
MetaForecast能够根据价格数据中的谐波来预测和可视化任何市场的未来走势。虽然市场不总是可预测的,但如果价格中存在模式,MetaForecast可以尽可能准确地预测未来。与其他类似产品相比,MetaForecast通过分析市场趋势可以生成更精确的结果。 输入参数 Past size (过去的尺寸) 指定MetaForecast用于创建生成未来预测模型的柱数量。该模型以一条黄色线绘制在所选柱上。 Future size (未来的尺寸) 指定应预测的未来柱数量。预测的未来以粉色线表示,并在其上绘制了蓝色回归线。 Degree (程度) 此输入确定了MetaForecast将在市场上进行的分析级别。 Degree 描述  0 对于程度0,建议使用较大的值来设置“过去的尺寸”输入,以覆盖价格中的所有高峰、低谷和细节。  1 (建议的) 对于程度1,MetaForecast可以理解趋势,并通过较小的“过去的尺寸”生成更好的结果。  2 对于程度2,除了趋势,MetaForecast还可以识别反转点。对于大于1的程度,必须使用较高的“细节”和“噪音减少”输入值。  大于2 不建议使用大
TPA True Price Action indicator reveals the true price action of the market makers through 100% non-repainting signals strictly at the close of a candle! TPA shows entries and re-entries, every time the bulls are definitely stronger than the bears and vice versa. Not to confuse with red/green candles. The shift of power gets confirmed at the earliest stage and is ONE exit strategy of several. There are available now two free parts of the TPA User Guide for our customers. The first "The Basics"
介绍     Quantum Breakout PRO   ,突破性的 MQL5 指标,正在改变您交易突破区域的方式!由拥有超过13年交易经验的资深交易员团队开发,     量子突破 PRO     旨在通过其创新和动态的突破区域策略将您的交易之旅推向新的高度。 量子突破指标将为您提供带有 5 个利润目标区域的突破区域的信号箭头,以及基于突破框的止损建议。 它既适合新手交易者,也适合专业交易者。 量子 EA 通道:       点击这里 重要的!购买后请私信我领取安装手册。 建议: 时间范围:M15 货币对:GBPJPY、EURJPY、USDJPY、NZDUSD、XAUUSD 账户类型:ECN、Raw 或 Razor,点差极低 经纪商时间:GMT +3 经纪商:IC Markets、Pepperstone with Raw 和 Razor 的点差最低 规格: 不重漆! 最多 5 个建议利润目标区域 建议止损水平 可定制的盒子。您可以设置自己的 Box Time Start 和 Box Time End。 接触 如果您有任何疑问或需要帮
Entry Points Pro for MT5
Yury Orlov
4.44 (124)
这款指标用于 MT5,可提供准确的入场交易信号,且无重绘。 它可应用在任何金融资产:外汇、加密货币、贵金属、股票、指数。 它将提供极其精准的评估,并告诉您何时开仓和平仓的最佳时机。 观看 视频 (6:22),其中包含一个仅处理单一信号的示例,该信号即可值回指标购价! 大多数交易者在 Entry Points Pro 指标的帮助下,在第一个交易周内即改善了他们的交易结果。 订阅我们的 Telegram 群 ! Entry Points Pro 指标的益处。 入场信号无重绘 如果信号出现,并得到确认,则它不会再消失;不像是重绘指标,它会导致重大的财产损失,因为它们可以在显示信号后再将其删除。 无差错开仓 指标算法可令您找到入场交易(买入或卖出资产)的理想时机,从而提高每位交易者的成功率。 Entry Points Pro 可操作任何资产 它允许您在 MT5 平台上交易任何经纪商的加密货币、股票、贵金属、指数、大宗商品和货币。 提供任何方向的信号 Entry Points Pro 指标提供针对任意价格走势的入场交易信号 - 上涨、下跌或横盘(横向)。
MetaBands M5
Vahidreza Heidar Gholami
4.5 (2)
MetaBands使用强大且独特的算法绘制通道并检测趋势,以便为交易者提供进出交易的潜在点。它是一个通道指标和强大的趋势指标。它包括不同类型的通道,可以通过使用输入参数简单地合并以创建新通道。MetaBands使用所有类型的警报通知用户市场事件。 功能 支持大多数通道算法 强大的趋势检测算法 能够合并不同类型的通道 多时间帧和多货币(信号矩阵) 所有类型的警报功能(声音、屏幕闪烁、推送通知、电子邮件、弹出窗口、箭头) 它永远不会重绘 趋势检测 MetaBands使用在通道内振荡的蓝色线来检测趋势。当该线遇到通道的上界时,表明开始下跌趋势,当它遇到下界时,表明开始上涨趋势。如果蓝线接近中线,则市场处于整理期。 该指标使用独特的方法来检测趋势。一开始可能看起来有些复杂,但如果您观看视频教程,您就会意识到它是多么强大且易于使用。 入场和出场信号 当趋势变化或价格穿过上下通道时,MetaBands会立即通过不同的方法提醒交易者,这些方法可以在指标设置中启用。 信号矩阵 要监视来自不同时间框架的多个符号并在一个地方查看信号,请单击右上角按钮或按键盘上的M键以打开信号矩阵。该矩阵可以
AT Forex Indicator MT5
Marzena Maria Szmit
5 (5)
The AT Forex Indicator MT5 is a sophisticated trading tool designed to provide traders with a comprehensive analysis of multiple currency pairs. This powerful indicator simplifies the complex nature of the forex market, making it accessible for both novice and experienced traders. AT Forex Indicator uses advanced algorithms to detect trends, patterns and is an essential tool for traders aiming to enhance their forex trading performance. With its robust features, ease of use, and reliable signal
TrendMaestro5
Stefano Frisetti
note: this indicator is for METATRADER4, if you want the version for METATRADER5 this is the link:  https://www.mql5.com/it/market/product/108106 TRENDMAESTRO ver 2.4 TRENDMAESTRO recognizes a new TREND in the bud, he never makes mistakes. The certainty of identifying a new TREND is priceless. DESCRIPTION TRENDMAESTRO identifies a new TREND in the bud, this indicator examines the volatility, volumes and momentum to identify the moment in which there is an explosion of one or more of these data a
Royal Wave Pro M5
Vahidreza Heidar Gholami
3.5 (4)
Royal Wave is a Trend-Power oscillator which has been programmed to locate and signal low-risk entry and exit zones. Its core algorithm statistically analyzes the market and generates trading signals for overbought, oversold and low volatile areas. By using a well-designed alerting system, this indicator makes it easier to make proper decisions regarding where to enter and where to exit trades. Features Trend-Power Algorithm Low risk Entry Zones and Exit Zones Predictions for Overbought and Over
Quantum Trend Sniper
Bogdan Ion Puscasu
4.72 (50)
介绍   量子趋势狙击指标 ,突破性的 MQL5 指标,正在改变您识别和交易趋势反转的方式!由拥有超过13年交易经验的资深交易员团队开发,     量子趋势狙击指标   旨在通过其创新的方式以极高的准确度识别趋势反转,将您的交易之旅推向新的高度。 ***购买量子趋势狙击指标,即可免费获得量子突破指标!*** 当量子突破指标识别出趋势反转时,它会向您发出警报和信号箭头,并建议您三个止盈水平。 它既适合新手交易者,也适合专业交易者。 量子 EA 通道:       点击这里 MT4版本:       点击这里 建议: 时间范围: 所有时间范围。为了获得最佳结果,我们建议在 M15、M30 和 H1 时间范围内使用它。 货币对:欧元兑美元、英镑兑美元、澳元兑美元、欧元兑英镑、, EURAUD,  XAUUSD 账户类型:ECN、Raw 或 Razor,点差极低 经纪时间:任意 经纪商:IC Markets、Pepperstone with Raw 和 Razor 的点差最低 建议止损:50 点 建议止盈水平:20 点、50 点和
Bill Williams Advanced
Siarhei Vashchylka
5 (9)
Bill Williams Advanced is designed for automatic chart analysis using Bill Williams' "Profitunity" system. The indicator analyzes four timeframes at once. Manual (Be sure to read before purchasing) Advantages 1. Automatically analyzes the chart using the "Profitunity" system of Bill Williams. The found signals are placed in a table in the corner of the screen. 2. Equipped with a trend filter based on the Alligator indicator. Most of the system signals are recommended to be used only accordi
EXCLUSIVE! JUST  10 COPIES  AVAILABLE!   BONUS AUX VIP Club 2024 : Include EA CAP, CEP, LDH, PSC307 & AO4C to enhance the performance of this tool to its maximum potential  Click Here to Download Files   ( for users only ) FREE Trading Education Available Daily via Zoom --- For More Info or Instant Message Click link ---  https://t.me/abcdwave Transform your trading with the "Five Magic Bullets" Indicator, tailored for traders who embrace the power of Elliott Wave Chaos Theory.
IVISTscalp5
Vadym Zhukovskyi
5 (6)
我们向您介绍iVISTscalp5指标,它不仅独特,而且在交易操作中也非常有效。该指标基于时间数据,是多年金融市场经验和深入分析的结果。iVISTscalp5指标是手动交易的优秀工具。便利性、简单性和可视化 - 所有的复杂性都隐藏在内部。我们将iVISTscalp5指标的设置和使用简化到了最大程度。该指标适用于MT5终端中您所拥有的所有金融工具。 操作时间为UTC+3的早上4点到晚上8点。 iVISTscalp5指标菜单(见截图1): History - 计算行情的周数 dT_min - 选择时间间隔的时间(分钟) TFline - 绘制水平成交量(时间帧) BARSline - 绘制水平成交量(条数) TFtrend1 - 绘制日线通道(时间帧) BARStrend1 - 绘制日线通道(条数) TFtrend2 - 绘制周线通道(时间帧) BARStrend2 - 绘制周线通道(条数) ALERT_TIMER - 设置闹钟 ALERT - 开启/关闭闹钟 Save - 开启/关闭将时间记录到文本文件。 图表上的红色和蓝色旗帜表示时间(VIST智能剃须系统的信号)。卖出信号为红旗,买入
Advanced Currency Strength28 MT5
Bernhard Schweigert
5 (2)
任何新手或专家交易者的最佳解决方案! 这个指标是一个独特的、高质量的、可负担得起的交易工具,因为我们纳入了一些专有的功能和一个新的公式。只需一个图表,你就可以读出28个外汇对的货币强度!想象一下,你的交易将如何得到改善,因为你的交易是在你的手中进行的。想象一下,你的交易将如何改善,因为你能够准确地确定新趋势或剥头皮机会的触发点? 用户手册:点击这里  https://www.mql5.com/en/blogs/post/697384 这是第一本,原版的! 不要买一个毫无价值的崇拜者的克隆品。 特别的 子窗口中的箭头显示强劲的货币势头GAP将指导你的交易! 当基础货币或报价货币处于超卖/超买区域(外盘斐波那契水平)时,在个人图表的主窗口中出现警告信号。 当货币力量从外围区间回落时,回撤/反转警报。 十字星模式的特别警报 可选择多个时间框架,以快速查看趋势! 货币强度线在所有的时间框架中都非常平稳,当使用较高的时间框架来识别总体趋势,然后使用较短的时间框架来确定精确的入口时,效果非常好。你可以根据自己的意愿选择任何时间框架。每个时间框架都由其自身进行了优化。 建立在
Gartley Hunter Multi
Siarhei Vashchylka
5 (9)
Gartley Hunter Multi - An indicator for searching for harmonic patterns simultaneously on dozens of trading instruments and on all possible timeframes. Manual (Be sure to read before purchasing) | Version for MT4 Advantages 1. Patterns: Gartley, Butterfly, Shark, Crab. Bat, Alternate Bat, Deep Crab, Cypher 2. Simultaneous search for patterns on dozens of trading instruments and on all possible timeframes 3. Search for patterns of all possible sizes. From the smallest to the largest 4. A
Advanced Supply Demand MT5
Bernhard Schweigert
4.5 (14)
任何新手或专业交易者的最佳解决方案! 该指标是一款独特、高质量、且价格合理的交易工具,因为我们已经整合了许多专有功能和新公式。 依据此更新,您将能够显示双重时间帧区域。 您不仅可以显示一个较高的时间帧,还可以同时显示图表时间帧,加上更高的时间帧:显示嵌套时区。 供需双方所有交易者都会喜欢它。 :) 重要信息披露 高级供需的最大潜力,请访问 https://www.mql5.com/zh/blogs/post/720245   想象您的交易如何得以改善,是因为您能够精准定位入场或目标位吗? 构建于新的底层算法,它可以更轻松地识别出买卖双方之间的潜在失衡。 这是因为它以图形方式展示供需最强劲区域,及其过去的表现(显示旧区域)。 这些功能旨在帮助您更轻松地发现最佳入场区域和价位。 现在您可以针对您的交易品种和时间帧来优化和编辑区域强度! 高级供需指标适用于所有产品和时间帧。 它是一个新的公式,非常新的功能是两个区域强度函数可由用户输入进行调整! 这在交易中是一大优势。 当您学习如何使用专有功能,例如带有价格游离最小 X 因子的区域强度时,您能够判断该区域强劲与否。 供需区域用作警报触发器
PTS - Divergence Buy Finder 由Precision Trading Systems制作 Precision Divergence Finder旨在精确找到市场底部,并经常成功。在技术分析中,挑选底部通常比挑选顶部容易得多,这个工具正是为了完成这个任务而设计的。在识别出牛市背离后,等待趋势上升再购买是明智的。您可以使用10或20个周期的最高点进场,或者使用15-30周期的移动平均线上升来识别趋势变化。 这个复杂的算法会实时逐根柱状图寻找并计算活跃的需求指数背离的数量。 该模型观察市场价格何时创出新低,而需求指数未创新低,从而产生背离。 该指标使用两个设置。     • 需求指数(DI)长度,它将为指标提供寻找的对象,并将为您选择的长度上的任何DI背离进行查找。     • 差异,这是[DI值现在]与[DI值长达200个周期以前]之间的背离量,对于它从各种回望期间找到的每个背离,它将在指标窗口中生成[1]输出。 最多检查20个周期,最大输出值将显示为20。 建议的设置 需求指数长度从15到100都可以使用,但最佳范围在20到60之间。 背离的差异为0.1至2
Elliott Wave Trend MT5
Young Ho Seo
4 (3)
Elliott Wave Trend was designed for the scientific wave counting. This tool focuses to get rid of the vagueness of the classic Elliott Wave Counting using the guideline from the template and pattern approach. In doing so, firstly Elliott Wave Trend offers the template for your wave counting. Secondly, it offers Wave Structural Score to assist to identify accurate wave formation. It offers both impulse wave Structural Score and corrective wave Structure Score. Structural Score is the rating to sh
PZ Day Trading MT5
PZ TRADING SLU
2.83 (6)
该指标仅使用价格行为分析和donchian渠道以锯齿形检测价格反转。它是专门为短期交易而设计的,根本不需要重新粉刷或补漆。对于精明的交易者来说,这是一个绝佳的工具,旨在增加他们的运作时间。 [ 安装指南 | 更新指南 | 故障排除 | 常见问题 | 所有产品 ] 极易交易 它在每个时间段都提供价值 实施自我分析统计 它实现了电子邮件/声音/视觉警报 基于可变长度的突破和拥挤区域,该指标仅使用价格行为来选择交易并对市场快速做出反应。 显示过去信号的潜在利润 该指标分析其自身的质量和性能 突围的损失突出显示并解决 该指标是不可重涂和不可重涂的 该指标将帮助盘中交易者不要错过单个价格反转。但是,并非所有价格反转都是一样的,也不是具有相同的可行质量。决定要突破哪些突破而忽略哪些取决于交易者的良好判断。 如何解释统计数据 该指标研究其自身信号的质量,并在图表上绘制相关信息。将分析每笔交易,并在图表的左上角显示总体历史结果,这使您可以针对任何给定的工具和时间范围自行优化指标参数。每个乐器和时间表都有其自己的最佳设置,您可以自己找到它们。 最大优惠交易:对于任何给定的交易,MFE都是
精密指数振荡器(Pi-Osc)由Precision Trading Systems的Roger Medcalf开发 版本2经过精心重新编码,以在您的图表上加载速度非常快,还加入了一些其他技术改进,以提高体验。 Pi-Osc旨在提供准确的交易定时信号,旨在找到极端的耗尽点,这些点是市场被迫去触及,以清理每个人的止损单。 该产品解决了一个古老的问题,即知道极端点在哪里,这使得交易员的生活变得更加简单。 这是一个高度复杂的共识指标,与行业标准的振荡器相比,具有一些强大的区别。 它使用的一些特征包括需求指数、资金流动、RSI、随机指标、模式识别、成交量分析、标准偏差极端点以及不同长度上述各种变化的分歧。 乍一看,对于未经培训的人来说,它似乎与任何其他振荡器没有什么不同,但当与其他振荡器(如RSI或动量等)相对比时,这个指标的真正威力开始显现。 据我所知,没有其他振荡器可以频繁地精确指出顶部和底部,具有相同的定期效率。 精密指数振荡器由许多不同的数学方程组成,用于测量多个时间框架采样中的价格和成交量变动,从而高度准确地预测趋势可能发生转折的位置。 PTS P
MTF Supply Demand Zones MT5
Georgios Kalomoiropoulos
5 (1)
下一代自动化供需区。适用于任何图表的创新算法。所有区域都是根据市场的价格行为动态创建的。 两种类型的警报 --> 1) 当价格触及区域时 2) 当新区域形成时 你不会再得到一个无用的指标。您将获得一个完整的交易策略和经过验证的结果。     新的功能:     价格触及供需区时发出警报     创建新的供应/需求区时发出警报     推送通知警报     以点为单位的区域宽度标签     关于 MTF 的又一个时间表。因此,现在您将能够看到高于当前 3 个时间帧,而不是高于当前 2 个时间帧     启用/禁用警报/区域/MTF 功能的按钮 您获得的优势:     消除交易中的情绪。     客观化您的交易条目。     通过高概率设置提高您的利润。     节省绘图区域的时间。     像专业人士一样交易金融市场。     任何市场的即时多时间框架分析。 你在图表上看到了什么?     蓝色和红色矩形是当前时间范围的供需区。     虚线
FxaccurateLS
Shiv Raj Kumawat
WHY IS OUR FXACCCURATE LS MT5 THE PROFITABLE ? PROTECT YOUR CAPITAL WITH RISK MANAGEMENT Gives entry, stop and target levels from time to time. It finds Trading opportunities by analyzing what the price is doing during established trends. POWERFUL INDICATOR FOR A RELIABLE STRATEGIES We have made these indicators with a lot of years of hard work. It is made at a very advanced level. Established trends provide dozens of trading opportunities, but most trend indicators completely ignore them!
Super Magic NASDAQ100
Benyamin Naser Mokhtari Karchegani
您现在拥有的指标无疑是 在NASDAQ 100市场中 进行1分钟和5分钟交易的最佳工具之一。虽然它也适用于其他时间框架,但它是专门为这两个时间框架设计的。该指标设计精确, 无需初始设置 —只需运行它并信任它的信号。 准确性和效率 该工具经过严格校准,结合了多个 经过黄金比例优化 的指标,专门用于NASDAQ。它在过去一年中进行了严格的测试,并持续显示盈利能力。与市场上的许多指标不同,这个指标确实旨在支持您实现 持续的盈利交易 。 盈利性和投资回报 该指标的一大特点是其 快速的投资回报 。在几次成功交易之后,您投资于该工具的费用将迅速得到回报。该指标不仅提供 精确的入场信号 ,还帮助您在最佳时机退出,以最大化利润。 魔法三重策略NASDAQ 该指标是称为魔法三重策略NASDAQ 100的 三指标系统 的一部分。当前指标是 该策略的主要组成部分 ,为您提供实现自信交易所需的 准确性和精确性 。 如何使用及交易指南 要开始交易,首先从 Super Magic Moving Pro 获取 初始信号 。一旦第一根蜡烛完全穿越了 移动平均线 ,并且指标的直方图确认了颜色变化,那就是入场交易的理想时
Hurst Cycles Diamonds
Fillipe Dos Santos
Hurst Cycles Diamonds Description This indicator is an alternative version inspired by the pioneering work of David Hickson and the Hurst Cycles Notes indicator developed by Grafton. The main objective is to provide a clear and intuitive view of the Hurst cycles. Credits Original Concept : David Hickson - Hurst Cycles Theory Inspiration : Grafton - Hurst Diamond Notation Pivots Alternative Version : Fillipe dos Santos Main Features Identifies and displays pivots in multiple time cycles Visual t
PZ Swing Trading MT5
PZ TRADING SLU
5 (5)
Swing Trading 是第一个旨在检测趋势方向的波动和可能的反转波动的指标。它使用在交易文献中广泛描述的基准摆动交易方法。该指标研究多个价格和时间向量,以追踪总体趋势方向,并检测市场超卖或超买并准备好进行修正的情况。 [ 安装指南 | 更新指南 | 故障排除 | 常见问题 | 所有产品 ] 市场波动的利润不会被窃取 指示器始终显示趋势方向 彩色价格带代表机会基准 彩色虚线表示可能的反转波动 该指标分析其自身的质量和性能 它实现了一个多时间仪表板 可定制的趋势和波动周期 它实现了电子邮件/声音/推送警报 指示器为非重涂或重涂 什么是摇摆交易 摇摆交易是一种尝试在一天到一周内从证券中获得收益的交易方式,尽管某些交易最终可以保持更长的寿命。摇摆交易者使用技术分析来买入弱点和卖出力量,并有耐心等待这些机会的发生,因为在发生一波抛售浪潮之后购买证券而不是陷入抛售更有意义。 机会基准 关于历史数据的大量研究证明,适合于波动交易的市场倾向于在基线价格带上下交易,基线价格带由图表显示,使用平均真实区间计算得出。波动交易者使用基线,该策略是购买常态和卖出躁狂,或做空常态并掩盖沮丧。
20 Sources, Non-Repainting, Fast Performance Introducing the All-In-One Supertrend: my first attempt at creating the ultimate trading tool. Designed with flexibility and customization in mind, each source is fully adjustable and integrates seamlessly with the others, allowing you to craft a strategy that fits your unique trading style, without compromising on speed or performance. Note : Each indicator is clear and straightforward -- no black-box methods or gimmick names (like I have seen on
作者的更多信息
All in One Trade
Alexey Minkov
4.48 (27)
!!!CHRISTMAS SALE!!! The All-in-One Trade Indicator (AOTI) determines daily targets for EURUSD, EURJPY, GBPUSD, USDCHF, EURGBP, EURCAD, EURAUD, AUDJPY, GBPAUD, GBPCAD, GBPCHF, GBPJPY, AUDUSD, and USDJPY. All other modules work with any trading instruments. The indicator includes various features, such as Double Channel trend direction, Price channel, MA Bands, Fibo levels, Climax Bar detection, and others. The AOTI indicator is based on several trading strategies, and created to simplify market
Scalper Inside PRO
Alexey Minkov
4.75 (59)
!!!CHRISTMAS SALE!!! An exclusive indicator that utilizes an innovative algorithm to swiftly and accurately determine the market trend. The indicator automatically calculates opening, closing, and profit levels, providing detailed trading statistics. With these features, you can choose the most appropriate trading instrument for the current market conditions. Additionally, you can easily integrate your own arrow indicators into Scalper Inside Pro to quickly evaluate their statistics and profitab
Reversal Master
Alexey Minkov
4.92 (12)
!!!CHRISTMAS SALE!!! The Reversal Master is an indicator for determining the current direction of price movement and reversal points. The indicator will be useful for those who want to see the current market situation better. The indicator can be used as an add-on for ready-made trading systems, or as an independent tool, or to develop your own trading systems. The Reversal Master indicator, to determine the reversal points,  analyzes a lot of conditions since the combined analysis gives a more
Color Trend FX
Alexey Minkov
4 (4)
!!!CHRISTMAS SALE!!! The Color Trend FX indicator shows on the chart the accurate market entry points, accurate exit points, maximum possible profit of a deal (for those who take profit according to their own system for exiting deals), points for trailing the open positions, as well as detailed statistics. Statistics allows to choose the most profitable trading instruments, and also to determine the potential profits. The indicator does not redraw its signals! The indicator is simple to set up a
筛选:
Alberto Gauer Borrego
6901
Alberto Gauer Borrego 2024.07.26 13:11 
 

Not only the indicator gives very good trend signals, but the support and attention given by the dev Alexey is also superb, thanks buddy

amnonwr2 Waskar
235
amnonwr2 Waskar 2024.07.24 20:08 
 

working very well thanks for the product

Steffen Schmidt
342
Steffen Schmidt 2024.06.21 22:05 
 

I am without doubt, this is the most superior, excellent and outstanding software indicator for MT5 for a fraction of the price the big guys are charging, it’s your chance to acquire this valuable trading software now. It’s the closest thing to Holy Grail, still within 97%-99.99% chance of succeeding.

Wolfgang Rockert
2318
Wolfgang Rockert 2023.12.26 12:53 
 

The indicator provides good results, but you should stick to the rules that the author has posted as examples...

Harakty
348
Harakty 2023.12.10 02:05 
 

Another excellent product by Alexey. I integrated the Trend Forecaster with my SCM/ITC strategies and it works very well. Perhaps S/D/ FVG and other SMC features could be part of future versions!

Marcos Yuge
644
Marcos Yuge 2023.11.15 09:54 
 

In my daily analyzes I always use tools that help with decision making. And from time to time, I always look for other products that can further improve my strategy. I saw that the author had developed TREND FORECASTER and in the description I realized that it would fit into my strategies. I contacted the author and in his response I was really convinced that it was important to have this tool. In my first analysis using TREND FORECASTER I was impressed with the results. Easily answer 3 questions that greatly increase the chance of success: Does the market have room to move at the moment I am evaluating the asset? What is the predominant trend? What are my chances of success if I choose to trade this asset? Therefore, in my humble opinion, it was well worth the investment. It wasn't a blind purchase, because I already knew the author's work. I purchased the other 4 products he created and each of them, by using a different algorithm from the other, always made decision making easier. Because only when the tools show convergence with my strategy do I open trade. In other words, I have proven in practice that the tools he creates are really worth the investment. Was TREND FORECASTER worth buying? Absolutely. Finally, a few words about the author. Very accessible to answer questions. It doesn't try to sell you the product at any cost. There is a lot of material he presents to help you understand how each tool works. I learned a lot about market analysis with this material. Conclusion: The author provides an excellent product, with exceptional after-sales service. If you are unsure whether this is the right product for you, I recommend that you contact the author. Tell us what you expect from the product and it will guide you as to whether the tool is suitable for your trading style. Whatever the answer, he will always be honest.

Alexey Minkov
12062
来自开发人员的回复 Alexey Minkov 2023.11.17 12:00
Thank you for such a detailed and pleasant review of my products and about me. ❤️ Your support is very important to me because it shows that I am moving in the right direction and creating products that are beneficial to my friends and customers. There is still much more exciting ahead, as I always have many ideas. Good luck to you in your business!
回复评论
版本 2.3 2024.12.23
▪ Fixes for improved compatibility with the latest terminal builds
版本 2.2 2024.06.02
▪ Added a new feature for more fine-tuning of the indicator - details will be in the manual

▪ Other improvements in the code
版本 2.1 2024.01.28
▪ Fixed an issue with the probability of premature calculations in the process of launching and updating the terminal

▪ Improved optimization of interaction between Trend Forecaster and Trend Forecaster Dashboard

▪ Other improvements in the code
版本 2.0 2023.11.11
▪ Improved interaction between Trend Forecaster and Trend Forecaster Dashboard

▪ Added color hint of global trend on higher time frames in the HTF-Mode of the TFC Dashboard

▪ Optimization of internal algorithms

▪ Other improvements in the code
版本 1.12 2023.10.25
▪ The ability to use the Trend Forecaster Dashboard as an MTF (Multiple Time Frame) filter for the current financial instrument has been added

▪ Other improvements in the code
版本 1.1 2023.10.22
▪ Minor fixes to the code