• 概述
  • 评论
  • 评论
  • 新特性

Gsc

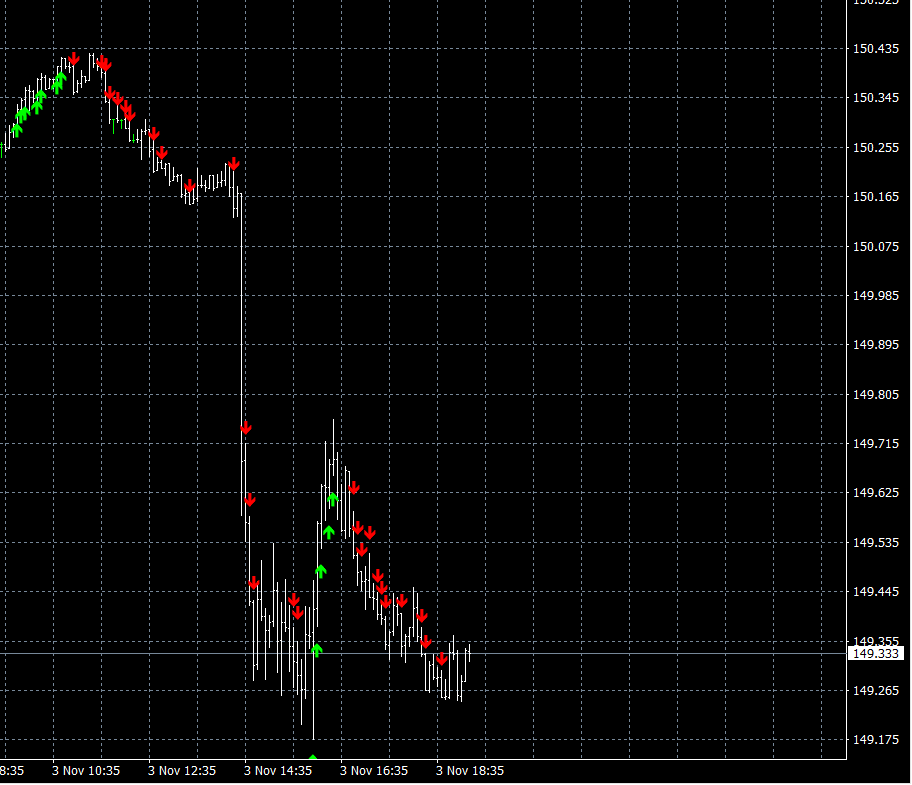
Homemade Indicator using specific price action system to find suitables buys and sell ideas.

*It is very easy to use

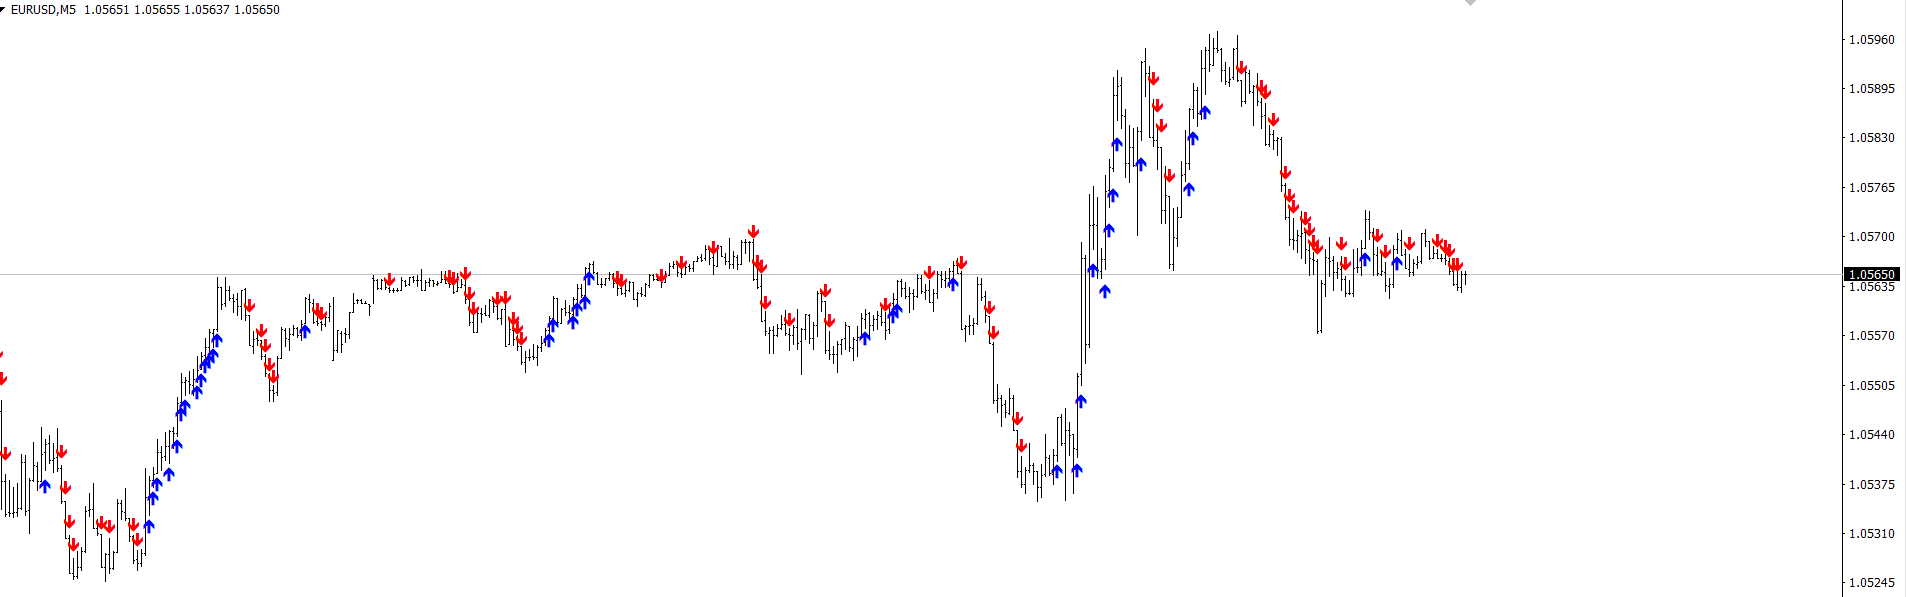
*Ideal on 5mn timeframe (where i personnally use it)

*It does NOT repaint

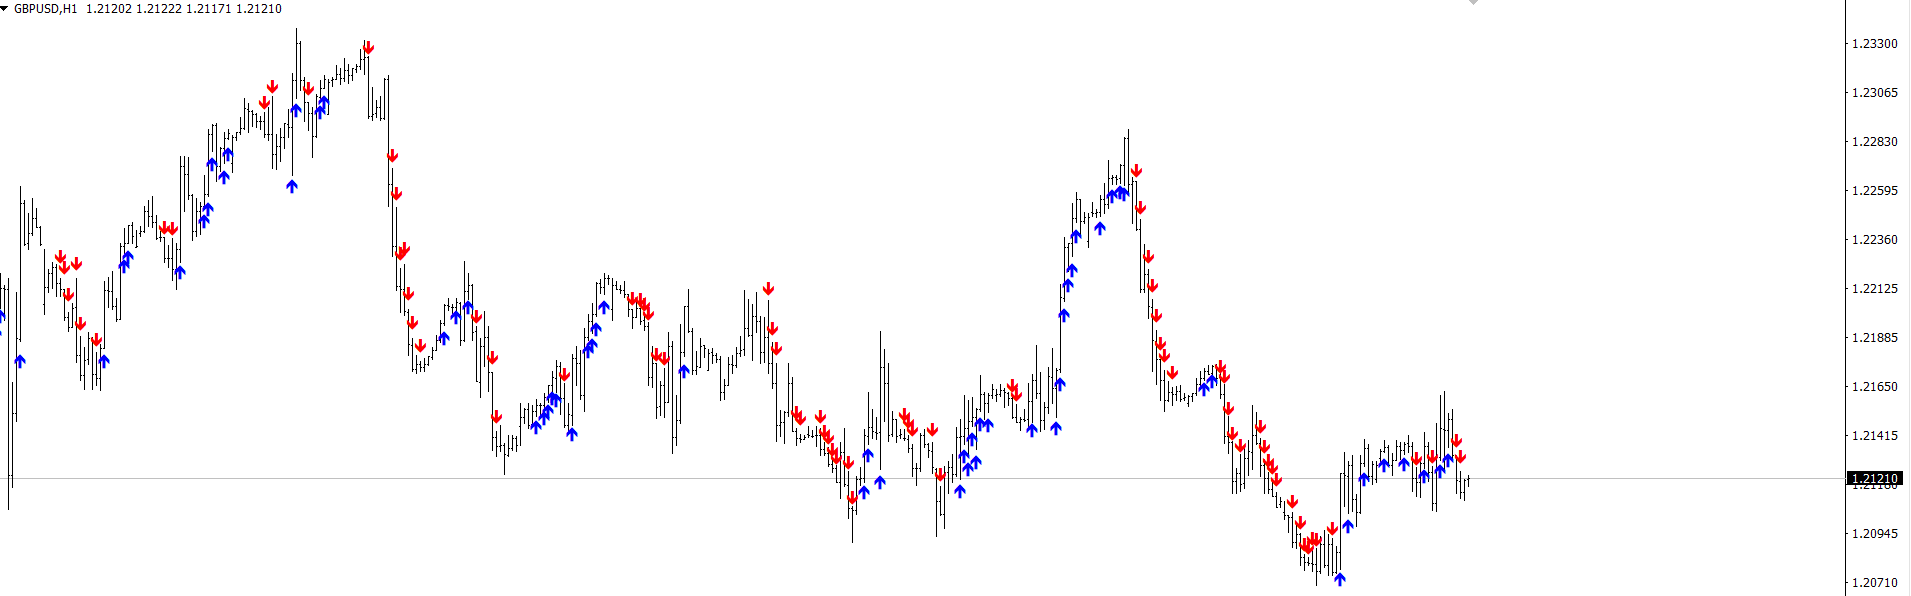
*It works on every timeframes

*There are a lot of setups of buys and sell everyday

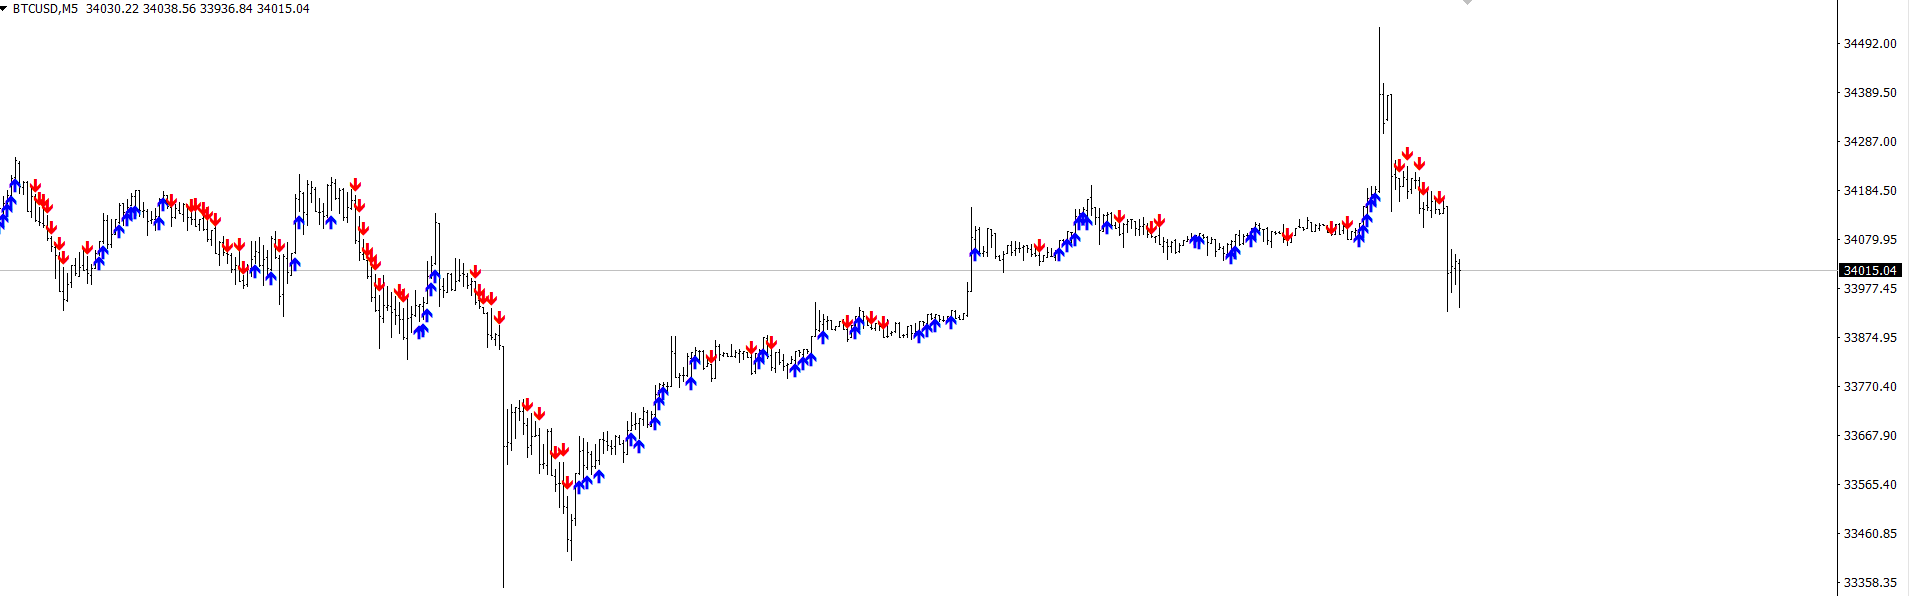
*The loss are VERY smalls compared to profits

*It works very well on volatile markets


More ideas to come soon :

-Possibilities of changing setups

-Take profits spot

-Alerts

-etc...

推荐产品
Before
Nadiya Mirosh
The Before indicator predicts the most likely short-term price movement based on complex mathematical calculations. Most of the standard indicators commonly used in trading strategies are based on fairly simple calculations. This does not mean that there were no outstanding mathematicians in the world at the time of their creation. It is just that computers did not yet exist in those days, or their power was not enough for the sequential implementation of complex mathematical operations. Nowa
PipMaster is built using a powerful trend + momentum following algorithm. Made after years of testing and with market noise filtering built-in.  Aggressive traders can enter a trade as soon as an arrow appear. Conservative traders should wait for a visual alert after a closed candle bar. This indicator is a great tool to be used with your most trusted trend/momentum trading strategy and with solid money management rules. Key Benefits: -Super easy to use by following color coded arrow pointing
Power Renko MT4
Pierce Vallieres
Power Renko is an indicator which plots Renko bricks underneath the chart using a histogram. You can select the brick size and the timeframe of the Renko bricks as well as whether or not to use the close price or the high/low price of the candles. Renko bricks are based on price alone, not time, therefor the Renko bricks will not be aligned with the chart's time. They are extremely useful for trend trading and many different strategies can be formed from them. Buffers are provided allowing you t
RaysFX Candlestick Signals RaysFX Candlestick Signals è un potente strumento progettato per migliorare la tua esperienza di trading su MT4. Questo indicatore personalizzato è stato sviluppato con l’obiettivo di fornire segnali di trading precisi e tempestivi basati su specifiche configurazioni di candele e l’indicatore RSI. Caratteristiche principali : Segnali di acquisto e vendita : L’indicatore genera segnali di acquisto e vendita basati su specifiche configurazioni di candele e valori dell’
Find and fill Gaps
Leandro Oliveira
This indicator shows the gaps on the current chart with a rectangle shape and indicates when the gap is filled by closing the shape. Gaps are considered over the shadows. Allows sending alerts by e-mail or push notifications when a gap is found. Parameters SizeGAP - Size of the gap that you want to indicate; HGcolor1 - Color of the gap in an upward movement; HGcolor2 - Color of the gap in a downward movement; HGstyle - The style of rectangle to be drawn; StartCalculationFromBar - How many cand
Fourteen plus nine TD Sequential
MOHAMMED IMAD HUSSEIN BASSEE
Fourteen plus nine What is it for? Applying Tom DeMark’s TD Sequential serves the purpose of identifying a price point where an uptrend or a downtrend exhausts itself and reverses. . What are the main components of TD Sequential? TD Sequential has two parts – TD Setup and TD Countdown. The first phase of TD Sequential starts with a TD Setup and is completed with a 9 count. When the 9 count is completed, it is at that point, a price pause, price pullback, or reversal is likely. It is also at tha
Reback
Yazhou Liu
本指标可回溯历史交易,可以一目了然的看到交易位置,交易类型及盈亏情况,还有统计信息。 showlabel用于是否显示统计信息,summary_from是订单统计的开始时间,该参数以订单开仓时间为准。 回溯历史可以帮助我们纠正曾经错误的交易习惯,对于学习手动交易的新手极为重要。 本指标适用于各个时间周期,通过交易标识和划线能非常明显地看出各个订单的具体交易情况,可作为信号卖家的辅助工具使用。         即使加载到当前图标中也能实时看到当前订单的下单位置及盈亏情况。        即使加载到当前图标中也能实时看到当前订单的下单位置及盈亏情况。 本指标可回溯历史交易,可以一目了然的看到交易位置,交易类型及盈亏情况,还有统计信息。 showlabel用于是否显示统计信息,summary_from是订单统计的开始时间,该参数以订单开仓时间为准。 回溯历史可以帮助我们纠正曾经错误的交易习惯,对于学习手动交易的新手极为重要。 本指标适用于各个时间周期,通过交易标识和划线能非常明显地看出各个订单的具体交易情况,可作为信号卖家的辅助工具使用。
Good Filtr
Artem Kuzmin
This is an indicator for additional signal filtering. It can be used as an additional filter in a trading system. The indicator does not redraw its data and can be used both in forex trading and with binary options. It has 3 operation modes and flexible sensitivity settings. The indicator uses multiple buffers, therefore it can be easily used in various Expert Advisors.
Introduction to Smart Renko The main characteristics of Renko Charting concern price movement. To give you some idea on its working principle, Renko chart is constructed by placing a brick over or below when the price make the movement beyond a predefined range, called brick height. Therefore, naturally one can see clear price movement with less noise than other charting type. Renko charting can provide much clearer trend direction and it helps to identify important support and resistance level
SUPER SALE! --> BUY Trend Reader Indicator with -$180 OFF and GET a BONUS EA: News Scope EA PRO with AMAZING results! NOTE: Trend Reader Indicator PROMO price: $117 (The next price $297) - The offer ends soon! Click here to check News Scope EA PRO results and learn more about the promotion! Trend Reader Indicator is a revolutionary trading indicator designed to empower forex traders with the tools they need to make informed trading decisions. This cutting-edge indicator utilizes complex mathema
Renko指标是一种技术分析工具,用于外汇市场中可视化价格变动和趋势,消除市场“噪音”。与传统的K线图或柱状图不同,Renko是基于价格变化的指定点数(称为“砖块大小”)来构建的。当价格移动到这一点数时,图表上会添加一个新的“砖块”。此指标忽略时间和成交量,专注于价格变化。Renko指标的主要特点包括: 噪音过滤 :由于Renko过滤器忽略了微小的价格波动,它帮助交易者更好地识别主要趋势和反转。 趋势识别 :由于砖块的清晰可见,识别上升和下降趋势变得更容易。 进出场信号 :该指标可用于生成交易信号。例如,砖块颜色的变化可以作为买入或卖出的信号。 适应性 :交易者可以根据他们的偏好和市场条件调整砖块大小。较小的砖块大小提供更详细的图像,但可能会有更多的噪音,而较大的砖块大小显示主要的价格运动,但可能会遗漏较小的趋势。 Renko指标对长期交易者和喜欢趋势交易的交易者特别有用,因为它有助于忽略不重要的价格波动,专注于重要的价格变动。 指标设置: RenkoBoxSize :Renko砖块的大小。 UpColor :买入信号的Renko线颜色。 DownColor :卖出信号的Renko线颜
Trade Direction
Gevorg Hakobyan
5 (1)
The oscillator shows trend direction using its own algorithm, which is based on calculating price values ​​by analyzing prices of separate currencies (original valuation of currencies). The histogram shows the average value of physical price change over the selected period. When the histogram has a positive value, the trend is rising, if negative - the trend id falling. The indicator uses standard RSI to determine the current market direction on a selected period as follows: the default value of
ADM Multiframe
Dmitriy Susloparov
ADM Oscillator Multiframe Unlike the classic indicator " Average Direction Movement index ", this indicator shows directly the difference between the +DI and -DI values. When +DI is greater than -DI results above zero and vice versa. This is more visual and, in addition, allows you to clearly see the interaction of indicator readings for different timeframes. It also uses a proprietary technology that allows you to see different timeframes simultaneously on a single time scale. For example, f
Owl smart levels
Sergey Ermolov
4.63 (54)
MT5版本  |  FAQ Owl Smart Levels Indicator   是一個完整的交易系統,包含   Bill Williams   的高級分形、構建正確的市場波浪結構的 Valable ZigZag 以及標記準確入場水平的斐波那契水平等流行的市場分析工具 進入市場和地方獲利。 策略的详细说明 指示灯使用说明 顾问-贸易猫头鹰助手助理 私人用户聊天 ->购买后写信给我,我会将您添加到私人聊天中,您可以在那里下载所有奖金 力量在於簡單! Owl Smart Levels   交易系統非常易於使用,因此適合專業人士和剛開始研究市場並為自己選擇交易策略的人。 策略和指標中沒有隱藏的秘密公式和計算方法,所有策略指標都是公開的。 Owl Smart Levels 允許您快速查看進入交易的信號,突出顯示下訂單的水平並向您發送有關已出現信號的通知。 優點很明顯: 清楚地顯示主要和更高時間框架的趨勢方向。 指示儀器信號的出現。 標記開單、止損設置和固定利潤的水平。 沒有多餘的,只有必要的結構! ZigZag   表示全球趨勢的方向,因此也表示貿易方向。 市場反轉點的短線清楚地表明在
Infinity Trend Pro
Yaroslav Varankin
1 (1)
This is a trend indicator without redrawing Developed instead of the binary options strategy (by the color of the Martingale candlestick) Also works well in forex trading When to open trades (binary options) A signal will appear in the place with a candle signaling the current candle It is recommended to open a deal for one candle of the current timeframe M1 and M5 When a blue dot appears, open a deal up When a red dot appears, open a trade down. How to open trades on Forex. When a signal is rec
Velas RENKO
Ramon Sobrevals Arce
Immediately plots renko bars in an external/indicator window.  One of the distinctive advantages Renko charts offer is the fact that they are not time dependent. Therefore, the new Renko blocks are only traced when the price moves higher or lower by the specified number of points.  For example, a 10 pip (100 points) Renko chart would plot the blocks when price moves 10 pips higher in an uptrend or 10 pips lower in a downtrend. Renko charts removes "noises" from the Market and i t helps to ident
Chaser
Thebo Junior Mahlangu
1 (1)
Introduction  This Indicator Is Based On Average Price/Maximum Price Moves, And Using Moving Bollinger Bands And Moving Averages. The Advantage Of Using It With YOUR own Analysis Will Confirm Potential Supports And Resistances While it Compliments With Your Analysis  The Indicator Is Non-Repainting AND Along With Our Special Trend METRE that Changes With The Conditions OF A Bullish Or Bearish Trend....  Recommend Time-Frames: H1  H4 M15 Usage: The Indicator Is Very Profitable I
FREE
Trendiness Index
Libertas LLC
5 (3)
"The trend is your friend" is one of the best known sayings in investing, because capturing large trendy price movements can be extremely profitable. However, trading with the trend is often easier said than done, because many indicators are based on price reversals not trends. These aren't very effective at identifying trendy periods, or predicting whether trends will continue. We developed the Trendiness Index to help address this problem by indicating the strength and direction of price trend
Renko Bars 3in1
Yuriy Shatsckiy
5 (2)
The Renko_Bars_3in1 is designed for plotting 3 types of Offline Renko charts. Standard Renko Bar (the reversal bar is twice the size of the bar). Renko Range Bar (the size of all bars is the same). Renko Bars with the ability to adjust the size of the reversal bar. Attention : The demo version for review and testing can be downloaded here . Note . A chart with the M1 period is necessary to build an offline chart. When the indicator is attached to a chart, the offline chart is opened automaticall
FreqoMaster
Stanislav Korotky
The main idea of this indicator is rates analysis and prediction by Fourier transform. The indicator decomposes exchange rates into main harmonics and calculates their product in future. The indicator shows 2 price marks in history, depicting price range in the past, and 2 price marks in future with price movement forecast. Buy or sell decision and take profit size are displayed in a text label in the indicator window. The indicator uses another indicator as an engine for calculations - FreqoMet
Renko, Heiken Ashi, Ticks Bar, Range Bar.    Easy switching, easy setup, all in one window.        Place the Custom Chart indicator and view Renko, Heiken Ashi, Tick bar, Range bar charts in real time at real chart.    Position the offline chart window so that the indicator control panel is visible.    Switch the chart mode by click of a button.    Connect to the output chart any indicator, expert advisor without any restrictions.    No, it doesn't work in the tester.    Yes, you can use an
VR Cub
Vladimir Pastushak
VR Cub 这是获得高质量切入点的指标。该指标的开发是为了促进数学计算并简化对仓位入场点的搜索。多年来,该指标所针对的交易策略已被证明其有效性。交易策略的简单性是其巨大的优势,即使是新手交易者也能成功进行交易。 VR Cub 计算开仓点以及获利和止损目标水平,这显着提高了效率和易用性。查看使用以下策略进行交易的屏幕截图,了解简单的交易规则。 设置、设置文件、演示版本、说明、问题解决,可以从以下位置获取 [博客] 您可以在以下位置阅读或撰写评论 [关联] 版本为 [MetaTrader 5] 计算入场点的规则 开仓 要计算入场点,您需要将 VR Cub 工具从最后一个高点拉伸到最后一个低点。 如果第一个点在时间上早于第二个点,交易者等待柱线收于中线上方。 如果第一个点在时间上晚于第二个点,交易者等待柱线收于中线下方。 根据上述条件,严格在 柱线收盘 后建仓。 换句话说,如果我们在小时图上进行交易,那么从最高点到最低点的时间距离必须超过24小时,最高点和最低点之间的点数必须大于或等于平均价格变动每天。 维持和改变市场地位 可以有多个未平仓头寸;每个头寸都可以单独修改。 VR Cu
RenkoMaPriceChannel
Sergey Deev
1 (1)
The indicator displays Renko bars on the chart, uses their data to calculate and display the moving average, PriceChannel and generates buy/sell signals. Renko is a non-trivial price display method. Instead of displaying each bar within a time interval, only the bars where the price moved a certain number of points are shown. Renko bars do not depend on a time interval, therefore the indicator works on any timeframe without losing its efficiency. The PriceChannel indicator displays the upper, lo
Teknolojide ki yüksek gelişim, üretim, e ticaret, lojistik vb tüm sektörlerde kullanıma başlandığı gibi artık finansal piyasalarda da “ yapay zeka ve algoritma” kullanılmaya başlandı. Smart Algoritma indikatörü; kaynak kodu içinde yer alan algoritma ve yapay zekası ile hiçbir analize ihtiyaç duyulmadan gün içi bütün forex enstrümanları için size buy ve sell sinyalleri yanında hedef kanal (gün içi en yüksek ve en düşük seviyeler) verir. İndikatör texti aşağıda ki bölümlerden oluşur ve herkesin a
Ultimate Renko
Artur Zas
4.58 (12)
Ultimate Renko is a full implementation of a robust Renko style charting solution for MT4. It enables creating custom live charts resembling Median Renko , Mean Renko , Turbo Renko , and Better Renko candles as well as Vanilla Renko and Renko with wicks , PointO charts, and many more. This all-in-one package provides all of the signals needed by day traders, scalpers, and even long-term traders. You can apply all of the standard and custom indicators and technical studies as well as templates to
RSI TrendLine Divergency Message is an indicator for the MetaTrader 4 trading platform. Unlike the original indicator, this three in one version has a system of alerts that inform on market situation changes. It consists of the following signals: when the Main line crosses the levels of extreme zones and 50% level; when the Main line crosses the Trend line in the indicator window; divergence on the last bar. Parameters of levels of extremum, 50-level and divergence are adjustable. Parameters L
Master scalping M1
Nataliia Marchuk
Master Scalping M1 is an innovative indicator that uses an algorithm to quickly and accurately determine the trend.The indicator calculates the time of opening and closing positions, the indicator's algorithms allow you to find the ideal moments to enter a deal (buy or sell an asset), which increase the success of transactions for most traders. Benefits of the indicator: Easy to assemble, does not overload the chart with unnecessary information. Can be used as a filter for any strategy. Works on
"Bitcoin indicator" is a ready-made mechanical trading system for Bitcoin. The system is implemented as an indicator that shows the trader on the chart the price reversal points and the current trend direction. This information is enough to effectively trade in the market. The "Bitcoin indicator" consists of a complex analytical block that constantly analyzes the market and shows the trader where the trend is heading. The indicator also shows with dots on the chart, the price reversal points. S
The indicator shows entry points with Risk-Reward-Ratio 1 to 5. Main timeframe H1. Works on every pair. The main logic - is to find a reversal level, and then track the price reaction to this level. Doesn't need any settings. As a standard, it paint 5 levels of the same take-profit (red / blue for sellers and buys) and 1 stop-loss level - orange. ATTENTION! The full version of indicator. You can t est full work of indicator free only on the USDCAD pair here  https://www.mql5.com/en/market/produ
RenkoMaStoch
Sergey Deev
1 (1)
The indicator displays renko bars on a chart, uses them to plot the fast and slow moving average and Stochastic, as well as it provides buy/sell signals: a buy signal is generated when the fast moving is above the slow one, and the signal line of Stochastic crosses the lower level from bottom up; a sell signal is generated when the fast moving is below the slow one, and the signal line of Stochastic crosses the upper level from top to bottom; Renko is a non-trivial price display method. Instead
该产品的买家也购买
TPSpro RFI Levels
Roman Podpora
4.85 (20)
Reversal First Impulse levels (RFI)    INSTRUCTIONS        RUS       -       ENG              R ecommended to use with an indicator   -   TREND PRO -  Version MT5 A key element in trading is zones or levels from which decisions to buy or sell a trading instrument are made. Despite attempts by major players to conceal their presence in the market, they inevitably leave traces. Our task was to learn how to identify these traces and interpret them correctly. Main functions: Displaying active zones
Atomic Analyst
Issam Kassas
5 (3)
首先值得强调的是,该交易指标是非重绘、非延迟的指标,这使其成为手动和机器人交易的理想选择。 用户手册:设置、输入和策略。 Atomic Analyst是一种PA价格行动指标,利用价格的力量和动量来寻找市场上更好的机会。配备了高级过滤器,可帮助去除噪音和假信号,并提高交易潜力。使用多层复杂的指标,Atomic Analyst扫描图表,并将复杂的数学计算转化为任何初学者都能理解并用来做出一致交易决策的简单信号和颜色。 “Atomic Analyst”是专为新手和经验丰富的交易者量身定制的综合交易解决方案。它将高级指标和一流功能融合为一体的交易策略,使其成为所有类型交易者的多功能选择。 日内交易和剥头皮策略:专为快速准确的日内交易和短期交易而设计。 日内和摆动交易策略:可用作追求价格大幅波动的日内和摆动交易者的可靠工具。 多货币和市场:凭借其可靠的精度,在不同的工具和市场上运作。 多个时间框架:可在多个时间框架上使用,性能良好。 稳定性:所有指标均不重绘、不重绘和不滞后,确保可靠的信号。 信号清晰度:提供箭头信号,用于清晰的入场和出场点。 实时警报:通过交易入场、SL和TP警报通知交
TPSproTREND PrO
Roman Podpora
4.78 (18)
TPSpro TRENDPRO  - is a trend indicator that automatically analyzes the market and provides information about the trend and each of its changes, as well as giving signals for entering trades without redrawing! The indicator uses each candle, analyzing them separately. referring to different impulses - up or down impulse. Exact entry points into transactions for currencies, crypto, metals, stocks, indices!  -  Version MT5               DETAILED DESCRIPTION                R ecommended to use with
Enigmera
Ivan Stefanov
5 (3)
ENIGMERA:市场核心 https://www.enigmera.com 简介 该指标和交易系统是金融市场的一种非凡方法。ENIGMERA 利用分形周期精确计算支撑位和阻力位。它能显示真实的累积阶段,并给出方向和目标。 该系统无论在趋势中还是在修正中都能发挥作用。 它是如何运行的? ENIGMERA 由三条线组成:支撑/阻力线、目标线和偏离线。与一般市场指标将过去的数据推断为现在和未来的情况不同,该系统能提供当前的完整情况。如果你处于支撑位,这意味着真正的支撑;如果你处于阻力位,这意味着真正的阻力。如果突破某一水平,则表示趋势发生变化。没有重绘。 由于市场在不断变化,ENIGMERA 不断调整其评估工具,定期修改策略。  这保证了每种情况都能得到全面评估。这一市场指标的独特性显而易见,其能力不言而喻。  ENIGMERA 为金融分析师和咨询师提供服务,他们需要可靠的见解与客户分享,也为投资者提供服务,他们需要最精确和最可靠的保证。 该系统能够达到最佳精度,使交易者能够自信、清晰地评估他们的选择。 ENIGMERA 将 20 年的交易专长和知识整合到一个综合软件
Scalper Inside PRO
Alexey Minkov
4.74 (58)
An exclusive indicator that utilizes an innovative algorithm to swiftly and accurately determine the market trend. The indicator automatically calculates opening, closing, and profit levels, providing detailed trading statistics. With these features, you can choose the most appropriate trading instrument for the current market conditions. Additionally, you can easily integrate your own arrow indicators into Scalper Inside Pro to quickly evaluate their statistics and profitability. Scalper Inside
目前八折优惠! 对任何新手或专家交易者来说都是最好的解决方案! 这个仪表板软件适用于28种货币对。它基于我们的两个主要指标(高级货币强度28和高级货币冲动)。它对整个外汇市场提供了一个伟大的概述。它显示高级货币强度值,货币运动速度和28个外汇对在所有(9)时间段的信号。想象一下,当你可以使用图表上的单一指标观察整个市场,以确定趋势和或剥头皮的机会时,你的交易将得到改善 我们已经在这个指标中建立了一些功能,使你更容易识别强势和弱势货币,同时识别和确认潜在的交易。该指标以图形方式显示货币的强势或弱势是增加还是减少,以及它在所有时间段的表现。 增加的新功能是动态市场斐波那契水平,它适应当前的市场条件变化,这是一个已经在我们的高级货币强度28和高级货币冲动指标中使用的成熟的加分项。 在交易时,总是将弱势货币和强势货币配对,这个新指标将帮助你做到这一点。 用户手册:点击这里  https://www.mql5.com/en/blogs/post/708783 特点  显示每个时间段的ACS28和GAP-speed(冲动)的货币强度值。 列:颜色代码以7种颜色
FX Volume
Daniel Stein
4.6 (35)
通过 mql5 和 Telegram 上 的 " 晨间简报 "获取每日市场更新,包括详细信息和屏幕截图 ! 外汇交易量(FX Volume)是第一个也是唯一一个从经纪商角度真正洞察市场情绪的交易量指标。 直接在您的图表上看到这些信息是真正改变游戏规则和突破性的交易解决方案。 受益于独特的市场数据洞察,如 比率(Ratios )显示货币多头和空头头寸的比率(百分比 比率变化 显示所选时间段内的多头比率及其百分比变化 总交易量 显示货币的总交易量(多头和空头),以手为单位 多头 交易量显示货币所有多头头寸的交易量 空头 交易量显示所有货币空头头寸的交易量 净多头 显示净多头交易量,即所有多头头寸减去所有空头头寸(以手为单位)。 净多头百分比 显示货币净多头交易量的变化 请阅读我们的基本教程 -> "如何使用外汇交易量进行交易 " 获取更多信息,如常见问题、交易技巧和教程视频,请访问我们的 外汇交易量公共信息频道 请 安装并运行 SI Connect 以建立与我们数据中心的持续连接 背景信息 我们都知道,外汇是一个分散的市场。这就是为什么我们必须打破常规思维,开发一个独
TrendMaestro
Stefano Frisetti
5 (3)
note: this indicator is for METATRADER4, if you want the version for METATRADER5 this is the link:  https://www.mql5.com/it/market/product/108106 TRENDMAESTRO ver 2.4 TRENDMAESTRO recognizes a new TREND in the bud, he never makes mistakes. The certainty of identifying a new TREND is priceless. DESCRIPTION TRENDMAESTRO identifies a new TREND in the bud, this indicator examines the volatility, volumes and momentum to identify the moment in which there is an explosion of one or more of these data a
GOLD Impulse with Alert
Bernhard Schweigert
4.56 (9)
这个指标是我们2个产品 Advanced Currency IMPULSE with ALERT  +   Currency Strength Exotics 的一个超级组合。 它适用于所有时间框架,并以图形方式显示8种主要货币和一种符号的强势或弱势冲动! 该指标专门用于显示任何符号的货币强度加速,如黄金、异国货币对、商品、指数或期货。这是它的第一个指标,任何符号都可以被添加到第9行,以显示黄金、白银、石油、DAX、US30、MXN、TRY、CNH等的真实货币强度加速(冲动或速度)。 建立在新的基础算法上,它使识别和确认潜在的交易更加容易。这是因为它以图形方式显示了一种货币的强势或弱势是否正在加速,并测量了这种加速的速度--把它想象成你汽车中的速度表。当你加速时,事情显然会发生得更快,这在外汇市场上也是一样的,即如果你配对的货币正在向相反的方向加速,你就会发现一个潜在的有利可图的交易。 动态市场斐波那契28水平被用作警报触发器,将适应市场活动。如果冲动击中黄色触发线,你将收到警报。然后你就知道作为一个交易员应该做什么。货币对和方向已经给出。只需点击警报按钮,就可以
Quantum Trend Sniper Indicator MT4
Bogdan Ion Puscasu
4.6 (40)
介绍   量子趋势狙击指标 ,突破性的 MQL5 指标,正在改变您识别和交易趋势反转的方式!由拥有超过13年交易经验的资深交易员团队开发,     量子趋势狙击指标   旨在通过其创新的方式以极高的准确度识别趋势反转,将您的交易之旅推向新的高度。 ***购买量子趋势狙击指标,即可免费获得量子突破指标!*** 当量子突破指标识别出趋势反转时,它会向您发出警报和信号箭头,并建议您三个止盈水平。 它既适合新手交易者,也适合专业交易者。 量子 EA 通道:       点击这里 MT5版本:       点击这里 建议: 时间范围:  所有时间范围。为了获得最佳结果,我们建议在 M15、M30 和 H1 时间范围内使用它。 货币对:欧元兑美元、英镑兑美元、澳元兑美元、欧元兑英镑, EURAUD, XAUUSD 账户类型:ECN、Raw 或 Razor,点差极低 经纪时间:任意 经纪商:IC Markets、Pepperstone with Raw 和 Razor 的点差最低 建议止损:50 点 建议止盈水平:20 点、50 点和 1
ON Trade Optuma Astro
Abdullah Alrai
5 (4)
当然可以!以下是您提供的文本的中文翻译: 引入 MT4 天文指标:您的终极天体交易伙伴 您准备好将交易体验提升到天文高度了吗?不用再寻找,就在我们的革命性 MT4 天文指标中。这个创新工具超越了传统的交易指标,利用复杂的算法提供无与伦比的天文洞察力和精确计算。 指尖上的宇宙信息: 瞻仰一个详尽的面板,展示了一宝藏般的天文数据。了解行星的地理/太阳心坐标,太阳/地球距离,亮度,伸长度,星座,黄道和赤道坐标,甚至是水平坐标——每个细节都经过精心计算并呈现得美轮美奂。指标生成的垂直线对应于时间值,为您的交易旅程提供了宇宙的视角。 行星线条与关系: 在您的图表上欣赏行星线条的魔力,具有可自定义的比例和角度。通过直观的控制面板轻松切换每个行星线条的可见性。通过连结、六分、四分、三分、对冲和逆行等指标,发现行星关系的艺术。在您选择的时间范围内探索这些宇宙构造,使您能够识别重要的交易机会。 揭示甘恩的智慧: 通过受甘恩启发的平方垂直线揭示潜在的反转时机。这种创新修改将甘恩历经考验的原则带入现实,帮助您提前了解市场的转向和趋势。 月亮引导: 在您的图表上优雅地导航月相,因为新月和满月点缀其间。月亮周期
Currency Strength Exotics
Bernhard Schweigert
4.88 (33)
目前8折优惠! 对任何新手或专家交易者来说都是最好的解决方案! 这个指标是专门用来显示任何符号的货币强度,如异国货币对、商品、指数或期货。它是同类产品中的第一个,任何符号都可以添加到第9行,以显示黄金、白银、石油、DAX、US30、MXN、TRY、CNH等的真实货币强度。这是一个独特的、高质量的、负担得起的交易工具,因为我们已经纳入了一些专有的功能和一个新的公式。想象一下,你的交易将如何改善,因为你能够准确地确定新趋势或剥头皮机会的触发点? 用户手册:点击这里   https://www.mql5.com/en/blogs/post/708876 它适用于所有时间框架。你将很快能够看到TREND! 根据新的基础算法设计,它使识别和确认潜在交易变得更加容易。这是因为它以图形方式显示了8种主要货币和一种符号的强弱。 该指标显示了8种主要货币(澳元加元瑞士法郎欧元英镑日元新西兰美元)的强弱线,再加上一个符号! 该指标显示了符号的真实价值。例如:对于XAUUSD(黄金):价格以美元报价。如果黄金在上涨,你怎么能知道是黄金的强势还是美元的弱势?只有当黄金走强时,我们才会进行
ECM Channel MT4
Paulo Rocha
5 (1)
ECM Elite Channel is a volatility-based indicator, developed with a specific time algorithm, which consists of finding possible corrections in the market. This indicator shows two outer lines, an inner line (retracement line) and an arrow sign, where the channel theory is to help identify overbought and oversold conditions in the market. The market price will generally fall between the boundaries of the channel. If prices touch or move outside the channel, it's a trading opportunity. The
Indicator : RealValueIndicator Description : RealValueIndicator is a powerful tool designed specifically for trading on the EURUSD pair. This indicator analyzes all EUR and USD pairs, calculates their real currency strength values, and displays them as a single realistic value to give you a head start on price. This indicator will tell you moves before they happen if you use it right. RealValueIndicator allows you to get a quick and accurate overview of the EURUSD currency pair tops and bottoms,
Introduction to X3 Chart Pattern Scanner X3 Cherart Pattern Scanner is the non-repainting and non-lagging indicator detecting X3 chart patterns including Harmonic pattern, Elliott Wave pattern, X3 patterns, and Japanese Candlestick patterns. Historical patterns match with signal patterns. Hence, you can readily develop the solid trading strategy in your chart. More importantly, this superb pattern scanner can detect the optimal pattern of its kind. In addition, you can switch on and off individu
XQ Indicator MetaTrader 4
Marzena Maria Szmit
3.67 (3)
Step into the realm of Forex trading with confidence and precision using XQ, a cutting-edge Forex indicator designed to elevate your trading game to unprecedented heights. Whether you're a seasoned trader or just stepping into the world of currency exchange,   XQ Forex Indicator   empowers you with the insights and signals needed to make informed trading decisions. The signal conditions are a combination of three indicators, and XQ Forex Indicator only display  medium and long-term trends . The
Max Paynex
Abdulkarim Karazon
Max Payne 是一个反转/趋势信号指标,以箭头的形式给出信号,该指标在同一柱收盘时给出信号,该指标可以在图表上以不同周期多次下降,以获得信号的双重/三重确认 该指标具有高度可调性,可以适应任何交易风格,同时它不会重新绘制或背面绘制,购买后您将获得屏幕截图中显示的完整系统以及使用的模板。 ----------------- 如何交易: 等到您在同一柱上获得三次确认,同时趋势过滤器(购买后您将获得的佩恩趋势)与方向一致 开仓并将止损设置为买入交易的黄金箭头(模板)下方和卖出交易的黄金箭头(模板)上方,您的退出信号是第一个相反的白点信号(模板)。 ----------------- 参数 : 信号周期:箭头周期 滤波器:信号滤波器 距离:箭头距蜡烛的距离 计数柱:显示多少历史信号 警报 --------------------------------------
Gold Channel XAUUSD
Paulo Rocha
5 (2)
Gold Channel is a volatility-based indicator, developed with a specific timing algorithm for the XAUUSD pair, which consists of finding possible corrections in the market. This indicator shows two outer lines, an inner line (retracement line) and an arrow sign, where the theory of the channel is to help identify overbought and oversold conditions in the market. The market price will generally fall between the boundaries of the channel. If prices touch or move outside the channel it is a tra
Please send me Direct message on MQL5 CHAT after purchasing the Indicator for Training and Installation Support There are some additional files that is important to use with the Indicator . So be sure to contact me after purchasing the Indicator So that I can add you for training and support . If you find any difficulty with installation then send me Direct message here So that I can connect with you via Anydesk or Teamview for the product installation. " Smart Order Block Indicator " to find
SNR LEVEL INDICATOR Accurate Snr level indicator will only display Fresh Levels that are close to the Current Market Price. This indicator is very accurate in mapping Support & resistance levels. there is an alert feature when the price TOUCHES the SNR LEVEL, WHEN CLOSE CANDLE BREAK/REJECT SNR LEVEL. INDICATOR MARKING :: - SUPPORT LEVEL == V SHAPE - RESISTANCE LEVEL == APEX LEVEL - GAP RESISTANCE & GAP SUPPORT == OPEN CLOSE CANDLE - SUPPORT BECAME RESISTANCE & RESISTANCE BECAME SUPPORT INDIC
All in One Trade
Alexey Minkov
4.48 (27)
The All-in-One Trade Indicator (AOTI) determines daily targets for EURUSD, EURJPY, GBPUSD, USDCHF, EURGBP, EURCAD, EURAUD, AUDJPY, GBPAUD, GBPCAD, GBPCHF, GBPJPY, AUDUSD, and USDJPY. All other modules work with any trading instruments. The indicator includes various features, such as Double Channel trend direction, Price channel, MA Bands, Fibo levels, Climax Bar detection, and others. The AOTI indicator is based on several trading strategies, and created to simplify market analysis. All-in-One
Volatility Trend System - a trading system that gives signals for entries. The volatility system gives linear and point signals in the direction of the trend, as well as signals to exit it, without redrawing and delays. The trend indicator monitors the direction of the medium-term trend, shows the direction and its change. The signal indicator is based on changes in volatility and shows market entries. The indicator is equipped with several types of alerts. Can be applied to various trading
NAM Order Blocks
NAM TECH GROUP, CORP.
5 (1)
MT4多時限訂單塊檢測指示器。 特徵 -在圖表控制面板上完全可自定義,提供完整的交互。 -隨時隨地隱藏和顯示控制面板。 -在多個時間範圍內檢測OB。 -選擇要顯示的OB數量。 -不同的OB用戶界面。 -OB上的不同過濾器。 -OB接近警報。 -ADR高低線。 -通知服務(屏幕警報|推送通知)。 概括 訂單塊是一種市場行為,它指示從金融機構和銀行收取訂單。著名的金融機構和中央銀行帶動了外匯市場。因此,交易者必須知道他們在市場上正在做什麼。當市場建立訂單塊時,它會像發生大多數投資決策的範圍一樣移動。 訂單建立完成後,市場將朝著上升和縮小的方向發展。訂單大宗交易策略的關鍵術語是它包括機構交易者正在做的事情。由於它們是主要的價格驅動因素,因此包括機構交易在內的任何策略都可以。 您將在任何時間範圍內實時看到訂單塊,使用我們的控制面板,您將能夠在所選的歷史記錄週期內檢測常規,拒收和未大寫的訂單塊。 現在您可以接收到訂單塊接近警報,我們在MT4上顯示屏幕通知,並將通知推送到您的手機!
"The Squeeze indicator attempts to identify periods of consolidation in a market. In general the market is either in a period of quiet consolidation or vertical price discovery. By identifying these calm periods, we have a better opportunity of getting into trades with the potential for larger moves. Once a market enters into a "squeeze," we watch the overall market momentum to help forecast the market direction and await a release of market energy." Modified TTM Squeeze Indicator is a modifica
Entry Points Pro
Yury Orlov
4.7 (225)
这是一款 MT4 的趋势指标,可提供准确的入场交易信号,且无重绘或延迟。 它可应用在任何金融资产:外汇、加密货币、贵金属、股票、指数。 最好的结果出现在 M15+ 的时间帧内。 指标的 MT5 版本 重要! 购买后请联系我,以便获取详细指南和奖励。 视频 (6:22) - 一个信号赢取的利润等于指标价格的三倍。 视频 (4:44) - 它如何在测试器中工作,我的提示和技巧。 视频 (1:44) - 有关它如何处理加密货币和指数的几句话。 大多数交易者在 Entry Points Pro 指标的帮助下,在第一个交易周内就改善了他们的交易结果。 Entry Points Pro 指标的益处 入场信号无重绘或延迟 如果信号出现,并得到确认(如果信号所在烛条已收盘),则它不会再消失;不像是重绘指标,它会导致重大的财产损失,因为它们可以在显示信号后再将其删除。 无差错开仓 指标算法可令您找到入场交易(买入或卖出资产)的理想时机,从而提高每位交易者的成功率。 Entry Points Pro 可操作任何资产 它允许您在 MT4 平台上交易任何经纪商提供的加密货币、股票、
Gann Swing Structure
Kirill Borovskii
5 (1)
This indicator is based on the mathematics of the great trader W.D. Ganna. With its help, you can easily find strong levels by analyzing swings to find the optimal entry point. The indicator works on all instruments and all timeframes. The indicator is fully manual and has control buttons. All you need to do is press the NEW button, a segment will appear, which you can place on any movement, swing or even 1 candle that you want to analyze. By placing the segment, press the OK button. A grid (th
This indicator scans for you up to 30 trading instruments and up to 8 timeframes for occurrences of the high probability reversal patterns: Double Tops/Bottoms with fake breakouts . Please read also the blog post " Professional Trading With Double Tops/Bottoms And Divergences! " which explains the concepts behind the ULTIMATE Double Top/Bottom indicator and how you can use a professional top-down approach. You can get alerts via MetaTrader 4, email and push notifications at the moment when a sig
Quantum Breakout Indicator PRO
Bogdan Ion Puscasu
4.96 (26)
介绍     Quantum Breakout PRO   ,突破性的 MQL5 指标,正在改变您交易突破区域的方式!   Quantum Breakout PRO 由拥有超过 13 年交易经验的经验丰富的交易者团队开发,旨在通过其创新和动态的突破区域策略将您的交易之旅推向新的高度。 量子突破指标将为您提供带有 5 个利润目标区域的突破区域的信号箭头,以及基于突破框的止损建议。 它既适合新手交易者,也适合专业交易者。 量子 EA 通道:       点击这里 MT5版本:   点击这里 重要的!购买后请私信我领取安装手册。 建议: 时间范围:M15 货币对:GBPJPY、EURJPY、USDJPY、NZDUSD、XAUUSD 账户类型:ECN、Raw 或 Razor,点差极低 经纪商时间:GMT +3 经纪商:IC Markets、Pepperstone with Raw 和 Razor 的点差最低 规格: 不重漆! 最多 5 个建议利润目标区域 建议止损水平 可定制的盒子。您可以设置自己的 Box Time Start 和 Box Time E
PZ Trend Trading
PZ TRADING SLU
4.8 (5)
许多盈利交易者不仅知道如何识别市场趋势,而且也能把握趋势建立后的交易机会。 Pz 趋势交易 指标设计用来在趋势行情中尽可能的赚取利润。 已建立的趋势提供了一揽子交易机会,但大多数趋势交易指标完全忽视了它们,让交易者在趋势行情时完全不知道该如何做!一般趋势指标只通知有关的趋势变化,但根本不足以得到卓越的回报. Pz 趋势交易 指标比一般趋势指标显示多达 20 倍的交易 , 因为它注重所谓的市场时机。它不仅显示当前的市场趋势,也有回调,内柱线的突破和调整。它令您在趋势回调之后介入,安全的柱线内突破金字塔加仓,以及发现潜在的反转,和已知的调整。 趋势改变 一个趋势改变在市场方向变化时发生。趋势变化在图表上用带数字的彩色圆圈显示。蓝色 (1) 信号为上涨开始, 而红色 (1) 信号为下跌开始。趋势变化并非评估当前价格动作的结果, 它意味着交易设置是不定时地。如果您正确使用本指标, 在趋势变化时, 您将将已经入场 (参看下面的调整)。 回调 但凡趋势在运动中,行情上下抖动,盈利者收割利润,且其它参与者入场。趋势回调代表好的买入机会,通常是由主力获利离场导致。如果行情在回调后回归上行, 指
How to use Pair Trading Station Pair Trading Station is recommended for H1 time frame and you can use it for any currency pairs. To generate buy and sell signal, follow few steps below to apply Pair Trading Station to your MetaTrader terminal. When you load Pair Trading Station on your chart, Pair Trading station will assess available historical data in your MetaTrader platforms for each currency pair. On your chart, the amount of historical data available will be displayed for each currency pai
筛选:
无评论
回复评论
版本 1.1 2023.10.31
Code updated