ON Trade Joker Levels
- 指标
- Abdullah Alrai
- 版本: 1.0
- 激活: 5
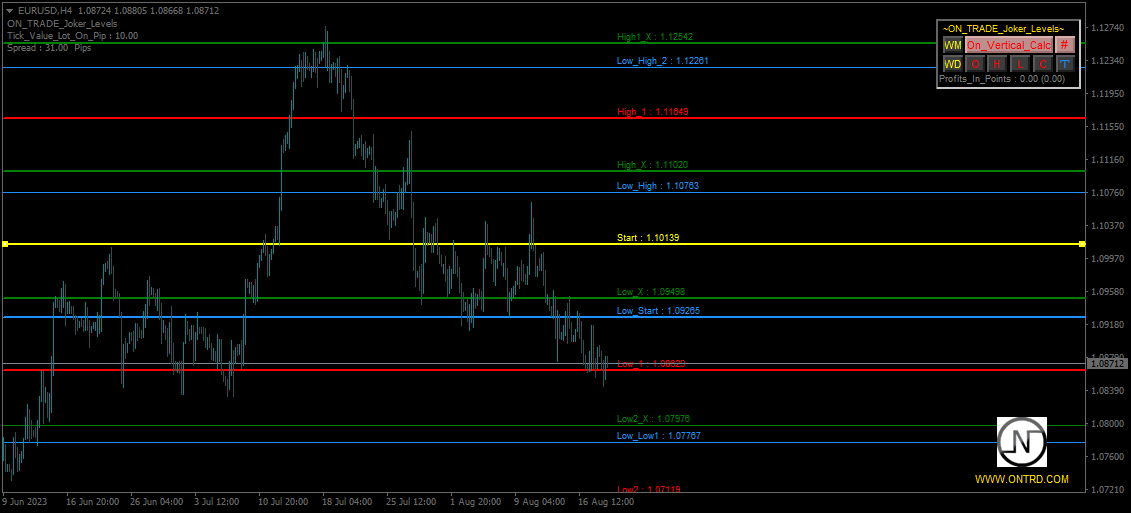
基于数字学的MetaTrader支持和阻力指标
简介: 通过我们的基于数字学的MetaTrader支持和阻力指标,解锁技术分析的新维度。这个独特的工具利用数字学的力量,在您的图表上识别关键的支持和阻力水平,为您提供有关潜在价格变动的有价值见解。
关键概念:
交易中的数字学: 数字学是对数字及其在我们生活中的意义的神秘研究。将数字学原理应用于交易,涉及到识别具有象征意义的特定数字,并使用它们来预测可能吸引买入或卖出活动的价格水平。
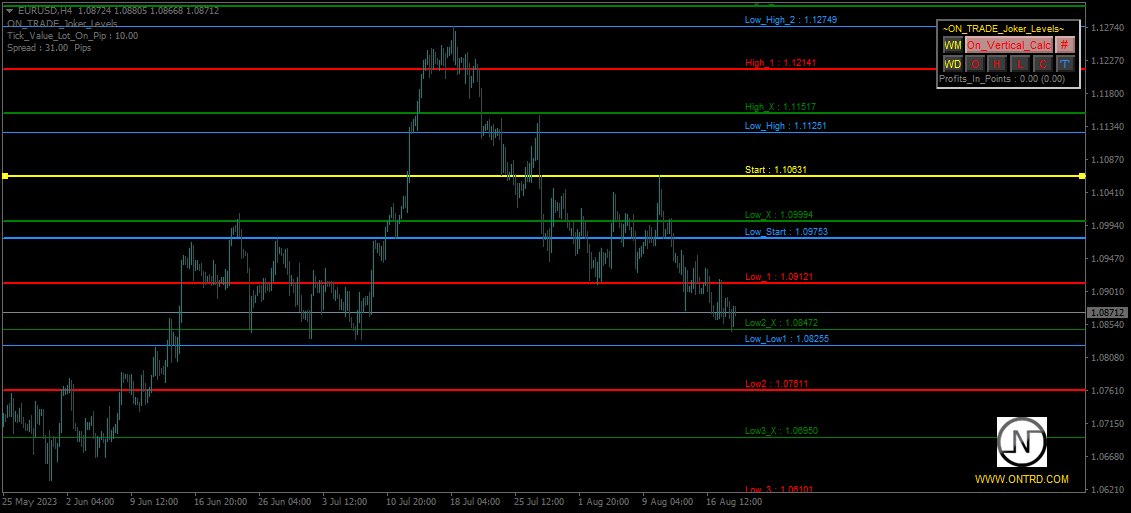
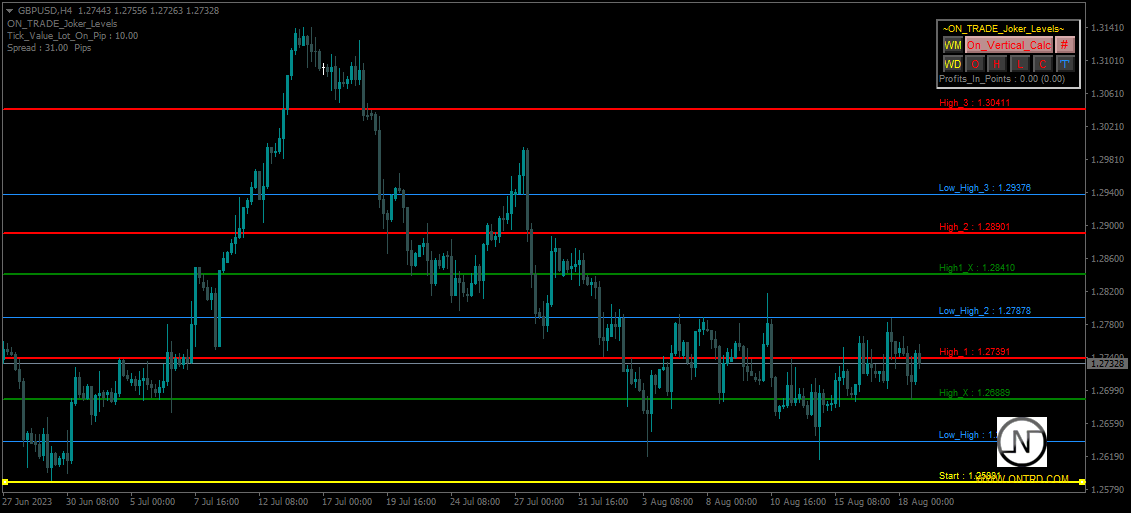
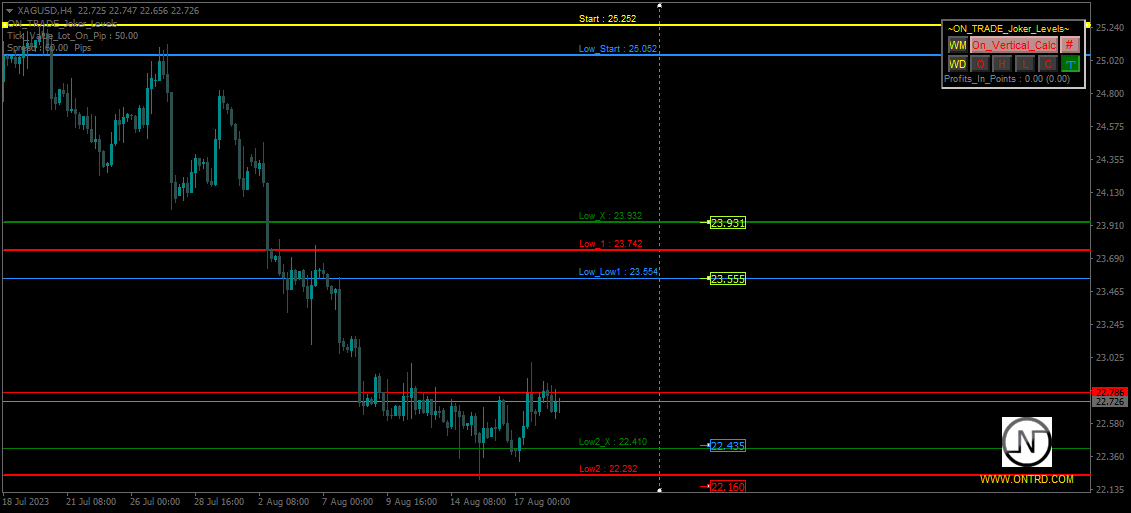
指标功能: 我们的指标利用数字学的隐藏模式,在您的图表上绘制支持和阻力水平。这些水平是从在金融市场中具有显著意义的关键数字中获得的。
学习的首选步骤:
了解数字学:在使用该指标之前,花些时间了解数字学的基础知识及其在交易中的相关性。了解重要数字、它们的含义以及它们与金融市场的关系。
指标安装:首先,在您的MetaTrader平台上安装基于数字学的支持和阻力指标。按照用户指南中提供的安装说明操作。
选择时间框架:打开您喜欢的交易工具的图表,选择您想要分析的时间框架。该指标适用于不同的时间框架,可以用于识别短期和长期交易的数字学水平。
调整指标参数:根据您的交易偏好自定义指标参数。该指标可能允许您指定要使用的数字学数字,并调整灵敏度水平。
解读水平:该指标将根据其包含的数字学原理,在您的图表上自动绘制支持和阻力水平。这些水平是价格可能反转或整理的潜在区域。
通过价格行动确认:与任何交易工具一样,确认基于数字学的水平需要进行其他技术和基本分析。寻找额外因素,例如蜡烛图形或趋势线,以支持识别的水平。
练习和观察:为了提高对该指标的熟练程度,在历史图表上练习使用它。观察价格在不同市场条件下围绕数字学水平的反应。
风险管理:在交易时始终采用适当的风险管理策略。使用止损订单和头寸大小来保护您的资金。
结论: 我们的基于数字学的支持和阻力指标是一个强大的工具,将数字学的神秘世界融入到您的交易策略中。通过识别受数字学影响的潜在支持和阻力水平,您可以做出更明智的交易决策。请记住,尽管数字学为分析添加了独特的层面,但将其与其他经过验证的交易技术结合使用对于取得最佳结果至关重要。
【免责声明:交易涉及风险,指标应作为综合交易方法的一部分来使用。在进行交易决策之前,请始终进行您自己的研究和分析。】
请随意根据您的具体指标和目标受众自定义和调整这些步骤。
用户没有留下任何评级信息
Follow us on telegram if you like
https://t.me/On_Trade_Telegram