ON Trade Gann Squares
- 指标
- Abdullah Alrai
- 版本: 1.3
- 更新: 27 五月 2024
- 激活: 5
Gann 方块指标是一种强大的市场分析工具,基于 W.D. Gann 在其“市场预测数学公式”一文中介绍的数学概念。该指标融合了与平方数(如 144、90 和 52)有关的 Gann 技术,以及平方 9。此外,它还融入了 关于如何将平方 9 与通道和星形图案结合使用的方法。
用户手册和使用方式:
在使用该指标之前,我们建议您阅读用户手册,并与我们联系以获得任何澄清。您可以在我们的网站上找到完整的用户手册。
该指标提供了 MT5 的完整版本供购买,也提供了 MT4 的免费版本供测试。提供了两个版本的链接供您方便使用。
主要特点和功能:
Gann 方块指标为您的交易环境提供了全套工具,使您能够基于几何图案和 Gann 的概念做出明智的决策。以下是主要特点:
-
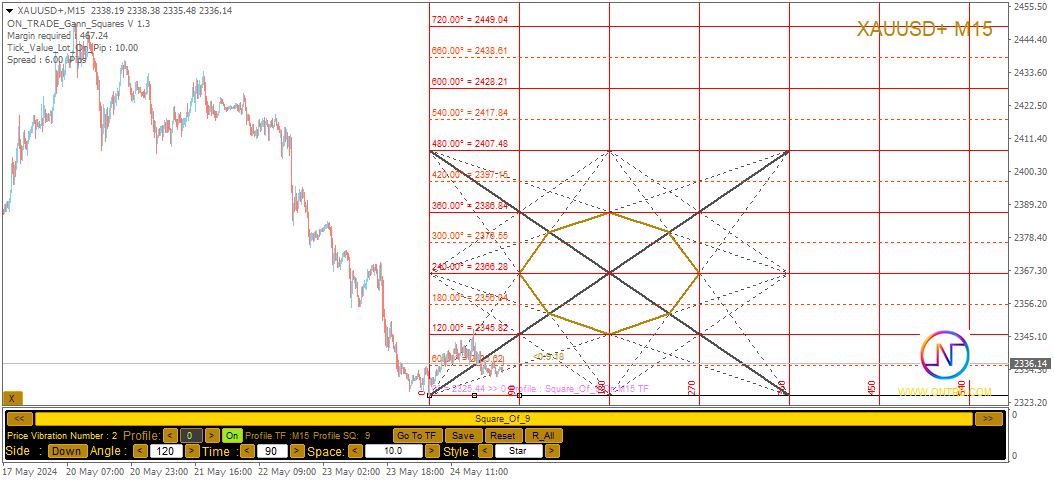
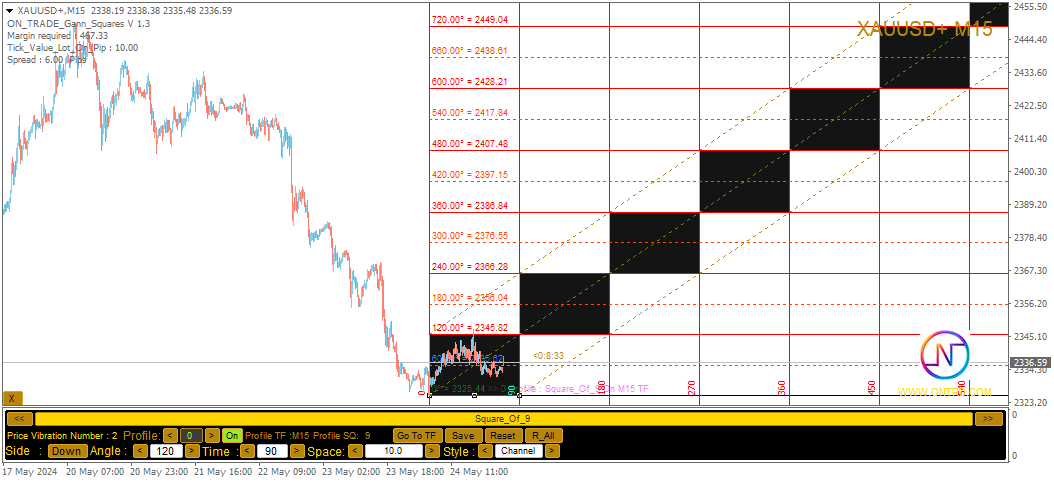
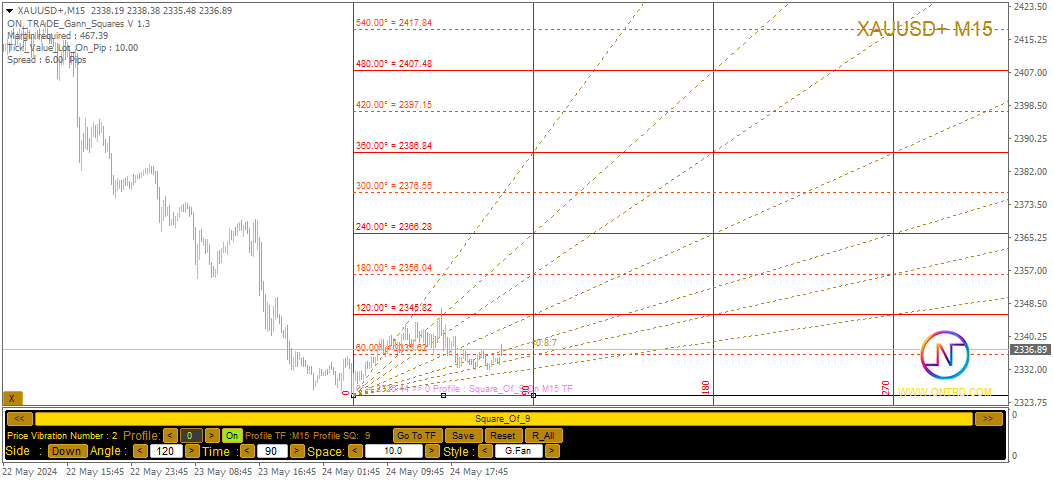
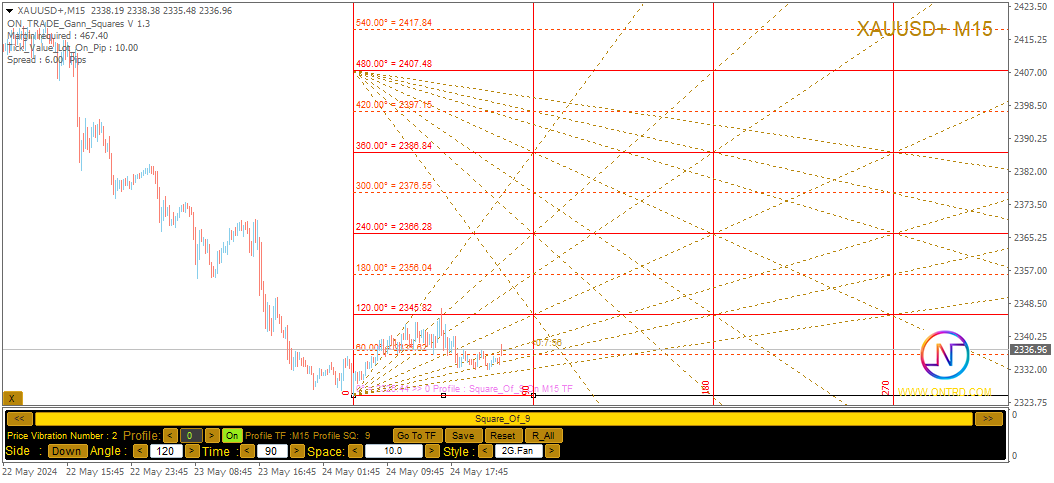
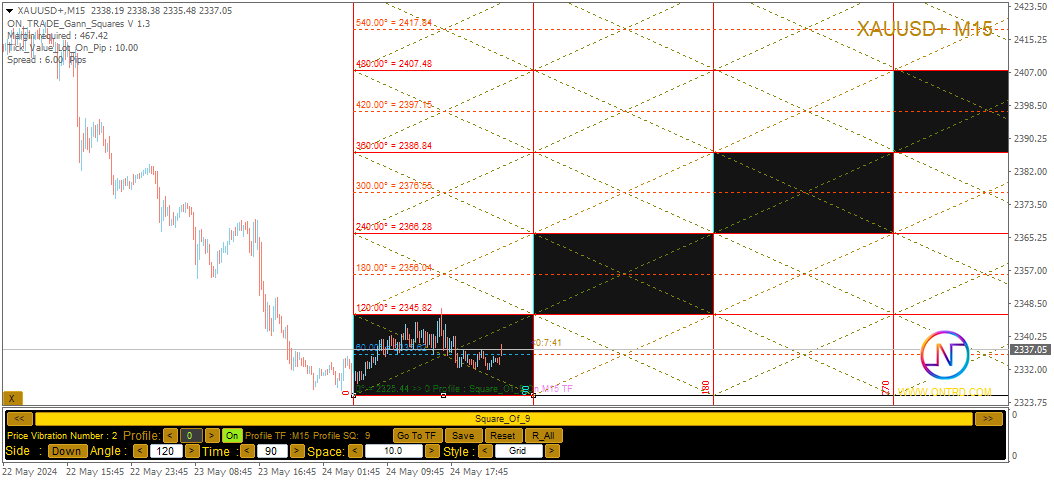
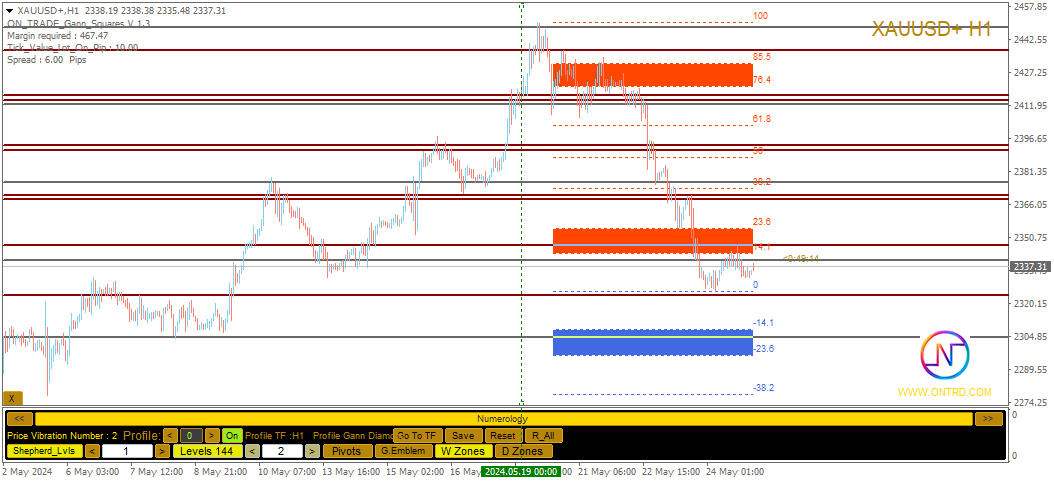
平方 9 分析: 该指标可以绘制与平方 9 有关的各种元素,包括水平线、星形图案、网格、Gann 扇形等。这在您的图表上提供了 Gann 的几何概念的视觉表示。
-
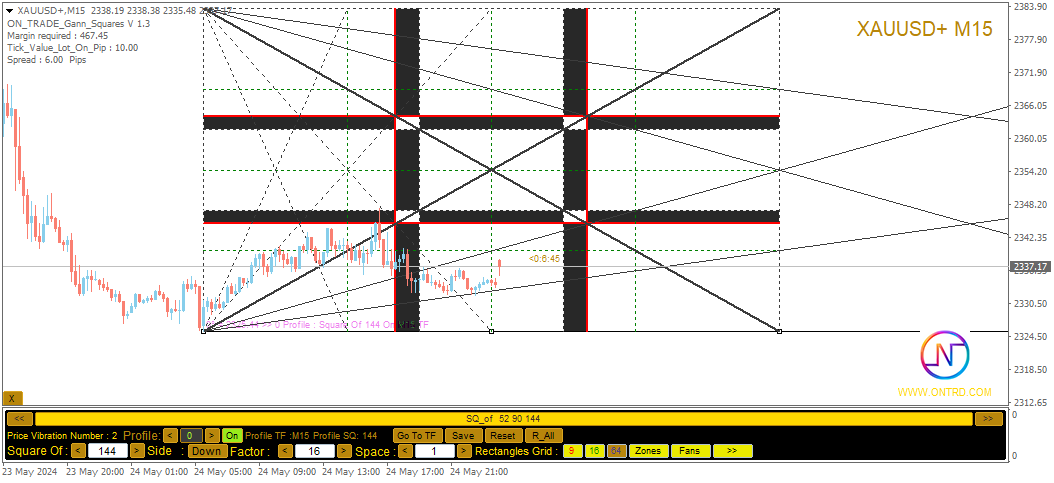
Gann 方块: 该指标绘制了 Gann 方块 52、90 和 144,使您能够可视化和分析它们与价格走势的关系。
-
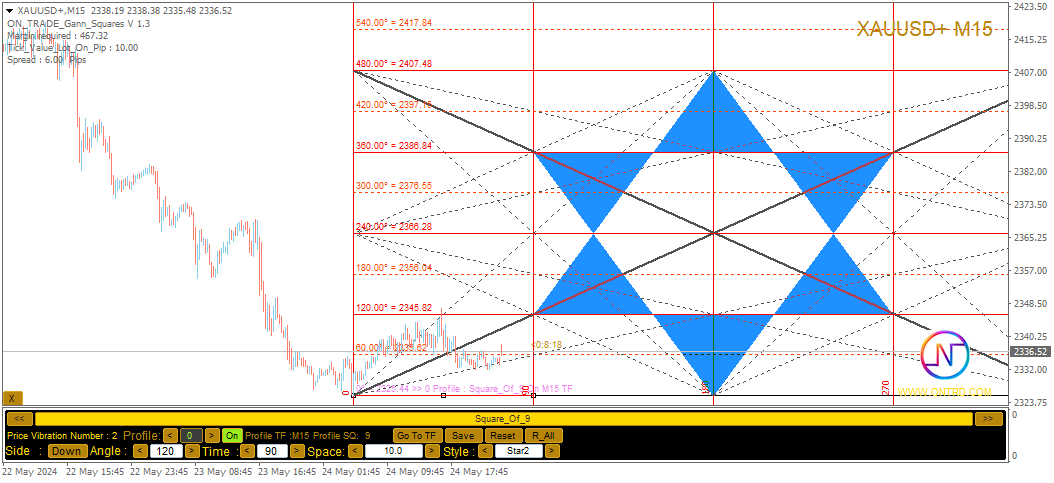
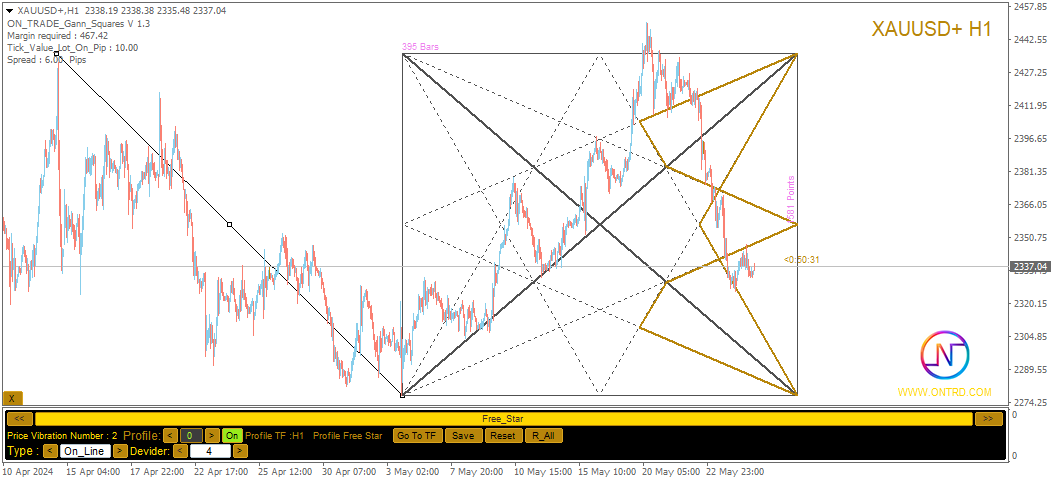
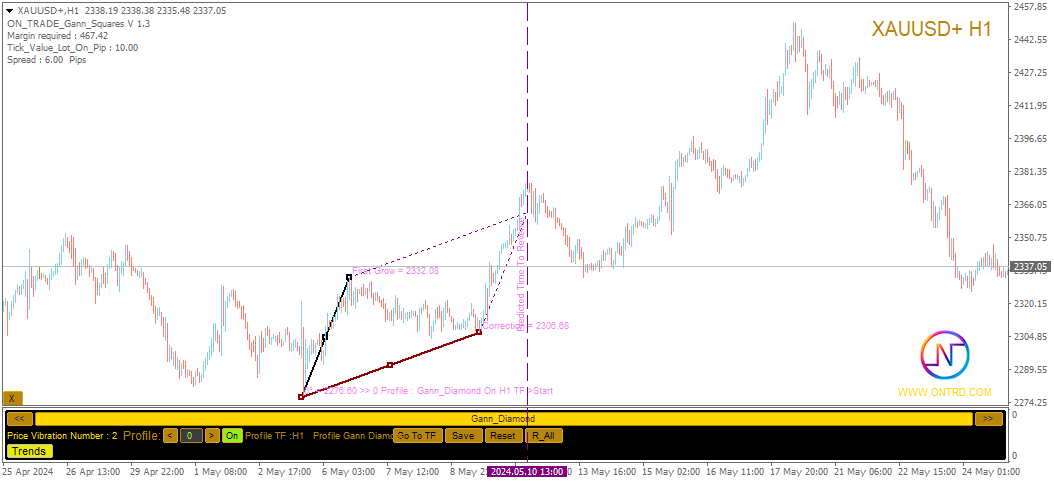
自由 Gann 星形图案: 该指标使您能够直接在图表上绘制可移动的自由 Gann 星形图案,为识别潜在趋势变化或逆转提供了动态工具。
-
Gann 钻石: 除其他元素外,该指标还包括绘制 Gann 钻石的功能,增强您发现独特图案的能力。
-
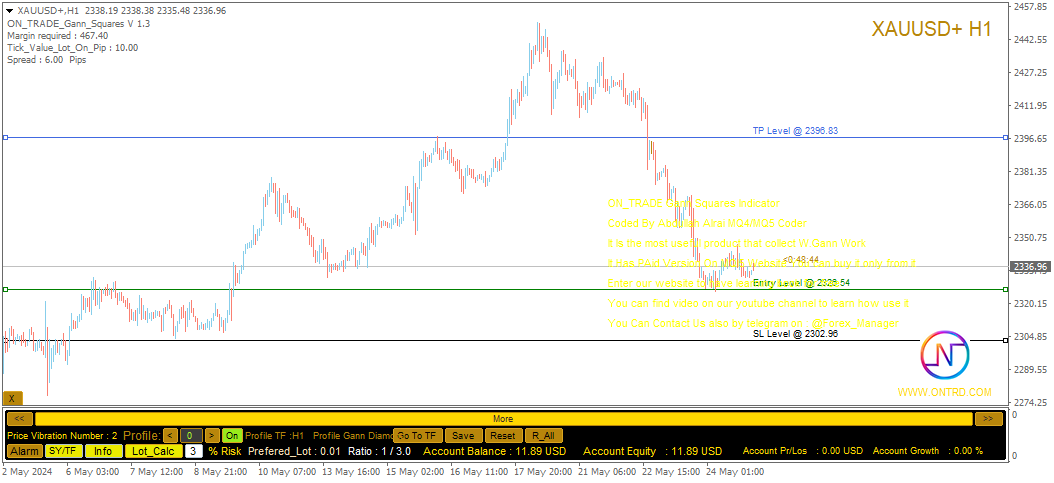
手数计算器: 该指标包含一个手数计算器,帮助您确定最佳交易手数。
-
用户友好的面板: 该指标配备了用户友好的面板,允许您在“144/90/52 方块”、“平方 9”、“Gann 自由星形图案”、“Gann 钻石”、“数字工具”、“手数计算器”和“账户信息”之间切换。
-
数据管理: 您在该指标上的所有操作都将保存在您的交易资料中,使您能够在任何时候加载或卸载它。您还可以通过按下一个按钮来重置您保存的数据。
自定义和参数:
Gann 方块指标提供了各种参数,可以根据您的偏好自定义其外观和行为。您可以调整颜色、样式、宽度等设置,适用于不同的元素,如角度、方块、星形图案、通道和水平线。
结论:
Gann 方块指标是对 Gann 分析和数字学感兴趣的交易者的多功能工具。通过融合 Gann 的数学原理和几何图案,该指标增强了您识别潜在交易机会并做出明智决策的能力。为了最大限度地利用该指标的优势,我们建议观看我们的教学视频,并阅读我们网站上提供的 PDF 资源。
与任何交易工具一样,理解如何有效使用该指标,使用历史数据进行实践,以及及时了解实时市场状况将有助于您取得成功。请务必在使用任何交易指标或策略时谨慎管理风险。