Smart Volume MT5
- 指标
- Issam Kassas
- 版本: 1.0
- 激活: 5
Description:
For a comprehensive understanding of our indicators, we invite you to explore the entire Q&A section within this MQL5 blog post here.
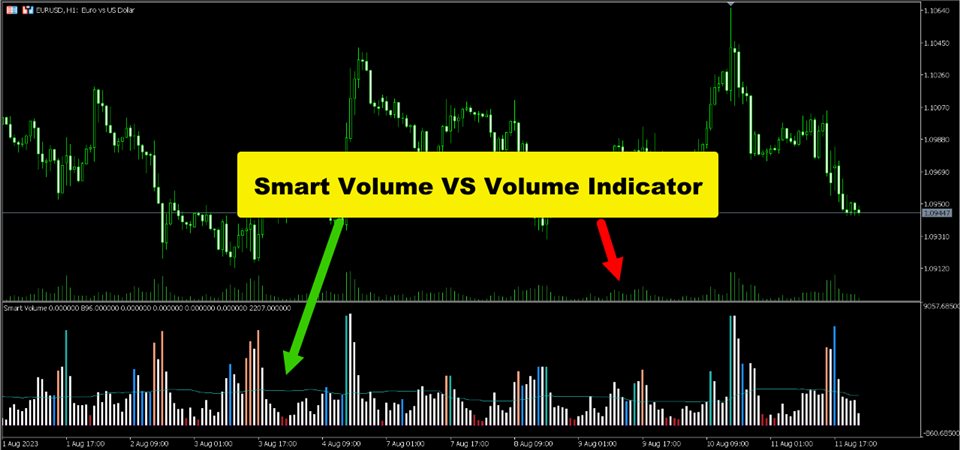
Technical indicators are crucial tools for analyzing market trends. Smart Volume, can help traders understand price movements and market strength. This indicator utilizes tick volume and price action to identify market trends and reversals.
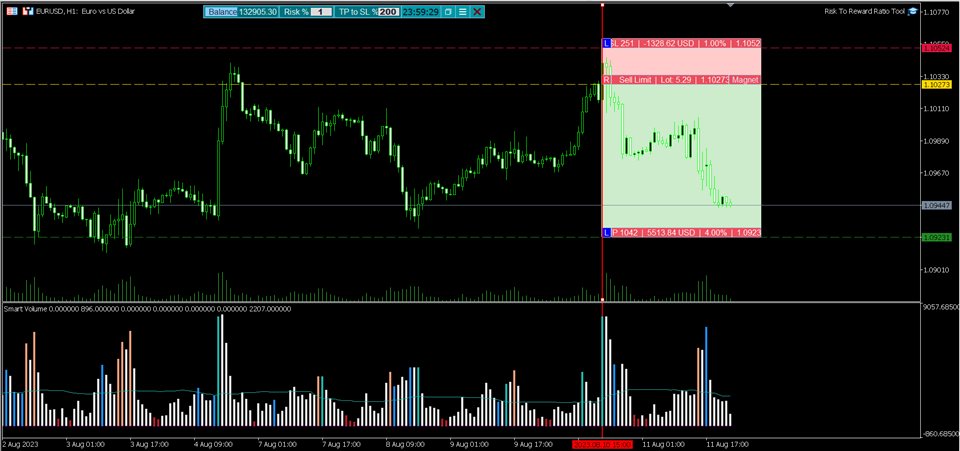
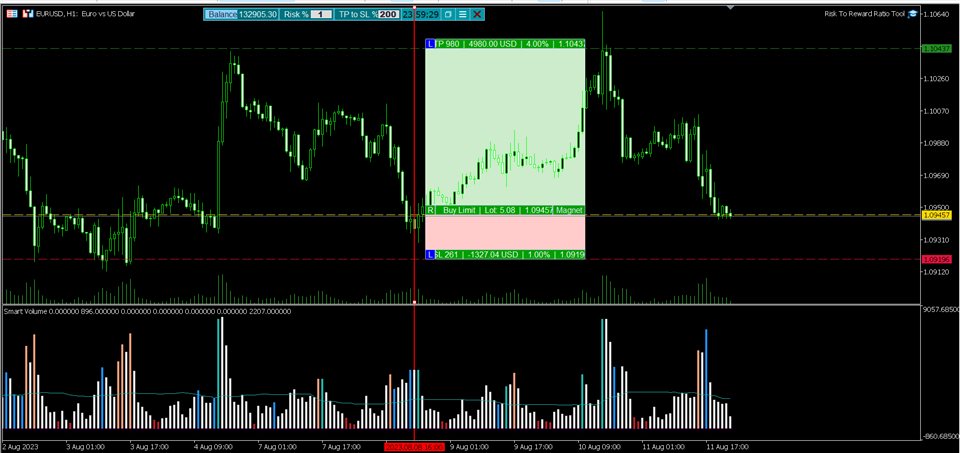
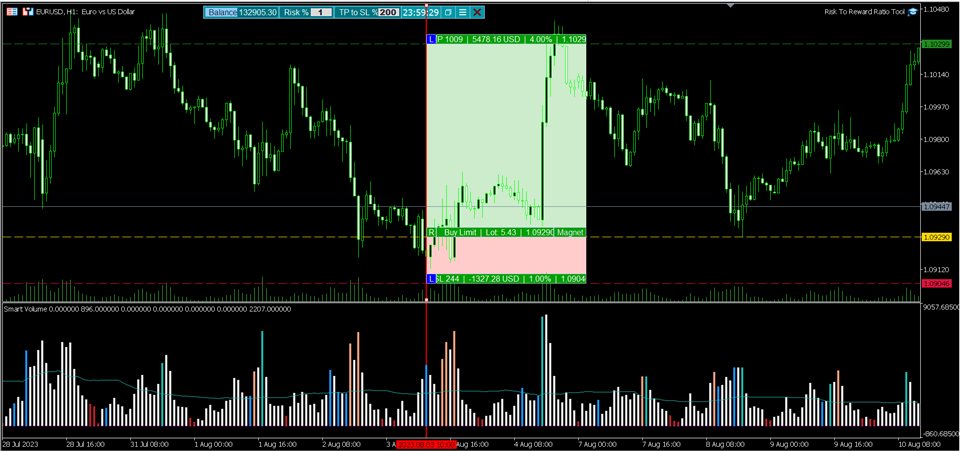
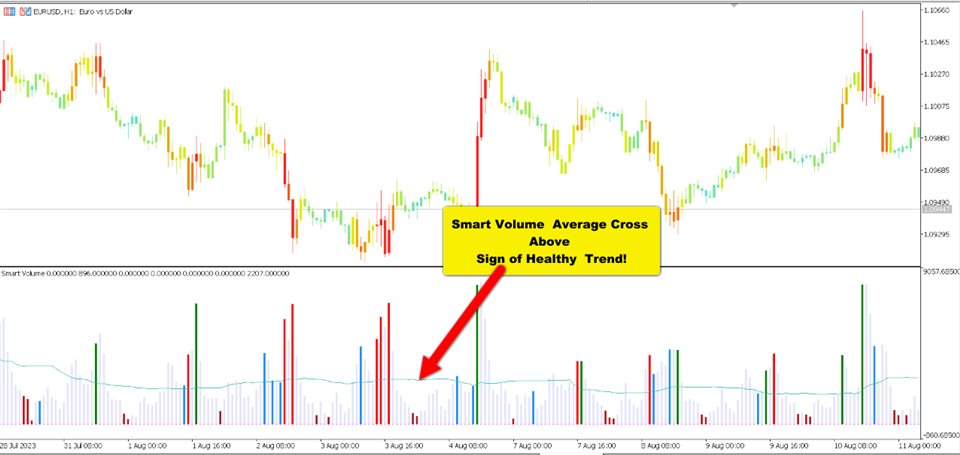
The Smart Volume indicator displays volume bars in blue, yellow, green, red, and white, each signifying distinct market conditions. Blue bars represent standard trading activity without significant changes in trends. Yellow bars indicate low trading volume near trend completion or potential retracement. Green bars suggest increased volume, possibly signifying a trend shift, though not an immediate reversal. Red bars highlight strong buyer dominance, possibly preceding a bullish reversal. White bars indicate heightened seller activity, possibly foreshadowing a bearish reversal. The indicator includes a vital moving average, dividing volume bars by their height. This versatile tool aids traders in analyzing market dynamics and potential trend changes.
Smart Volume Features:
1. Color-Coded Bars: Green for bullish, red for bearish, and bar size reflects trend strength.
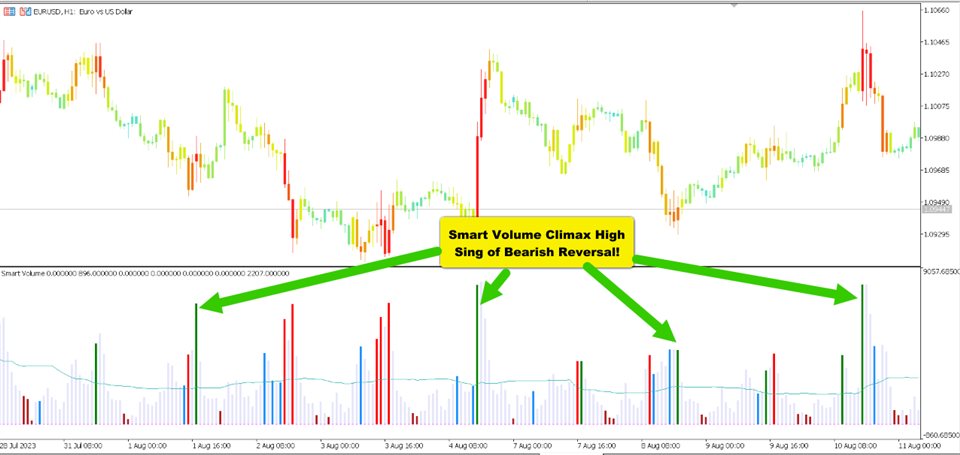
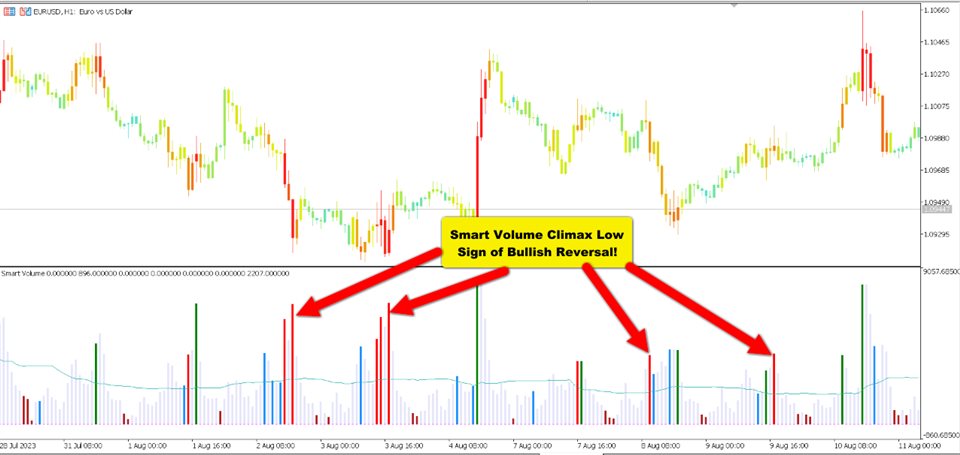
2. Volume Climax: Spikes in volume followed by reversals indicate trend exhaustion.
3. Volume Divergence: Mismatch between volume and price suggests possible reversals.
4. Volume Spread Analysis: Compares current volume to average for trend strength.
Functions:
1. Trend Identification: Analyzes volume and price action to assess trend strength.
2. Reversal Identification: Detects possible reversals via volume climax and divergence.
3. Sentiment Analysis: Evaluates market sentiment through volume and price.
Reading Smart Volume:
Green bars signal bullish trends, red bars indicate bearish trends, and bar size signifies strength. Volume climax suggests trend exhaustion,
and volume divergence hints at possible reversals. Smart Volume aids in making informed trading decisions.
Volume Climax happens at the end of both bullish and bearish trends and happens Suddenly with huge volume bars, and that is a good sign that the trend is exhausted.
Volume Divergence Happens when the price is still trending but the volume is shrinking, that is a good sign of possible reversal.
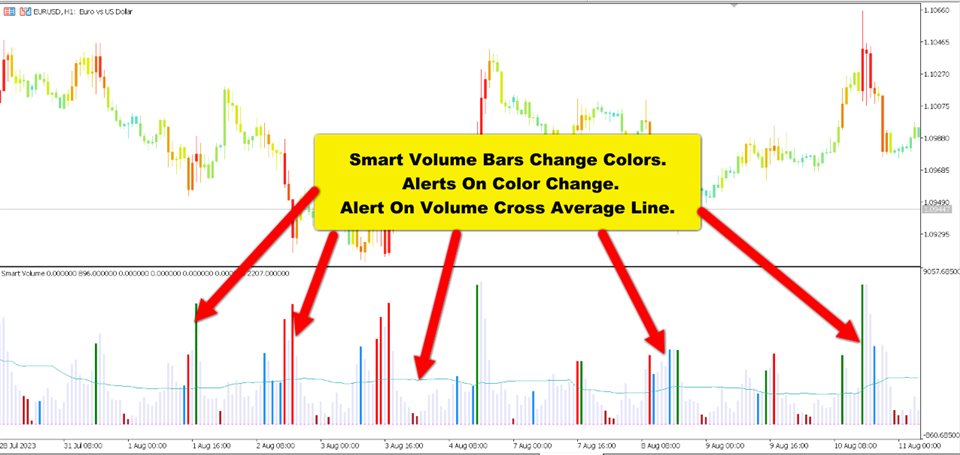
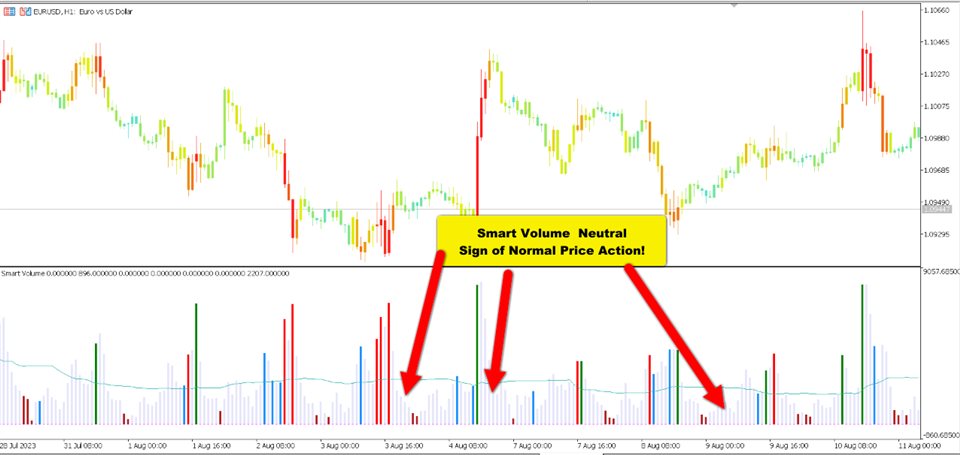
Volume Average Line Cross happens when the volume bars cross the average line, that is a sign of healthy trend.
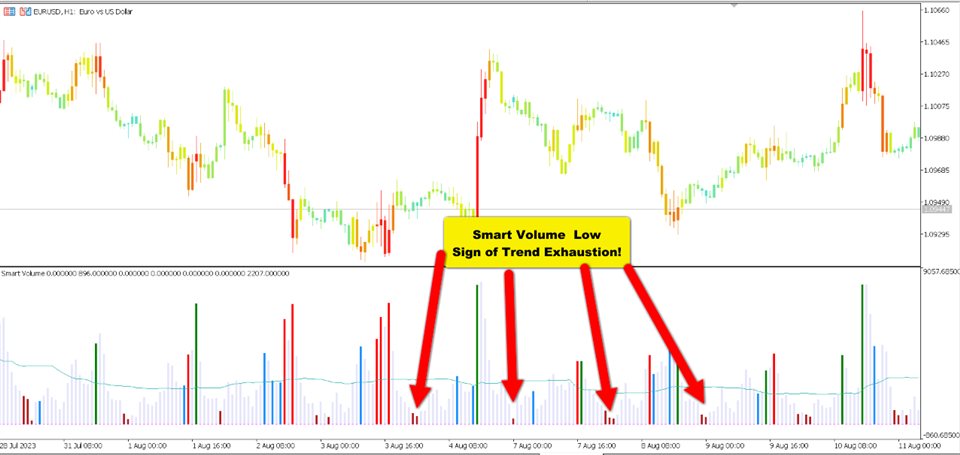
Volume Low happens when the volume bars are very small, that is a sign of the end of the trend.
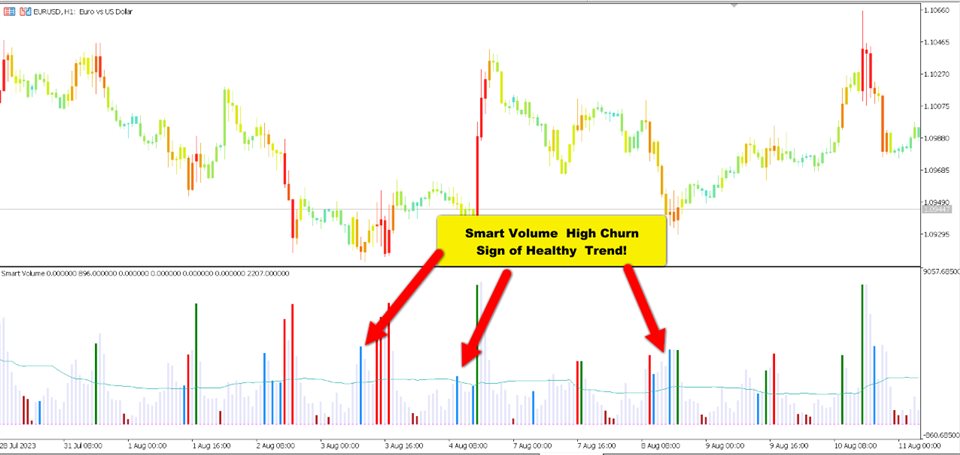
Volume Churn Happens when the volume bar cross above average line and colored, that is a sign of the trend end or a good level for TP.
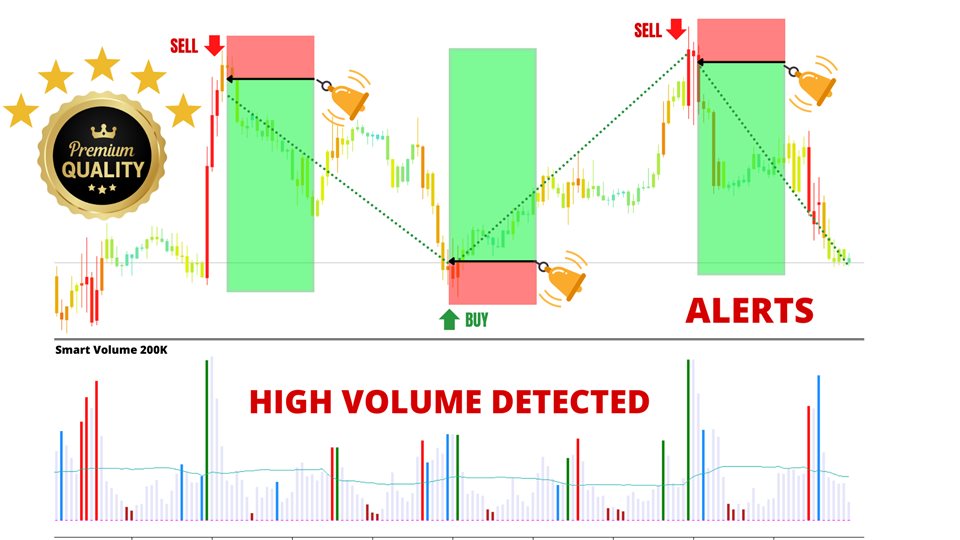
You will get alerted whenever the the volume bars change color, If you choose to enable the alerts in the setting table. The Smart Volume can also alert you on average line cross.
Note: You can change the colors, how ever This might affect the Alerts system since it uses the color coding.
New Updates will be Supported to make this the very comprehensive volume Indicator.
