Market Structure Lines
- 指标
- Wen Rui Tan
- 版本: 7.0
- 更新: 13 十二月 2024
- 激活: 20
1. Updated usage descriptions in blog below:
https://www.mql5.com/en/blogs/post/760322
Smart Market Structure Trading System and Automatic Scanner - Trading Systems - 13 October 2023 - Traders' Blogs (mql5.com)
https://www.mql5.com/en/blogs/post/754495
2.1 YouTube video link for Panel control: https://youtu.be/LM699E7JS3E
2.2 YouTube video link for feature introduction: https://youtu.be/tMU04wo0bc8
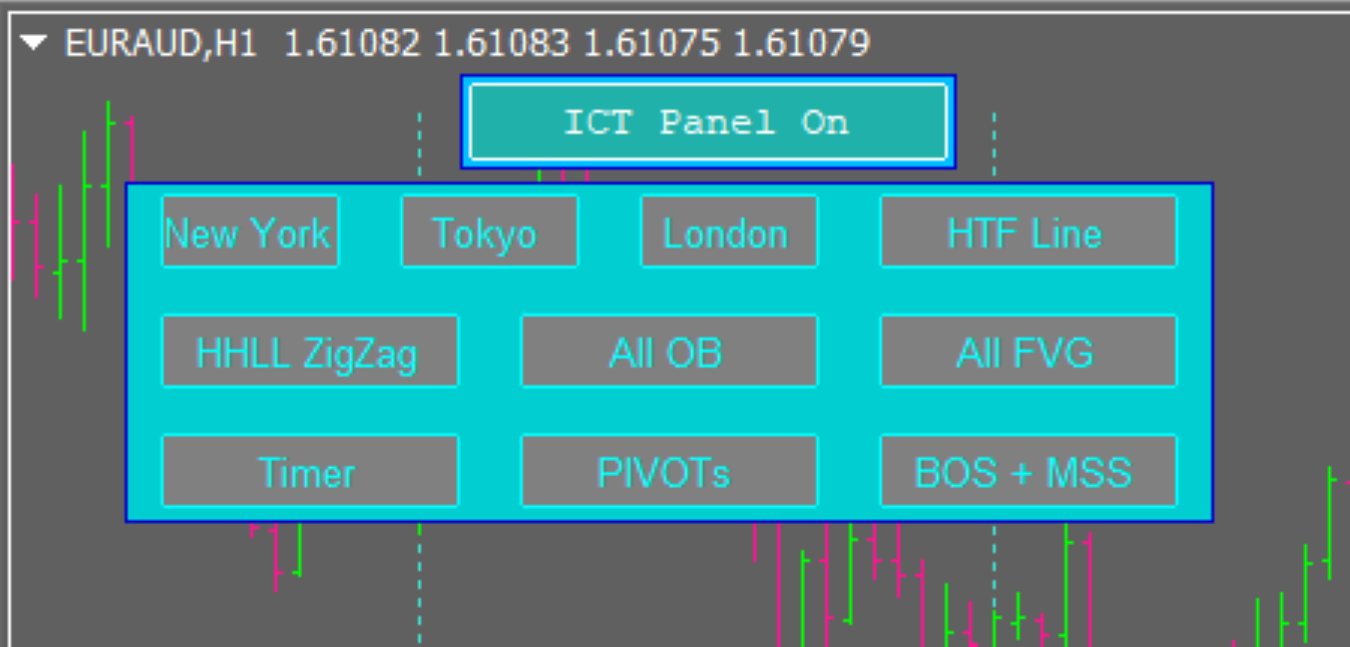
2.3 All features can be turned on and off with a click of a button.
3. Smart Money Concepts, Support and Resistance, Buy Side Liquidity, Sell Side Liquidity, Monthly Highs/Lows, Weekly
High/Lows, Previous Day High/Low/Open, Daily High/Low/Open ...all the most important price lines/areas that the
smart money uses to sweep the market.
It can be used for any timeframe, so you can refine your entry based on these important price lines. Using higher
timeframe lines for analysis, and using lower timeframe lines for accurate entries and exits.
It's like you'll be able to see the "footprint" of the smart money in front of you at all times. And save you the long dreaded
"waiting" time to live your life until the price touches one of these lines.
You can change the settings for the lines, the colors, show them on chart or not, and etc through the input screen.
------------------------------------------------------------------------------------------------------------------------------------------
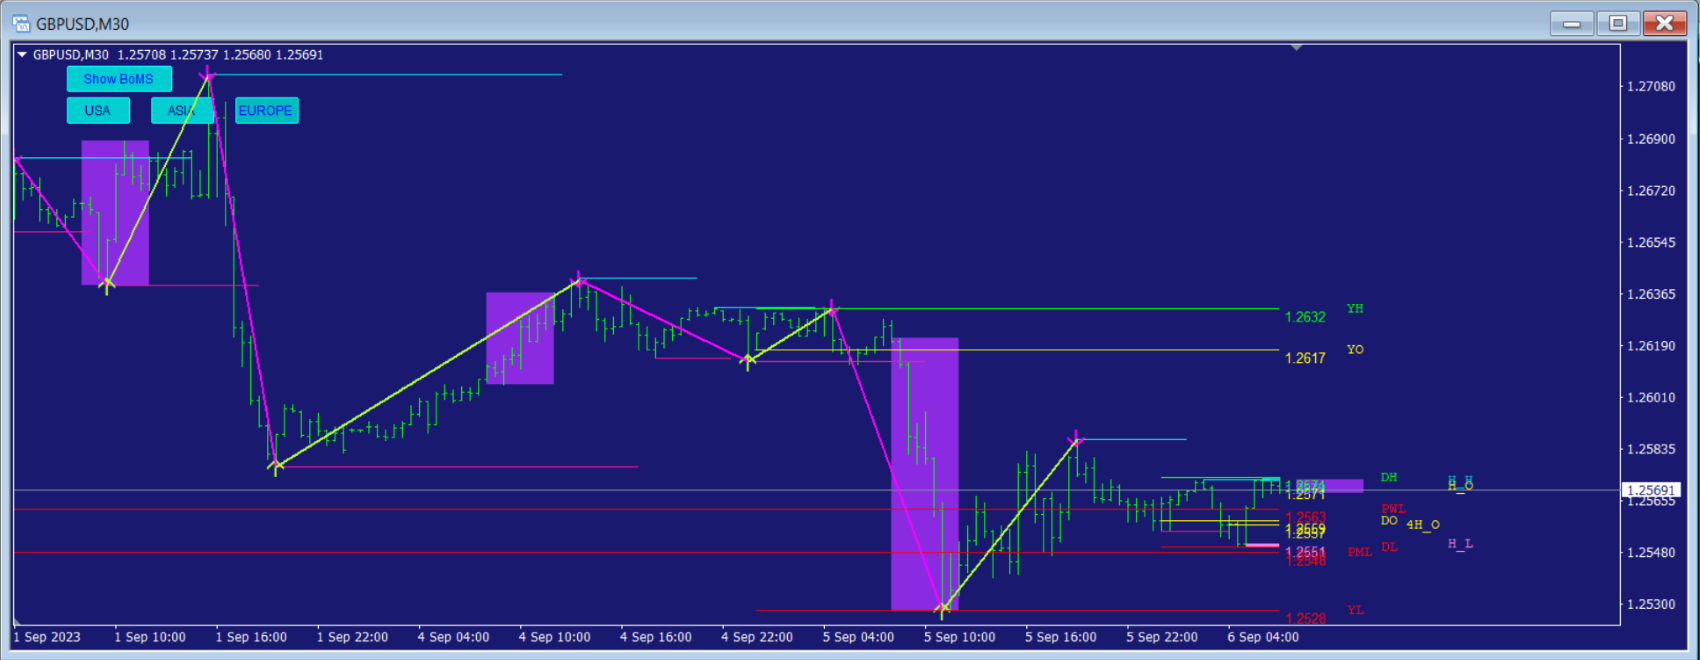
- 3 trading sessions: Asia, Europe, and USA. The 3 silver bullets. Each trading session is controlled by its own button,
with 1 click, to turn it on or off. And you can show all 3 sessions, or just 1, or 2 sessions, or any combinations of the
3 sessions.
- Option for Showing 3 trading sessions by filling the session background square in selected color, or just showing the
square itself ( keep it an empty square ).
- Show trend direction on charts with only up colors and down colors, making it much easier to spot trend direction
and the overall picture of price pattern, and direction of price move.
- Show exact price on the chart for all important price levels, for monthly, weekly, daily High/Low/Open prices, to
help trader gauge more accurate entry points, and Equal Highs/Equal Lows, Juda's Swings ( Bulls trap, Bears trap ).
- Real time timer function, shows remaining time for candle close for each of the timeframe
( D, 4hr, 1hr, 30min, 15min, 5min, and 1min ).
- Real time Time Zone display for different cities in the world ( London, New York, Tokyo, Sydney, Server and local Time
Zone ).
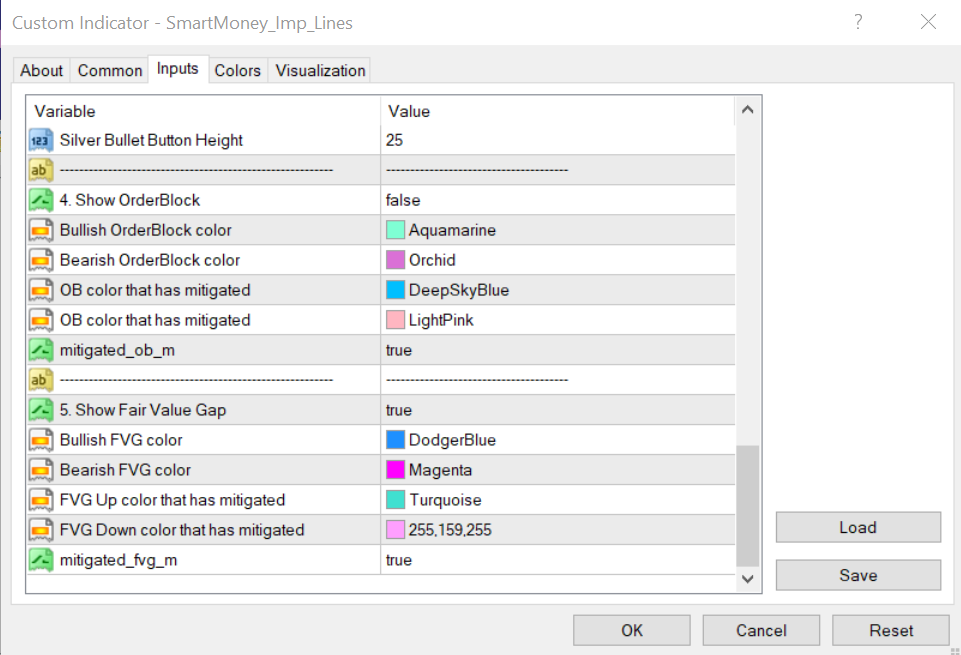
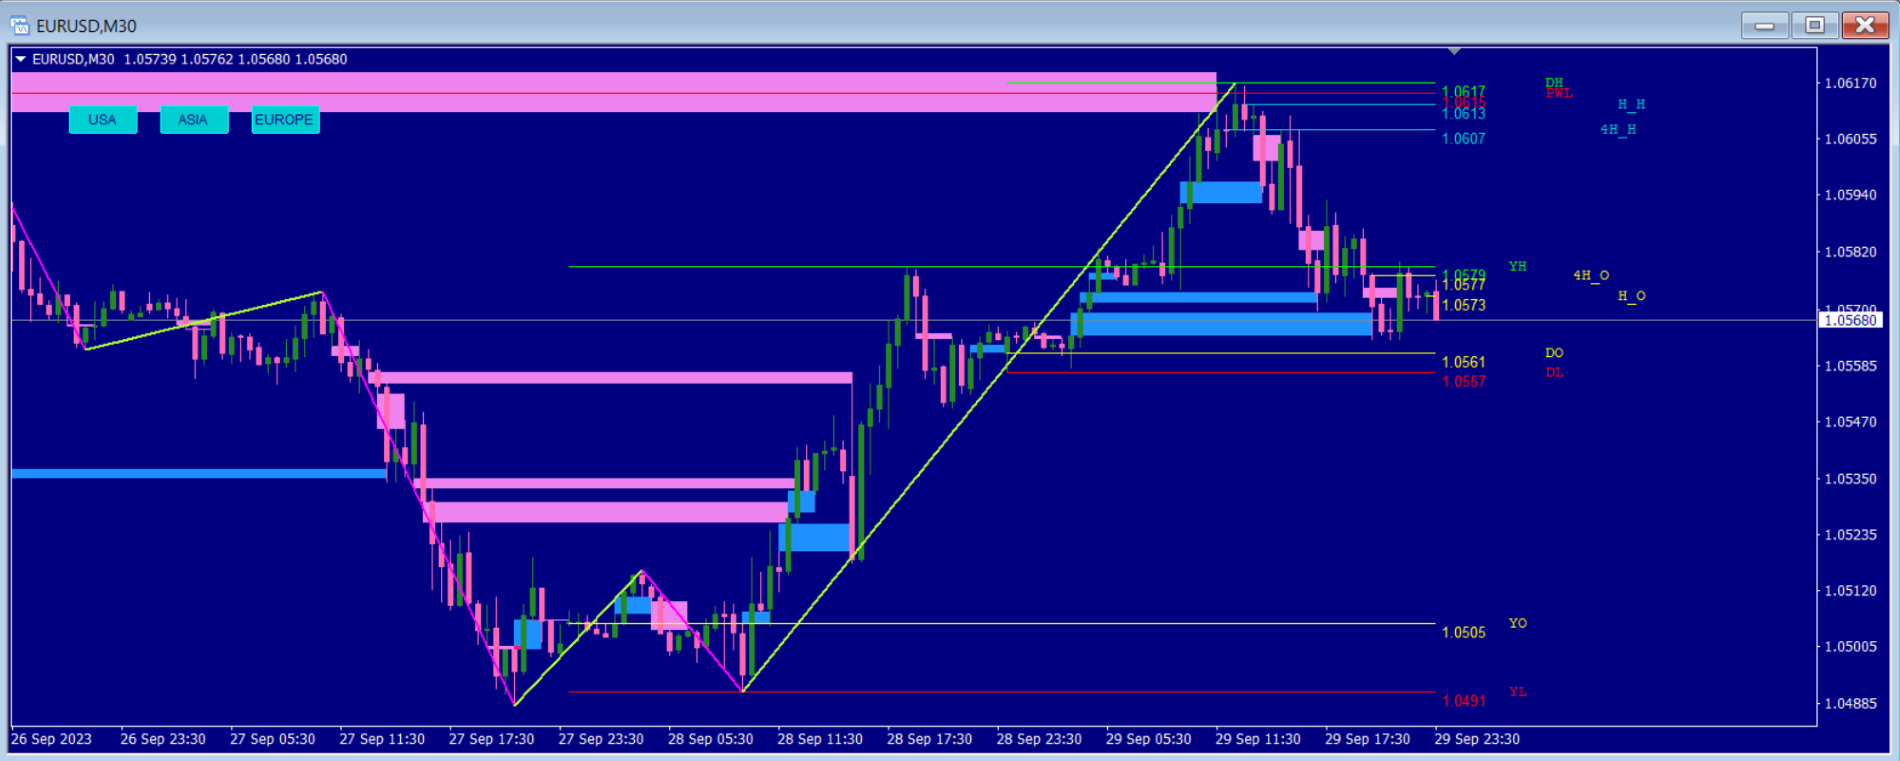
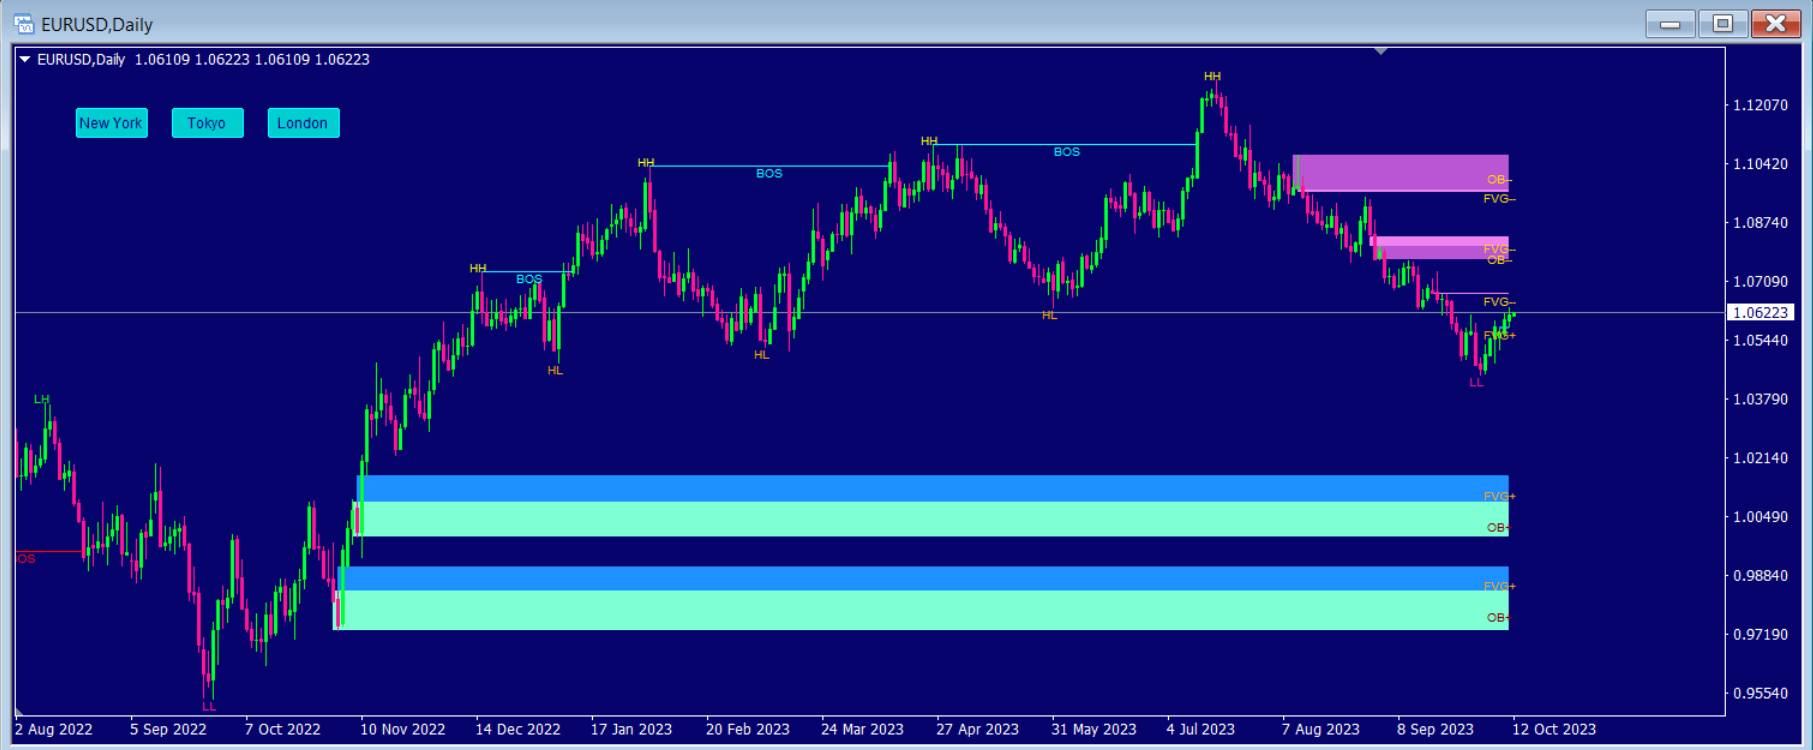
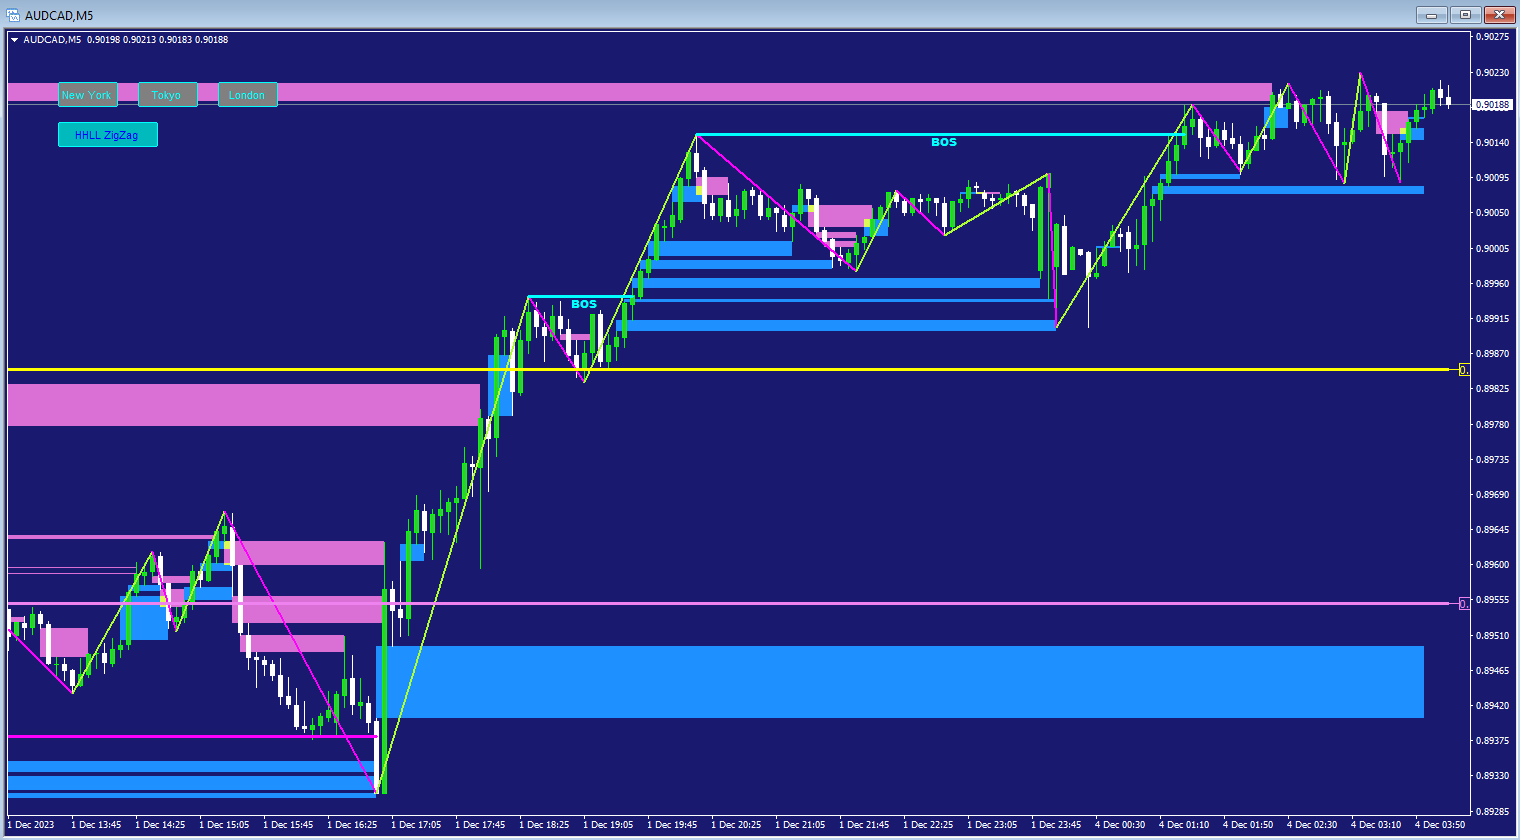
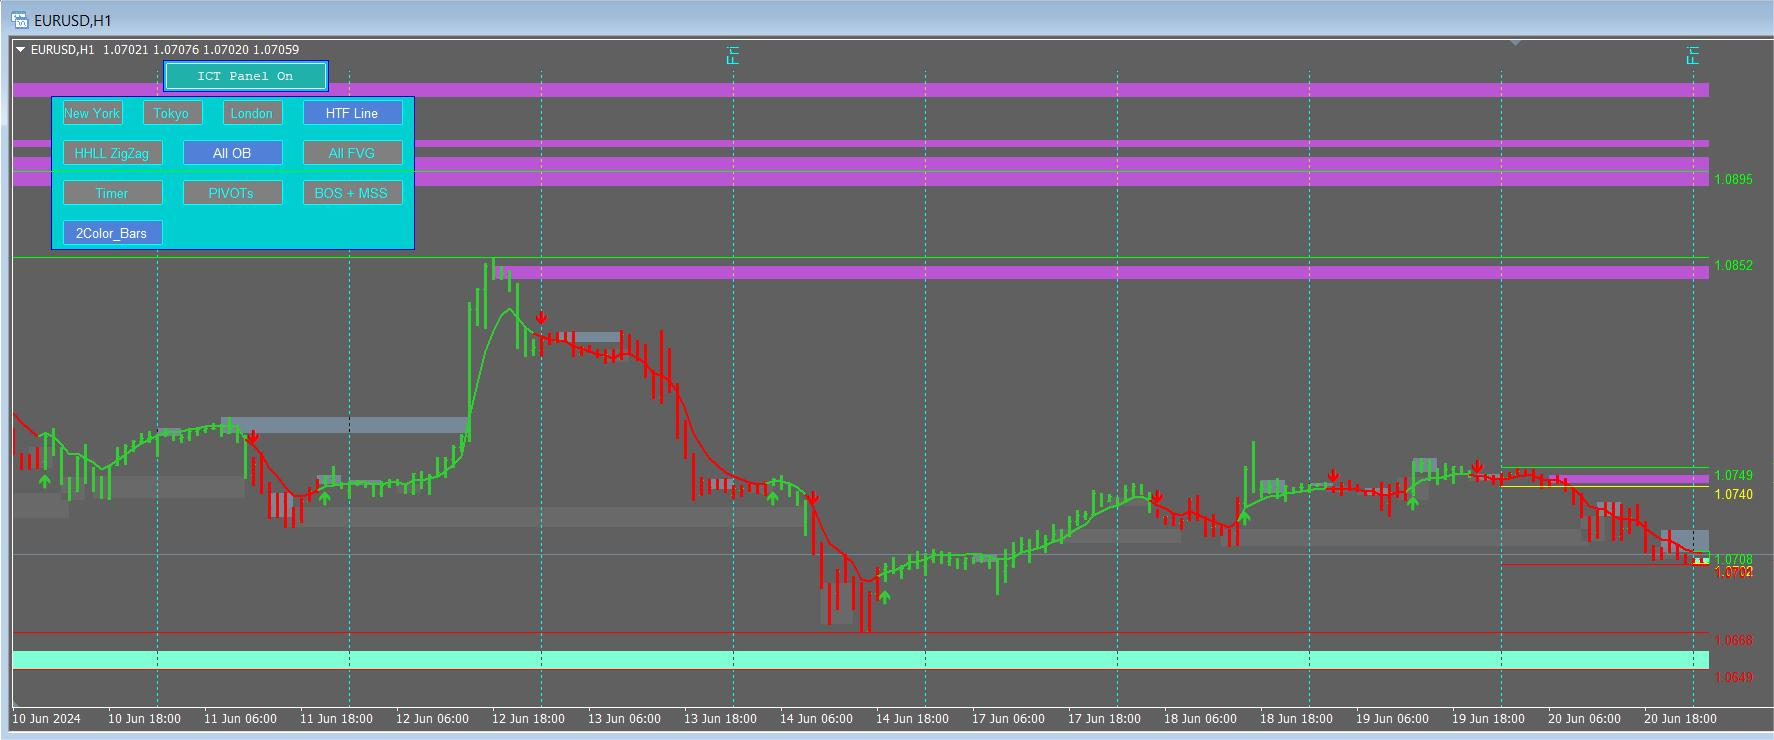
- Bullish and Bearish OrderBlocks, and Fair Value Gap detection on the chart, with the option to show them, or not show
them on chart.
- Options to choose and change color settings for OrderBlocks, and Fair Value Gaps.
- Order Block, and Fair Value Gap markings and options, for Up direction and Down direction.
- Options to show mitigated Order Blocks and FVGs in different color, and extend the rectangle to the bar where price
touched the previous Order Block and FVG.
- Show the Order Block and FVG where price hasn't been mitigated (hasn't reached back yet), and extend the rectangle
all the way to the current bar, to show where price could possibly be reaching (important price levels used by Smart
Institutional Money on higher timeframes to get liquidity).
- Turn Higher Timeframe lines on and off, turn time zone display on and off, turn Silver Bullets zone on and off.
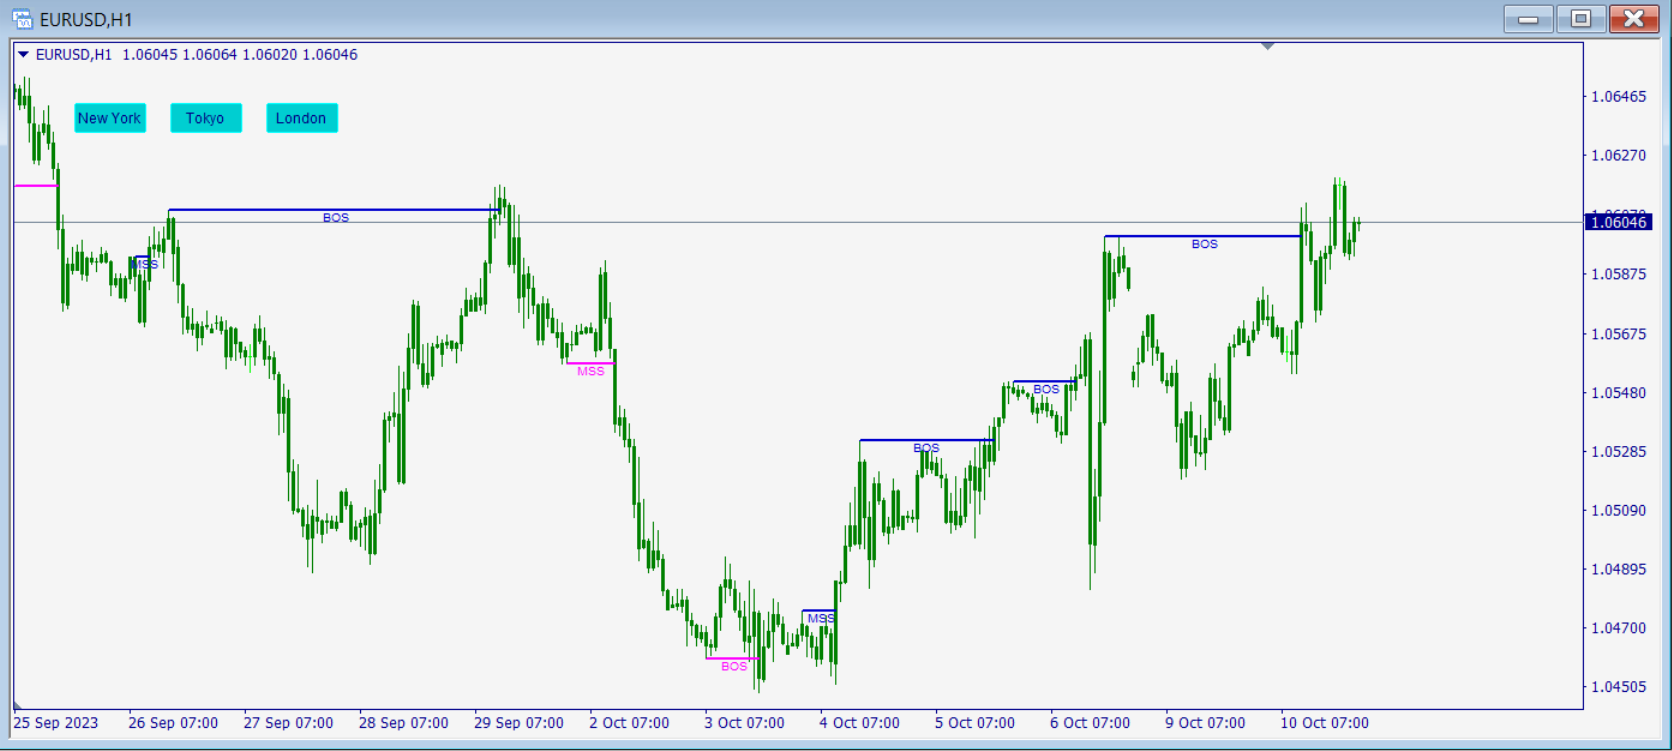
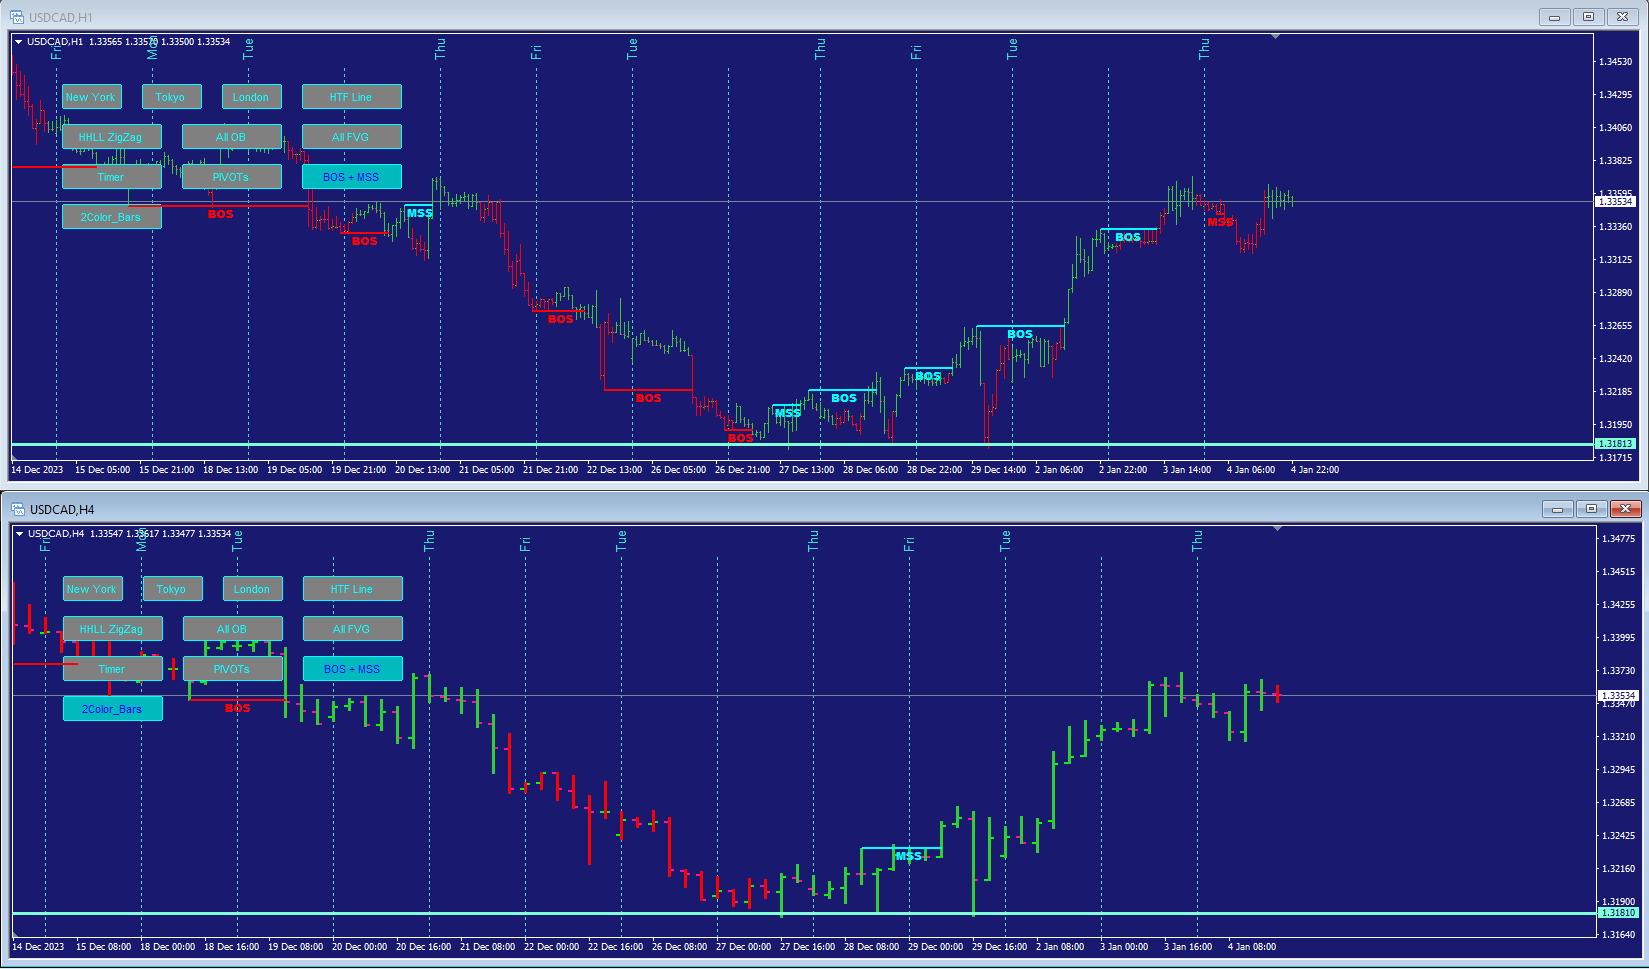
- BOS ( Break of Market Structure ) and MSS ( Market Structure Shift ), for both bullish and bearish direction. Option to
turn them on and off.
- HH, LH, HL, LL were also added, with the option to show it on chart, or to turn it off.
- Lots of input options for flexible display of Order-Blocks and FVGs.
- User can choose to show mitigated OB and FVG in different colors, and can choose to not show them on chart (only show
OB and FVG that still need to be filled in future price movement. (Gives a clear direction and likelihood of where price can
go in the near future)
- Give user options to mark OB and FVG on these horizontal-colored bars, to make it easier to identify OB and FVG in real
time trading.
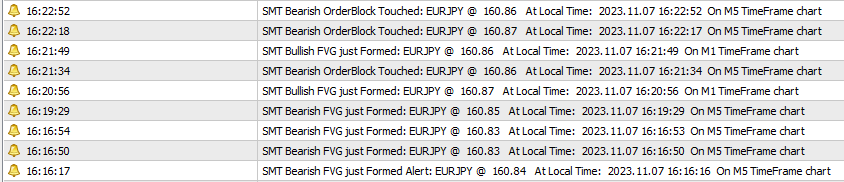
- Alerts for every condition for OrderBlocks and FVGs:
a) when OB is formed.
b) when OB is touched/reached/mitigated.
c) when FVG is formed.
d) when FVG is touched/reached/mitigated.
- Option to write all these OB and FVG alerts into an alert file under FILE sub-directory, so users can review these important
areas and form their own trading strategy based on these information.
- All 4 forms of alerts are supported: web app Notifications messages, sounds, mobile app notifications, and emails.
- Each alert message has exact local timestamp of when it happened, the exact price at the time, and timeframe of the chart.
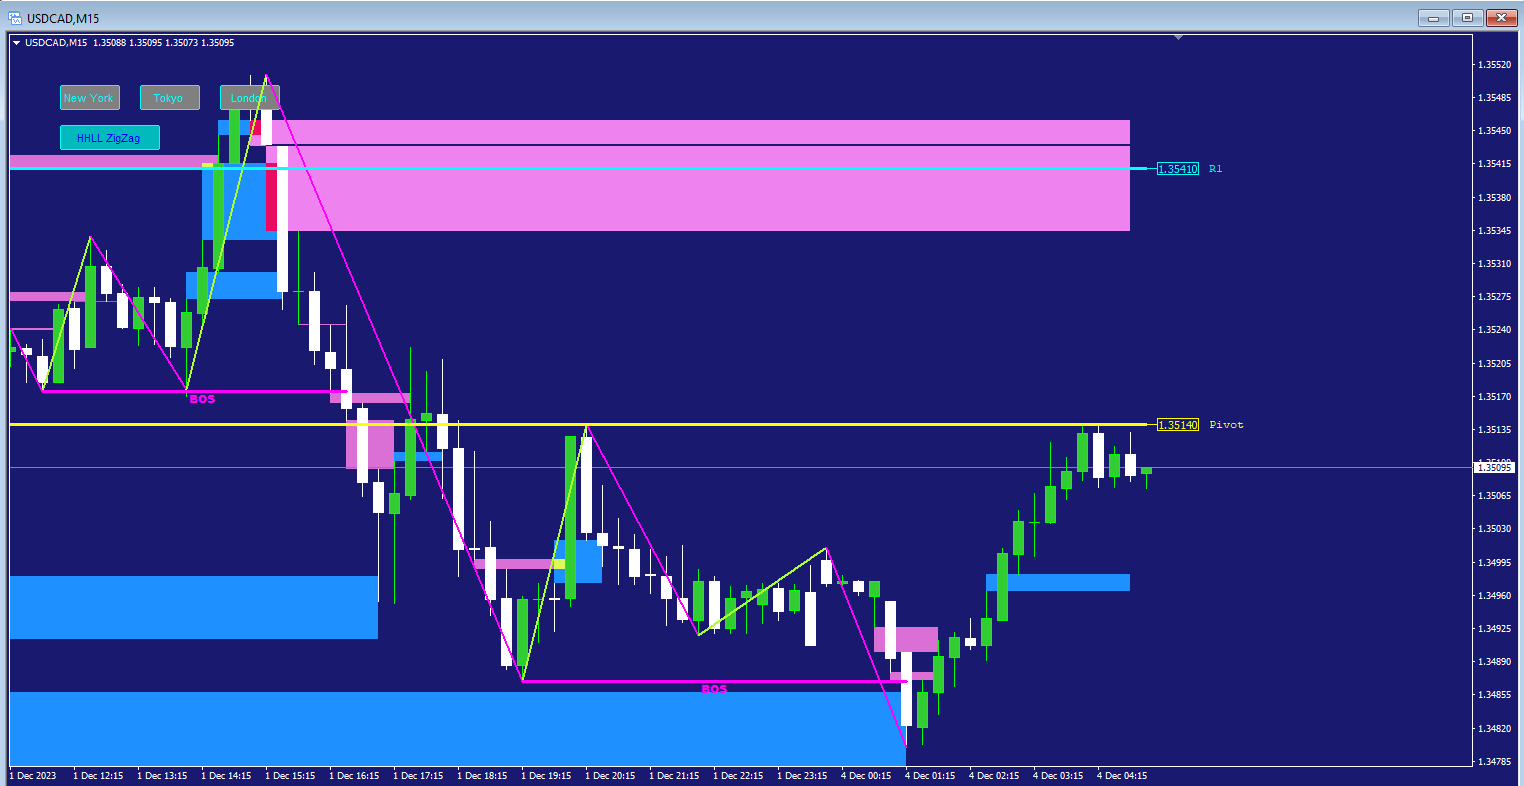
- Pivot Points with exact price and line, and R1,R2,R3, and S1,S2,S3 support and resistance level lines and prices are added.
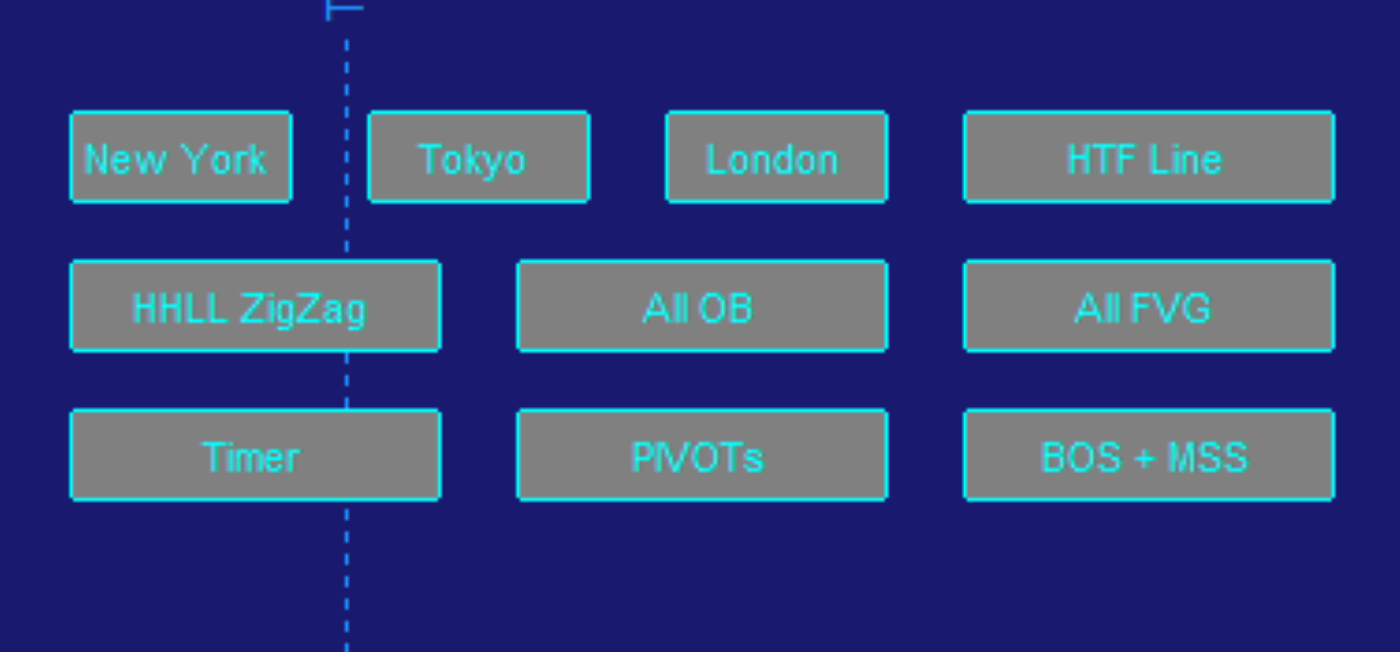
- Button Controls for all features like Silver Bullets, HHLL ZigZag lines, OrderBlock, Fair Value Gap, Bos/MSS, timer, Pivots and etc.
- Panel Control, to show all these buttons, or off, to save space on chart. With 1-click, the panel will display all buttons, or
turn all buttons off.
4. Added functions to show bars in up-trend and down-trend colors.
- option to show uptrend lines, and downtrend lines.
- button to control this feature in main Panel, to show or not show with a click of the button.
( new features and updates are added constantly, so this list is not all inclusive of all features the most recent versions have ).
------------------------------------------------------------------------------------------------------------------------------------------------------------
Free bonus indicator is given away after the purchase. You'll receive unlimited version with free constant updates and new features.
Contact me for your bonus too!


Surprising indicators. Simple, user-friendly, very fast and easy to understand after watching a video or tutorial session. The documentation provided is greatly appreciated, it shows the respect the seller has for their buyer. Thank you for this very interesting tool, very well done and awesome.