• 概述
  • 评论
  • 评论
  • 新特性

Keltner Amplified Breakout

Welcome to the "Keltner Amplified Breakout" Indicator

Are you searching for a powerful and effective trading tool on the MT4 platform? Let us introduce you to the "Keltner Amplified Breakout" Indicator. Designed to help you capture potential trading opportunities, this indicator offers the perfect blend of high performance and user-friendliness.

🔥 Key Advantages:

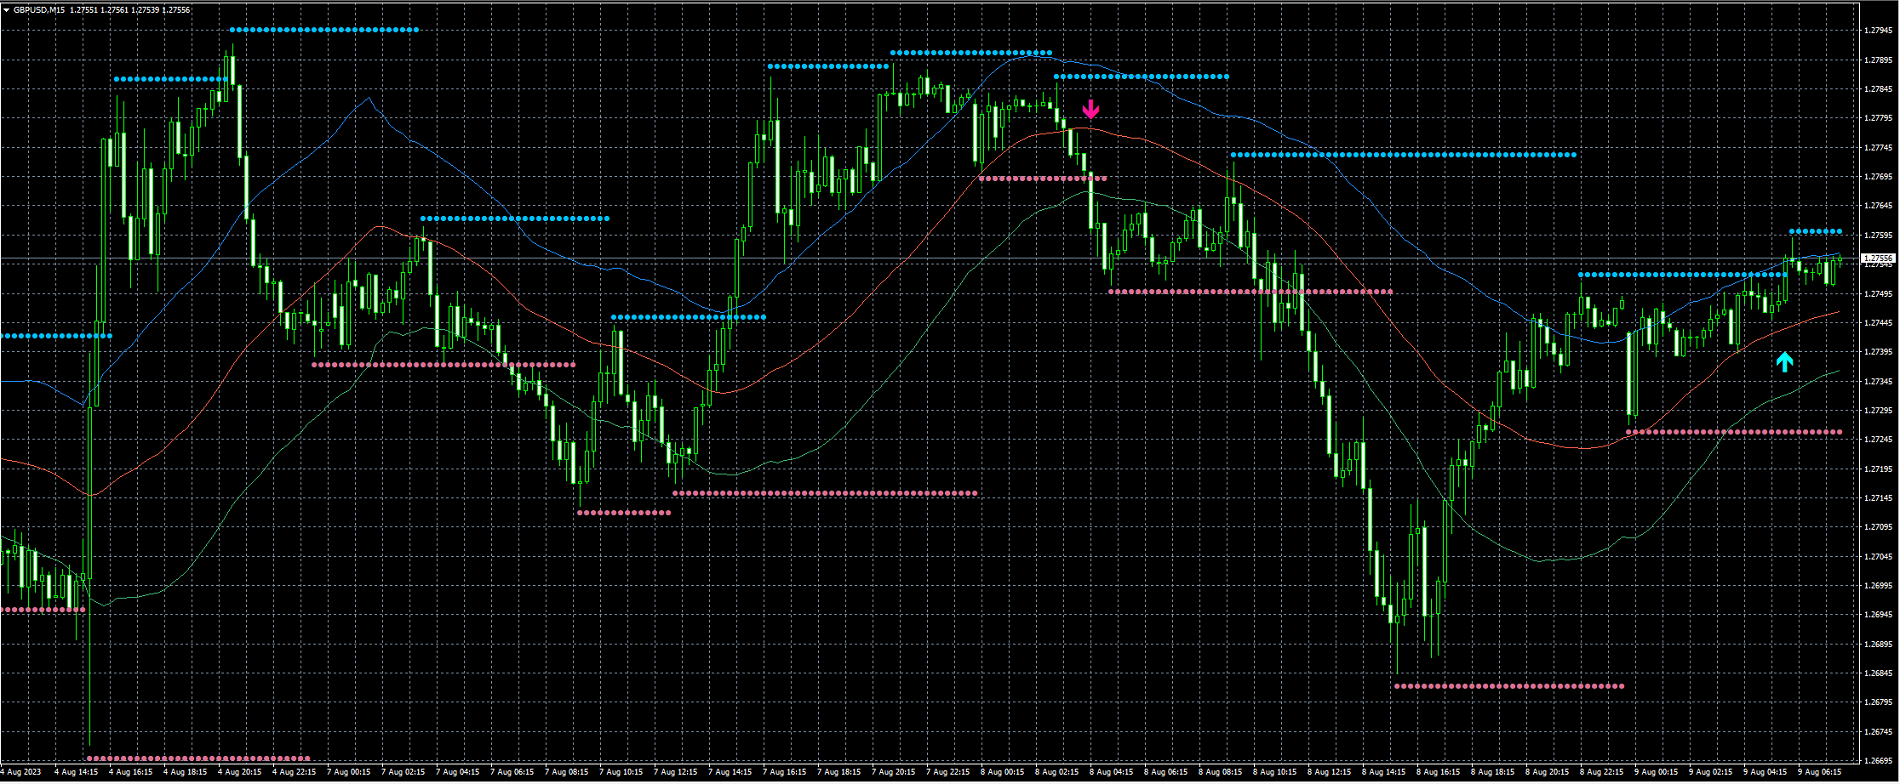
  1. Identify Strong Trends: This indicator utilizes Keltner channels and fractal signals to identify robust upward or downward trends in the market.

  2. Accurate Buy/Sell Signals: Beyond just considering price positions relative to the Keltner bands, it combines fractal signals to generate precise and reliable buy/sell signals.

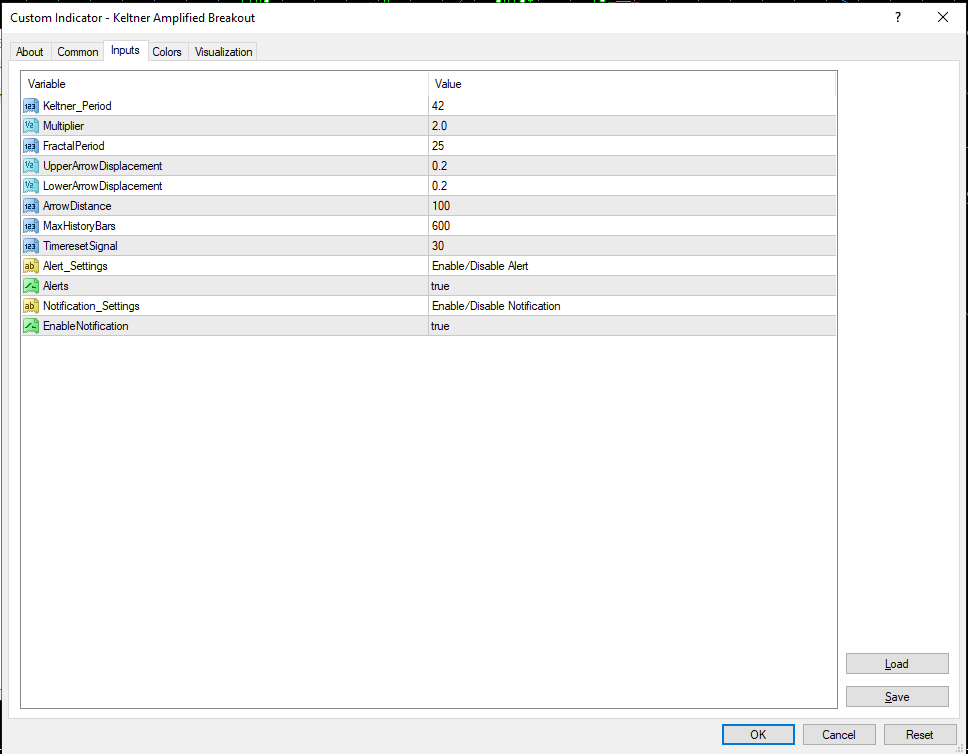
  3. Flexible Customization: Tailor the indicator to match your trading style by adjusting parameters like Keltner period, multiplier, and arrow spacing.

  4. Alerts and System Notifications: Don't miss out on trading opportunities. The indicator supports sound alerts and system notifications to ensure you never miss crucial signals.

🚀 How to Use:

Add the "Keltner Amplified Breakout" Indicator to your MT4 chart, and you'll gain a comprehensive view of potential buy/sell signals. When these signals appear, you can consider opening corresponding trade positions.

🛡️ Note:

Always remember that trading in the financial market involves risk. Before getting started, ensure you thoroughly understand relevant aspects and adhere to risk management principles.

Don't miss out on potential trading opportunities. Visit the product page on the MQL5 platform for more details and start using the "Keltner Amplified Breakout" Indicator today!

We wish you success in promoting this product and attracting attention from the trading community.


推荐产品
Introduction to Harmonic Volatility Indicator Harmonic Volatility Indicator is the first technical analysis applying the Fibonacci analysis to the financial volatility. Harmonic volatility indicator is another level of price action trading tool, which combines robust Fibonacci ratios (0.618, 0.382, etc.) with volatility. Originally, Harmonic Volatility Indicator was developed to overcome the limitation and the weakness of Gann’s Angle, also known as Gann’s Fan. We have demonstrated that Harmonic
True SnD
Indra Lukmana
5 (1)
This Supply & Demand indicator uses a unique price action detection to calculate and measures the supply & demand area. The indicator will ensure the area are fresh and have a significant low risk zone. Our Supply Demand indicator delivers functionality previously unavailable on any trading platform. Trading idea You may set pending orders along the supply & demand area. You may enter a trade directly upon price hit the specific area (after a rejection confirmed). Input parameters Signal - S
Gartley Projection D
Oleksandr Medviediev
3.71 (7)
具有经过验证的概念和盈利能力的最佳、最有效、可靠的产品。感谢您的考虑。  该指标根据H.M.Gartley的发展(《股票市场利润》,1935年)识别和确认谐波模式(XABCD)。 它将D点投影为透视投影中的一个点(在设置中指定ProjectionD_Mode = true)。 不会重绘。当工作时间段的柱形图关闭时,如果已识别的模式点在Patterns_Fractal_Bars柱中未移动,则在图表上出现一个箭头(指向预期价格运动的方向)。从此刻起,箭头将永久保留在图表上。 注意:连续出现2-3个或更多箭头 - 这是市场条件的变化,而不是重绘。 总共有85种模式(包括Gartley-222和Gartley-222WS,完整列表可在评论部分的Google Drive链接中找到)。在所有已识别的模式中,只有最新识别的模式填充了单一颜色。 参数 DrawPatterns(true/false)- 以实心颜色绘制模式 ProjectionD_Mode(true/false)- 定义D点作为透视投影模式 Patterns_Fractal_Bars - 在认定为形
Abcde MT4
Mahsa Farjami
ABCDE指标: 这个指标基于价格行为的主要ABC模式(即突破、回撤、运动)。这些模式类似于上涨基础上涨模式,需要进行趋势分析和背离分析等一系列分析来检查并发出准确的信号。它将提供相当准确的交易信号,并告诉您什么时候开仓和平仓最为合适。它可以应用于任何金融资产:外汇、加密货币、贵金属、股票和指数。 主要特点: •   非常易于使用 •   多时间框架警报 •   固定价格的止损和获利订单。 •   可以与任何交易工具一起使用(外汇、差价合约、期货等) •   电子邮件提醒 •   电话通知 •   它将提供相当准确的交易信号,并告诉您何时最好开启和关闭交易。 •   在图表上显示开仓线、止损、获利。 •   有免费演示版本。 推荐设置: •    EURUSD,M15(15分钟图表) •    显示趋势验证:True •    显示增量蜡烛图:True 什么是理想的入场点? 进入交易的最佳点是由星形和钻石形态所代表的E点。这些模式将在设置中启用“显示趋势验证”和“显示增量蜡烛图”时显示出来。 我该如何使用ABCD指标进行交易?
This indicator Super Neuro Trend indicator.Indicator displays trend movement. Indicator helps to buy and sell. Features FiltPer- displays indicator period. deviation - displaus indicator deviation. Trend - displaus indicator trend.( true,false) Rectangle - displaus indicator rectangle. (true,false)  How to understand the status: If the trend color is green, trend is up. I f the trend color is red, trend is down. I f the trend waiting,trend waiting.     /////////////////////////////////////////
BeST_Gann Swing Oscillator is an MT4 indicator that is based on the corresponding work of Robert Krausz who introduced it in the book “ A.W.D Gann Treasure Discovered ” . The Gann Swing Oscillator is a range-bounding technical indicator that oscillates between +1 and -1 and thus it describes the market swings. Generally when the market is in an upswing, the Gann Swing Oscillator describes it as 2 higher highs with the value of +1 while after an upswing, the downswing is expected. Also the do
PZ 123 Pattern
PZ TRADING SLU
3.75 (4)
123模式 是最受欢迎,功能强大和灵活的图表模式之一。该模式由三个价格点组成:底部,峰值或谷值以及38.2%至71.8%之间的斐波纳契回撤位。当价格突破最后一个峰值或谷值时,该形态被认为是有效的,此时指标绘制箭头,发出警报并可以进行交易。 [ 安装指南 | 更新指南 | 故障排除 | 常见问题 | 所有产品 ] 清除交易信号 可自定义的颜色和尺寸 实施绩效统计 可定制的斐波那契回撤水平 显示适当的止损和获利水平 该指标可用于查找连续或反转形态 它是不可重涂和不可重涂的 它实现了电子邮件/声音/视觉警报 123模式 可以表现为连续或反转模式。为了简化操作,该指标使您可以选择要寻找哪种类型的形态,使其成为趋势或反转交易者的绝佳工具。 设置 将指标加载到任何图表时,将显示一组选项作为输入参数。如果您认为它们太多,请不要感到失望,因为参数被分组为不言自明的块。这就是每个参数块的作用。 幅度-幅度表示替代价格点之间的最小柱线量。要找到大图案,请增加幅度参数。要查找较小的模式,请减小幅度参数。 闵。回撤-形态中所需的最小斐波那契回撤。设置为零不对其进行评估。 最大。回撤-形态中可能
The indicator scans for Dinapoli thrust pattern in multiple timeframes for a specific market. Key Features Indicator can be used for all markets It can scan for thrust pattern on W1, D1, H4, H1, M30, M15 and M5 timeframes Ability to choose number of bars required above/below displaced moving average to define thrust Able to move display label on chart by single click Parameters Minimum Bars: Least amount of bars to account for Thrust DMA Period: Moving average period DMA Shift: Number or bars re
Introduction to X3 Chart Pattern Scanner X3 Cherart Pattern Scanner is the non-repainting and non-lagging indicator detecting X3 chart patterns including Harmonic pattern, Elliott Wave pattern, X3 patterns, and Japanese Candlestick patterns. Historical patterns match with signal patterns. Hence, you can readily develop the solid trading strategy in your chart. More importantly, this superb pattern scanner can detect the optimal pattern of its kind. In addition, you can switch on and off individu
Price Boundary Predictor
Michael Rajnarine Sawh
A powerful chart indicator which intelligently analyses Index, FX & Commodity prices to identify the strongest support and resistance price boundaries. Each line shows where prices consistently close, while the frequency of these matching prices is quoted to reflect each boundary strength. Use these predictive boundaries to identify pivot points, resistance and support levels for crossover, trending, reversal and channel strategies. For FX pairs, set volatility filter = 1 For Indices & Commodi
Bullish Engulfing Signal For Monitoring  Valid on Weekly, Daily, H4, H1, M30 , M15  Cand Valid on signal bullish engulfing Candlestick can sent on Telegram and android custom ID can Check level for  engulfing candlestick  we have 1 , 2 , 3, 4, 5 level  auto update after close candle stick  some to know if more question dont hestitate to contact owner if want custom user needed =========================================================================== Version indonesia 
Monster Harmonic Indicator
Paul Geirnaerdt
4.61 (31)
Monster Harmonics Indicator is a harmonic pattern indicator. It recognizes Gartley, Bat, Crab, Butterfly, Cypher, White Swan, Black Swan, Shark and several other patterns. Projected patterns that are not yet completed are recognized, too. Monster even shows the PRZ (Potential Reversal Zone). Users can add their own user defined patterns to Monster. Besides the current pattern, Monster also shows all patterns in the symbols history. Monster will provide alerts for developing patterns. Introduced
ATeam Divergence
Hoang Ngoc Thach
The CCI Divergence is a reasonably useful indicator in itself, but it is even more effective when used with divergence pattern trading. The CCI Divergence indicator signal is one of the most potent signals among the indicators that exist in the market. Here is new version for Divergence Indicator using CCI method, with more improvements. Divergences indicate a potential investment point because the directional moment does not confirm the price. A bullish divergence occurs when the underlying
Gioteen Volatility Index (GVI)   - your ultimate solution to overcoming market unpredictability and maximizing trading opportunities. This revolutionary indicator helps you in lowering your losing trades due to choppy market movements. The GVI is designed to measure market volatility, providing you with valuable insights to identify the most favorable trading prospects. Its intuitive interface consists of a dynamic red line representing the volatility index, accompanied by blue line that indicat
首先,值得强调的是,这个交易工具是非重绘、非重画和非滞后的指标,非常适合专业交易。 在线课程,用户手册和演示。 智能价格行动概念指标是一个非常强大的工具,既适用于新手,也适用于经验丰富的交易者。它将超过20个有用的指标合并到一个指标中,结合了高级交易思想,如内圈交易员分析和智能资金概念交易策略。该指标侧重于智能资金概念,提供有关大型机构交易方式的见解,帮助预测它们的动向。 它在流动性分析方面尤其擅长,有助于理解机构的交易方式。它擅长预测市场趋势,并仔细分析价格波动。通过将您的交易与机构策略对齐,您可以更准确地预测市场走向。该指标多才多艺,擅长分析市场结构,识别重要的订单区块,并识别各种模式。 它擅长识别BOS和CHoCH等模式,理解动量的转变,并突出显示供需强劲的关键区域。它还擅长发现强大的不平衡,并分析价格创造更高高点或更低低点的模式。如果您使用斐波那契回撤工具,该指标可以满足您的需求。它还可以识别相等的高点和低点,分析不同的时间框架,并通过仪表板显示数据。 对于使用更高级策略的交易者,该指标提供了工具,如公平价值差指标和优惠和折扣区域的识别。它特别关注高时间框架订单
Trend Scanner
Vladimir Kalendzhyan
4.38 (8)
By purchasing this indicator, you have the right to receive a free copy of one of   my other indicator's or advisor’s!  (All future updates are included. No limits) . To get it , please contact me by  mql5 message ! The Trend Scanner trend line indicator displays the trend direction and its changes. The indicator works on all currency pairs and  timeframes. The indicator simultaneously displays multiple readings on the price chart: the support and resistance lines of the currency pair, the exist
A top-quality implementation of the famous  Zig Zag  indicator, which needs no introduction. It is completely coming from original algorithm.  After you have this indicator, you will no need any more indicator for opposite direction of trend. Trading direction of TREND Very easy to understand and set  It implements a multi-timeframe dashboard Buy and Sell signals on same chart  Working M5-M15-M30-H1-H4 and D1  After the purchase, please contact me for to learn how to use it. 
A must-have tool for any strategy based on divergence detection. 10 different oscillators can be used to detect divergences and can be combined with Double Top/Bottom patterns to confirm reversal signals. SCANNER is included . Now with Scanner you can find trading opportunities and setups easily and faster. Features Easily detect strong reversal signals. 10 different oscillators are available for divergence detection. Divergence & Top/Bottom detection can operate independently or combined. Get
Introduction Excessive Momentum Indicator is the momentum indicator to measure the excessive momentum directly from raw price series. Hence, this is an extended price action and pattern trading. Excessive Momentum Indicator was originally developed by Young Ho Seo. This indicator demonstrates the concept of Equilibrium Fractal Wave and Practical Application at the same time. Excessive Momentum detects the market anomaly. Excessive momentum will give us a lot of clue about potential reversal and
LordTrendSignal
Igor Pereira Calil
LordTrendSignal is a financial market indicator for Meta Trader that checks signals through trends and candles, works on all TimeFrames (M1, M5, M15, M30, H1, H4, D1). LordTrendSignal checks the signal through trends and candles and informs you via notification, alerts via email and push on the automatic screen. The trend flexibility of LordTrendSignal is high, however, together with other of our indicators LordAutoFibonacci and LordAutoTrendLine you will be able to work very well to obtain
Stochastic BR
Antony Augustine
Stochastic BR allows you to recognize reversals professionally. The "Stochastic BR" is designed to recognize profitable counter trend patterns from your chart. Stochastic Indicator: This technical indicator was developed by George Lane more than 50 years ago. The reason why this indicator survived for so many years is because it continues to show consistent signals even in these current times. The Stochastic indicator is a momentum indicator that shows you how strong or weak the current trend
Trend Line Chart Pattern Signals  Is a traders Tool for Signals based on Strong  Patterns Formed By a pair of robust trend lines. They FOR WITH DIFFERENT POPULAR PATTERNS ON CHARTS LIKE – TRIANGLES, FLAGS,RANGE , ASCENDING TRIANGLES, DESCENDING PATTERNS, PENNANTS ETC. The TREND LINES  form  dynamically  on running bars. The  sensitivity  of the trend lines can be changed by custom settings. The  Buy and Sell Signals Generate upon Break Of the Trend Line + "Close" of the same bar above the previo
TrendControl
Ivan Simonika
TrendControl is an arrow indicator of technical analysis for determining a trend, which can adjust to the price, is a graphical plot calculated using mathematical formulas, the initial data for which is a price chart. The indicator shows the direction of the trend, takes into account the minimum and maximum values ​​of the extreme candles on the chart, then brings them to the average and compares them with the past data. The principle of operation of the indicator is to automatically determin
True Magic Oscillator
Muhammed Emin Ugur
The   True Magic Oscillator   indicator is designed for signal trading. This indicator generates trend signals. It uses many algorithms and indicators to generate this signal. It tries to generate signals from the points with the highest trend potential. This indicator is a complete trading product. This indicator does not need any additional indicators. The indicator is never repainted. The point at which the signal is given does not change.         Features and Recommendations Wor
The principle of this indicator is very simple: detecting the trend with Moving Average, then monitoring the return point of a chart by using the crossing of Stochastic Oscillator and finally predicting BUY and SELL signals with arrows, alerts and notifications. The parameters are fixed and automatically calculated on each timeframe. Example: If you install indicator on EURUSD M5: the indicator will detect the main trend with the Moving Average on this timeframe (for example, the Moving Average
This indicator is another variant of the famous powerful indicator Fibonacci-SS https://www.mql5.com/en/market/product/10136 but has different behaviour in placing Pending Order and TP Line. Automatically places Fibonacci retracement lines from the last highest and lowest visible bars on the chart with: An auto Pending Order (Buy/Sell). Taking Profit 1, Taking Profit 2 is pivot point and Taking Profit 3 for extended reward opportunity. The best risk and reward ratio. Simple and powerful indica
M W Pattern Pro
Nesimeye Oswald
4.14 (7)
M & W Pattern Pro is an advanced scanner for M and W patters , it uses extra filters to ensure scanned patterns are profitable. The indicator can be used with all symbols and time frames. The indicator is a non repaint indicator with accurate statistics calculations. To use , simply scan the most profitable pair using the statistics dashboard accuracy , then enter trades on signal arrow and exit at the TP and SL levels. STATISTICS : Accuracy 1 : This is the percentage of the times price hit
VR Cub
Vladimir Pastushak
VR Cub 这是获得高质量切入点的指标。该指标的开发是为了促进数学计算并简化对仓位入场点的搜索。多年来,该指标所针对的交易策略已被证明其有效性。交易策略的简单性是其巨大的优势,即使是新手交易者也能成功进行交易。 VR Cub 计算开仓点以及获利和止损目标水平,这显着提高了效率和易用性。查看使用以下策略进行交易的屏幕截图,了解简单的交易规则。 设置、设置文件、演示版本、说明、问题解决,可以从以下位置获取 [博客] 您可以在以下位置阅读或撰写评论 [关联] 版本为 [MetaTrader 5] 计算入场点的规则 开仓 要计算入场点,您需要将 VR Cub 工具从最后一个高点拉伸到最后一个低点。 如果第一个点在时间上早于第二个点,交易者等待柱线收于中线上方。 如果第一个点在时间上晚于第二个点,交易者等待柱线收于中线下方。 根据上述条件,严格在 柱线收盘 后建仓。 换句话说,如果我们在小时图上进行交易,那么从最高点到最低点的时间距离必须超过24小时,最高点和最低点之间的点数必须大于或等于平均价格变动每天。 维持和改变市场地位 可以有多个未平仓头寸;每个头寸都可以单独修改。 VR Cu
Trend lines master
The Trading Team Ltd
5 (1)
Launch promotion For a limited time only:  30$ instead of 157$ Summary Create precise trend lines in a second Description This indicator will draw your trend lines automatically with great precision, saving you some precious time. It uses Bill Williams Fractals to identify the key points and draws both inner and outer trend lines. Features Automatically draws precise trend lines
该产品的买家也购买
Atomic Analyst
Issam Kassas
5 (3)
首先值得强调的是,该交易指标是非重绘、非延迟的指标,这使其成为手动和机器人交易的理想选择。 用户手册:设置、输入和策略。 Atomic Analyst是一种PA价格行动指标,利用价格的力量和动量来寻找市场上更好的机会。配备了高级过滤器,可帮助去除噪音和假信号,并提高交易潜力。使用多层复杂的指标,Atomic Analyst扫描图表,并将复杂的数学计算转化为任何初学者都能理解并用来做出一致交易决策的简单信号和颜色。 “Atomic Analyst”是专为新手和经验丰富的交易者量身定制的综合交易解决方案。它将高级指标和一流功能融合为一体的交易策略,使其成为所有类型交易者的多功能选择。 日内交易和剥头皮策略:专为快速准确的日内交易和短期交易而设计。 日内和摆动交易策略:可用作追求价格大幅波动的日内和摆动交易者的可靠工具。 多货币和市场:凭借其可靠的精度,在不同的工具和市场上运作。 多个时间框架:可在多个时间框架上使用,性能良好。 稳定性:所有指标均不重绘、不重绘和不滞后,确保可靠的信号。 信号清晰度:提供箭头信号,用于清晰的入场和出场点。 实时警报:通过交易入场、SL和TP警报通知交
Advanced Currency Strength28 Indicator
Bernhard Schweigert
4.9 (663)
目前26%的折扣 任何新手或专家交易者的最佳解决方案! 这个指标是一个独特的、高质量的、可负担得起的交易工具,因为我们纳入了一些专有的功能和一个新的公式。只需一个图表,你就可以读出28个外汇对的货币强度!想象一下,你的交易将如何得到改善,因为你的交易是在你的手中进行的。想象一下,你的交易将如何改善,因为你能够准确地确定新趋势或剥头皮机会的触发点? 用户手册:点击这里  https://www.mql5.com/en/blogs/post/697384 这是第一本,原版的! 不要买一个毫无价值的崇拜者的克隆品。 特别的 子窗口中的箭头显示强劲的货币势头GAP将指导你的交易! 当基础货币或报价货币处于超卖/超买区域(外盘斐波那契水平)时,在个人图表的主窗口中出现警告信号。 当货币力量从外围区间回落时,回撤/反转警报。 十字星模式的特别警报 可选择多个时间框架,以快速查看趋势! 货币强度线在所有的时间框架中都非常平稳,当使用较高的时间框架来识别总体趋势,然后使用较短的时间框架来确定精确的入口时,效果非常好。你可以根据自己的意愿选择任何时间框架。每个时间框架都由其自身进
Scalper Inside PRO
Alexey Minkov
4.75 (57)
An exclusive indicator that utilizes an innovative algorithm to swiftly and accurately determine the market trend. The indicator automatically calculates opening, closing, and profit levels, providing detailed trading statistics. With these features, you can choose the most appropriate trading instrument for the current market conditions. Additionally, you can easily integrate your own arrow indicators into Scalper Inside Pro to quickly evaluate their statistics and profitability. Scalper Inside
TPSpro RFI Levels
Roman Podpora
4.8 (15)
Reversal First Impulse levels (RFI)    INSTRUCTIONS        RUS       -       ENG              R ecommended to use with an indicator   -   TREND PRO -  Version MT5 A key element in trading is zones or levels from which decisions to buy or sell a trading instrument are made. Despite attempts by major players to conceal their presence in the market, they inevitably leave traces. Our task was to learn how to identify these traces and interpret them correctly. Main functions: Displaying active zones
TPSproTREND PrO
Roman Podpora
4.78 (18)
TPSpro TRENDPRO  - is a trend indicator that automatically analyzes the market and provides information about the trend and each of its changes, as well as giving signals for entering trades without redrawing! The indicator uses each candle, analyzing them separately. referring to different impulses - up or down impulse. Exact entry points into transactions for currencies, crypto, metals, stocks, indices!  -  Version MT5               DETAILED DESCRIPTION                R ecommended to use with
Advanced Supply Demand
Bernhard Schweigert
4.92 (311)
现在优惠 33%! 任何新手或专业交易者的最佳解决方案! 该指标是一款独特、高质量、且价格合理的交易工具,因为我们已经整合了许多专有功能和新公式。 依据此更新,您将能够显示双重时间帧区域。 您不仅可以显示一个较高的时间帧,还可以同时显示图表时间帧,加上更高的时间帧:显示嵌套时区。 供需双方所有交易者都会喜欢它。 :) 重要信息披露 高级供需的最大潜力,请访问 https://www.mql5.com/zh/blogs/post/720245   想象您的交易如何得以改善,是因为您能够精准定位入场或目标位吗? 构建于新的底层算法,它可以更轻松地识别出买卖双方之间的潜在失衡。 这是因为它以图形方式展示供需最强劲区域,及其过去的表现(显示旧区域)。 这些功能旨在帮助您更轻松地发现最佳入场区域和价位。 现在您可以针对您的交易品种和时间帧来优化和编辑区域强度! 高级供需指标适用于所有产品和时间帧。 它是一个新的公式,非常新的功能是两个区域强度函数可由用户输入进行调整! 这在交易中是一大优势。 当您学习如何使用专有功能,例如带有价格游离最小 X 因子的区域强度时,您能够判断该区域强劲与否。 供
TrendMaestro
Stefano Frisetti
5 (3)
note: this indicator is for METATRADER4, if you want the version for METATRADER5 this is the link:  https://www.mql5.com/it/market/product/108106 TRENDMAESTRO ver 2.4 TRENDMAESTRO recognizes a new TREND in the bud, he never makes mistakes. The certainty of identifying a new TREND is priceless. DESCRIPTION TRENDMAESTRO identifies a new TREND in the bud, this indicator examines the volatility, volumes and momentum to identify the moment in which there is an explosion of one or more of these data a
FX Volume
Daniel Stein
4.6 (35)
通过 mql5 和 Telegram 上 的 " 晨间简报 "获取每日市场更新,包括详细信息和屏幕截图 ! 外汇交易量(FX Volume)是第一个也是唯一一个从经纪商角度真正洞察市场情绪的交易量指标。 直接在您的图表上看到这些信息是真正改变游戏规则和突破性的交易解决方案。 受益于独特的市场数据洞察,如 比率(Ratios )显示货币多头和空头头寸的比率(百分比 比率变化 显示所选时间段内的多头比率及其百分比变化 总交易量 显示货币的总交易量(多头和空头),以手为单位 多头 交易量显示货币所有多头头寸的交易量 空头 交易量显示所有货币空头头寸的交易量 净多头 显示净多头交易量,即所有多头头寸减去所有空头头寸(以手为单位)。 净多头百分比 显示货币净多头交易量的变化 请阅读我们的基本教程 -> "如何使用外汇交易量进行交易 " 获取更多信息,如常见问题、交易技巧和教程视频,请访问我们的 外汇交易量公共信息频道 请 安装并运行 SI Connect 以建立与我们数据中心的持续连接 背景信息 我们都知道,外汇是一个分散的市场。这就是为什么我们必须打破常规思维,开发一个独
ON Trade Optuma Astro
Abdullah Alrai
5 (4)
当然可以!以下是您提供的文本的中文翻译: 引入 MT4 天文指标:您的终极天体交易伙伴 您准备好将交易体验提升到天文高度了吗?不用再寻找,就在我们的革命性 MT4 天文指标中。这个创新工具超越了传统的交易指标,利用复杂的算法提供无与伦比的天文洞察力和精确计算。 指尖上的宇宙信息: 瞻仰一个详尽的面板,展示了一宝藏般的天文数据。了解行星的地理/太阳心坐标,太阳/地球距离,亮度,伸长度,星座,黄道和赤道坐标,甚至是水平坐标——每个细节都经过精心计算并呈现得美轮美奂。指标生成的垂直线对应于时间值,为您的交易旅程提供了宇宙的视角。 行星线条与关系: 在您的图表上欣赏行星线条的魔力,具有可自定义的比例和角度。通过直观的控制面板轻松切换每个行星线条的可见性。通过连结、六分、四分、三分、对冲和逆行等指标,发现行星关系的艺术。在您选择的时间范围内探索这些宇宙构造,使您能够识别重要的交易机会。 揭示甘恩的智慧: 通过受甘恩启发的平方垂直线揭示潜在的反转时机。这种创新修改将甘恩历经考验的原则带入现实,帮助您提前了解市场的转向和趋势。 月亮引导: 在您的图表上优雅地导航月相,因为新月和满月点缀其间。月亮周期
Gann Swing Structure
Kirill Borovskii
5 (1)
This indicator is based on the mathematics of the great trader W.D. Ganna. With its help, you can easily find strong levels by analyzing swings to find the optimal entry point. The indicator works on all instruments and all timeframes. The indicator is fully manual and has control buttons. All you need to do is press the NEW button, a segment will appear, which you can place on any movement, swing or even 1 candle that you want to analyze. By placing the segment, press the OK button. A grid (th
FX Power MT4 NG
Daniel Stein
5 (10)
通过 mql5 和 Telegram 上 的晨间简报获取每日市场更新,包括详细信息和屏幕截图 ! FX Power MT4 NG 是我们长期以来非常受欢迎的货币强度计算器 FX Power 的下一代产品。 这款下一代强度计算器能提供什么?您所喜爱的原版 FX Power 的所有功能 附加功能 黄金/XAU 强度分析 更精确的计算结果 可单独配置的分析周期 可自定义计算限制,以获得更好的性能 为希望查看更多信息的用户提供特殊的多实例设置 无尽的图形设置,可在每个图表中设置您最喜欢的颜色 无数的通知选项,让您再也不会错过任何重要信息 采用 Windows 11 和 macOS 风格的全新圆角设计 神奇的移动指标面板 FX Power 主要功能 所有主要货币的完整强势历史 所有时间框架内的货币强弱历史 所有经纪商和图表的计算结果完全相同 100% 可靠的实时计算 -> 无重绘 可通过下拉列表选择分析时段 通过自定义模式单独配置分析时段 可在一个图表中使用多个实例 可移动 FX Power 显示屏(通过拖放) 适用于高分辨率 QHD、UHD 和 4K 显示器 自动终端配置 针对平板电脑
目前八折优惠! 对任何新手或专家交易者来说都是最好的解决方案! 这个仪表板软件适用于28种货币对。它基于我们的两个主要指标(高级货币强度28和高级货币冲动)。它对整个外汇市场提供了一个伟大的概述。它显示高级货币强度值,货币运动速度和28个外汇对在所有(9)时间段的信号。想象一下,当你可以使用图表上的单一指标观察整个市场,以确定趋势和或剥头皮的机会时,你的交易将得到改善 我们已经在这个指标中建立了一些功能,使你更容易识别强势和弱势货币,同时识别和确认潜在的交易。该指标以图形方式显示货币的强势或弱势是增加还是减少,以及它在所有时间段的表现。 增加的新功能是动态市场斐波那契水平,它适应当前的市场条件变化,这是一个已经在我们的高级货币强度28和高级货币冲动指标中使用的成熟的加分项。 在交易时,总是将弱势货币和强势货币配对,这个新指标将帮助你做到这一点。 用户手册:点击这里  https://www.mql5.com/en/blogs/post/708783 特点  显示每个时间段的ACS28和GAP-speed(冲动)的货币强度值。 列:颜色代码以7种颜色
Dragon Multi Indicator MT4
Mansour Babasafary
5 (4)
3 Indicators in 1 indicator Strategy based on price action Made specifically for the best forex currency pairs Can be used in the best time frame of the market at a very reasonable price This indicator is basically 3 different indicatos . But we have combined these 3 indicators in 1 indicator so that you can use 3 indicators at the lowest price. All three strategies are based on price action. But based on different trends. Long term, medium term and short term Attributes : No repaintin
Full Forex Market View Dashboard
Opengates Success International
5 (2)
完整的外汇市场视图仪表板指示器 这是一个自定义指标,旨在让交易者全面了解市场上正在发生的事情。 它使用实时数据访问市场并显示成功交易所需的每一点信息。 安装: 在将此指标附加到您的窗口图表之前,请转到您的 MT4 的市场观察面板并隐藏所有您不需要或交易的货币对,并将其余货币对留在那里。 原因是 FFMV 仪表板将显示出现在 MT4 市场观察中的所有货币对。 它最多可以显示 30 个或更少的货币对。 如果它超过您 MT4 的市场观察中的那个,它会模糊和毁坏 FFMV 仪表盘上的字体和图像! 它不会正确显示。 用法:      单人交易      对于篮子交易(见截图如何)      也可用于多单交易      确认从您自己的交易系统等收到的信号的有效性。 成分:      时间范围:从 M1 到 MN1 当前蜡烛状态(买入/卖出      趋势:币种整体走势      影响:货币变动的幅度/波动性,见下文:      建立:货币正在建立      好:货币越来越严重      高:币值值得关注      强:要考虑方向  
ECM Channel MT4
Paulo Rocha
5 (1)
ECM Elite Channel is a volatility-based indicator, developed with a specific time algorithm, which consists of finding possible corrections in the market. This indicator shows two outer lines, an inner line (retracement line) and an arrow sign, where the channel theory is to help identify overbought and oversold conditions in the market. The market price will generally fall between the boundaries of the channel. If prices touch or move outside the channel, it's a trading opportunity. The
Quantum Trend Sniper Indicator MT4
Bogdan Ion Puscasu
4.6 (40)
介绍   量子趋势狙击指标 ,突破性的 MQL5 指标,正在改变您识别和交易趋势反转的方式!由拥有超过13年交易经验的资深交易员团队开发,     量子趋势狙击指标   旨在通过其创新的方式以极高的准确度识别趋势反转,将您的交易之旅推向新的高度。 ***购买量子趋势狙击指标,即可免费获得量子突破指标!*** 当量子突破指标识别出趋势反转时,它会向您发出警报和信号箭头,并建议您三个止盈水平。 它既适合新手交易者,也适合专业交易者。 量子 EA 通道:       点击这里 MT5版本:       点击这里 建议: 时间范围:  所有时间范围。为了获得最佳结果,我们建议在 M15、M30 和 H1 时间范围内使用它。 货币对:欧元兑美元、英镑兑美元、澳元兑美元、欧元兑英镑, EURAUD, XAUUSD 账户类型:ECN、Raw 或 Razor,点差极低 经纪时间:任意 经纪商:IC Markets、Pepperstone with Raw 和 Razor 的点差最低 建议止损:50 点 建议止盈水平:20 点、50 点和 1
Volatility Trend System - a trading system that gives signals for entries. The volatility system gives linear and point signals in the direction of the trend, as well as signals to exit it, without redrawing and delays. The trend indicator monitors the direction of the medium-term trend, shows the direction and its change. The signal indicator is based on changes in volatility and shows market entries. The indicator is equipped with several types of alerts. Can be applied to various trading
XQ Indicator MetaTrader 4
Marzena Maria Szmit
3 (2)
Step into the realm of Forex trading with confidence and precision using XQ, a cutting-edge Forex indicator designed to elevate your trading game to unprecedented heights. Whether you're a seasoned trader or just stepping into the world of currency exchange,   XQ Forex Indicator   empowers you with the insights and signals needed to make informed trading decisions. The signal conditions are a combination of three indicators, and XQ Forex Indicator only display  medium and long-term trends . The
Bands Sniper
Abdulkarim Karazon
5 (1)
目前价格仅限10本,之后价格为90美元 基于包络线和带有箭头的 tma,波段狙击指标是一种多用途指标,因为它显示动态支撑和阻力,还提供买入和卖出箭头等入场信号。 默认设置基于 1 小时时间范围,购买后请联系以获取完整指南。 参赛规则: 买入:1.蜡烛收盘价低于两条频带          2.蜡烛收盘价回到 2 个带内,带有 2 个向上箭头(金色箭头和橙色箭头) 卖出 : 1.蜡烛收于两条带之上          2.蜡烛收盘价回到 2 个带内,带有 2 个向下箭头(金色箭头和橙色箭头) TP 1 : 中带线 TP 2 :相反波段 SL 箭头下方的几个点 建议的时间范围是:15M 及以上 =====================================================
Currency Strength Exotics
Bernhard Schweigert
4.88 (33)
目前8折优惠! 对任何新手或专家交易者来说都是最好的解决方案! 这个指标是专门用来显示任何符号的货币强度,如异国货币对、商品、指数或期货。它是同类产品中的第一个,任何符号都可以添加到第9行,以显示黄金、白银、石油、DAX、US30、MXN、TRY、CNH等的真实货币强度。这是一个独特的、高质量的、负担得起的交易工具,因为我们已经纳入了一些专有的功能和一个新的公式。想象一下,你的交易将如何改善,因为你能够准确地确定新趋势或剥头皮机会的触发点? 用户手册:点击这里   https://www.mql5.com/en/blogs/post/708876 它适用于所有时间框架。你将很快能够看到TREND! 根据新的基础算法设计,它使识别和确认潜在交易变得更加容易。这是因为它以图形方式显示了8种主要货币和一种符号的强弱。 该指标显示了8种主要货币(澳元加元瑞士法郎欧元英镑日元新西兰美元)的强弱线,再加上一个符号! 该指标显示了符号的真实价值。例如:对于XAUUSD(黄金):价格以美元报价。如果黄金在上涨,你怎么能知道是黄金的强势还是美元的弱势?只有当黄金走强时,我们才会进行
Backtesting Simulator MT4
Diego Arribas Lopez
3.5 (2)
[ MT5 Version ] Backtesting Simulator Are you tired of spending months on demo or live accounts to test your trading strategies? The Backtesting Simulator is the ultimate tool designed to elevate your backtesting experience to new heights. Utilizing Metatrader historical symbol information, it offers an unparalleled simulation of real market conditions. Take control of your testing speed, test ideas quickly or at a slower pace, and witness remarkable improvements in your testing performance. For
Quantum Breakout Indicator PRO
Bogdan Ion Puscasu
4.96 (26)
介绍     Quantum Breakout PRO   ,突破性的 MQL5 指标,正在改变您交易突破区域的方式!   Quantum Breakout PRO 由拥有超过 13 年交易经验的经验丰富的交易者团队开发,旨在通过其创新和动态的突破区域策略将您的交易之旅推向新的高度。 量子突破指标将为您提供带有 5 个利润目标区域的突破区域的信号箭头,以及基于突破框的止损建议。 它既适合新手交易者,也适合专业交易者。 量子 EA 通道:       点击这里 MT5版本:   点击这里 重要的!购买后请私信我领取安装手册。 建议: 时间范围:M15 货币对:GBPJPY、EURJPY、USDJPY、NZDUSD、XAUUSD 账户类型:ECN、Raw 或 Razor,点差极低 经纪商时间:GMT +3 经纪商:IC Markets、Pepperstone with Raw 和 Razor 的点差最低 规格: 不重漆! 最多 5 个建议利润目标区域 建议止损水平 可定制的盒子。您可以设置自己的 Box Time Start 和 Box Time E
PZ Turning Points MT4
PZ TRADING SLU
1 (1)
该指标检查不同时期分形的价格结构,以确定市场中可能的反转点,从而为已经具有基本或技术估值模型的仓位交易者提供时机。与它的弟弟 Reversal Fractals不同 ,该指标不会因为所选时期而错过反转,并且会以之字形方式找到反转分形,而忽略那些没有足够动量来引发持续价格波动的反转。 [ 安装指南 | 更新指南 | 故障排除 | 常见问题 | 所有产品 ] 转折点可以开始长期趋势 指示器不重涂 它实现了各种警报 可自定义的颜色和尺寸 该指示符是无功或滞后信号,因为分形是奇数个条形的地层,是中间地带中最高或最低的条形,并且指示符在分形中的所有条形都闭合时绘制。但是,具有预先设定的方向偏差的交易者会发现该指标非常有用,可以提早进入切入点。 该指标既不是下探信号指标,也不是完整的交易系统。请不要这样评价或审查它。 输入参数 最小分形数:分形上的最小条形数。必须为奇数,例如3、5、7、9、11、13,... 最大分形:分形上的最大条形数量。必须为奇数,例如3、5、7、9、11、13 ... 最大历史柱数:指标加载时评估的过去柱数。 颜色:自定义箭头和线条的颜色和大小。 警报:启用
PZ Order Block
PZ TRADING SLU
订单块的个人实现,一种简单而有效的头寸交易策略。如果价格范围没有在与突破相反的方向被突破,则交易者应进入市场或在最后一个订单块的方向上寻找交易。为清楚起见,未绘制开放块。 [ 安装指南 | 更新指南 | 故障排除 | 常见问题 | 所有产品 ] 一个看涨的开盘是在一个新的市场低点之后的第一个看涨柱 看跌的开盘是在新的市场高点之后的第一个看跌柱 当打开的块被破坏时出现信号,成为订单块 当一个订单块被打破到相反的一侧时,它就变成了一个反转块 该指标实施各种警报 它不会重新粉刷或重新粉刷 输入参数 周期:创建新高或新低所需的柱线数量。较小的值会产生更多的信号。 最小 ATR 过滤器:订单块栏的最小主体尺寸,表示为 ATR 的乘数。 Max ATR Filter:订单块的最大主体尺寸,表示为 ATR 的乘数。 颜色:设置线条和箭头的颜色和大小。 警报:启用显示/电子邮件/推送/声音警报。 支持和问题 使用帮助台解决问题或及时获得支持。写一封电子邮件至:help@pointzero-trading.com。 作者 Arturo López Pérez,私人投资者和投
Best Currency Strength Indicator
Tumelo Patrick Rakotsoane
4.6 (47)
Advanced Currency Strength Indicator The Advanced Divergence Currency Strength Indicator. Not only it breaks down all 28 forex currency pairs and calculates the strength of individual currencies across all timeframes , but, You'll be analyzing the WHOLE forex market in 1 window (In just 1 minute) . This indicator is very powerful because it reveals the true movements of the market.  It is highly recommended to  analyze charts knowing the performance of individual currencies or the countries ec
EZT Trend
Tibor Rituper
4 (1)
EZT 趋势指标将向您显示趋势、回调和入场机会。 提供可选的过滤和所有类型的警报。 添加电子邮件和推送通知警报。 我们还在开发基于该指标的 EA,即将推出。 它是一个多功能指标,由两个颜色直方图和一条线组成。 它是趋势方向和强度的直观表示,您也可以在线上或直方图上多次发现背离。 该指标与自动参数设置配合良好。 这些是针对给定时间范围预先确定的,我们建议使用具有该设置的指标。 在手动模式下,您可以设置自己的参数。 这是一个多时间框架 (mtf) 指标。 该指标与我们的其他指标(例如 MTF rsi 或 MTF cci 或 MACD pro)组合起来效果很好。 交易工具的波动性越大,您寻找最佳入场机会的时间范围就越小。 始终考虑更高的时间范围方向! 为此,您应该使用更多指标实例。 输入 参数模式:可选择“手动参数”或预设的“自动参数”。 自动参数处于多时间范围模式。 示例:当您设置自动 H1 参数时:您可以看到从 H1 时间范围一直到 1 分钟的相同显示。 在此设置中,指标不会在更高的时间范围(例如 H4 或更大)上显示。 手动时间范围:当在第一个菜单中选
介绍 ON Trade Waves Patterns Harmonic Elliot Wolfe,这是一款高级指标,旨在使用手动和自动方法检测各种市场模式。以下是它的工作原理: 谐波模式: 该指标可以识别出现在您图表上的谐波模式。这些模式对于练习谐波交易理论的交易者非常重要,正如Scott Carney的书《谐波交易第1卷和第2卷》所描述的那样。无论您是手动绘制它们还是依赖自动检测,ON Trade Waves Patterns都可以胜任。 控制面板: 我们配备了一个用户友好的控制面板,它会保存您的图表和时间帧设置,使您可以轻松切换不同配置。您甚至可以最小化它以最大化图表空间。如果您更喜欢使用其他分析工具,只需单击关闭按钮即可隐藏所有指标数据。 模板保存: 当您自定义设置或添加其他指标,如移动平均线或布林带时,该指标会自动保存您的模板。这意味着您可以随时轻松加载您喜欢的设置。 优化显示: 对于Windows 10用户,我们建议调整您的DPI设置以获得高清设备上的最佳屏幕体验。右键单击MetaTrader图标,选择“兼容性”,然后选择“更改高DPI设置”,将其设置为“系统(增强)”。
Shepherd Harmonic Pattern
Abdullah Alrai
4.68 (59)
这个指标将检测手动和自动方法在图表上绘制的谐波模式。 您可以从此链接查看用户手册: 添加您的评论并联系我们以获得它 有一个免费版本可以在mt4上尝试此产品。 您可以使用它来检测Gartley和Nenstar模式: https://www.mql5.com/en/market/product/30181 您可以从以下链接购买完整的MT4版本: https://www.mql5.com/en/market/product/15212 注意 指标具有控制面板,并将保存每个(图表和时间框架)设置。 您可以将其最小化以在图表上获得更多空间,并且如果您更喜欢使用其他分析工具,则可以按关闭按钮隐藏所有指标数据 当您使用此指标并更改设置,添加诸如移动平均线或布林带之类的指标时,此指标将自动保存您的模板编辑,并且您可以随时加载它们。 如果您使用的是Windows 10,请右键单击MetaTrader图标>兼容性>更改高DPI设置>系统(增强)以获得最佳屏幕设置(应在高清设备中完成)。 指标只是谐波交易理论的解释,用于检测图表上的谐波模式。 如果您想学习它,可以搜索Scott Carney的书,名为“Ha
Indicator : RealValueIndicator Description : RealValueIndicator is a powerful tool designed specifically for trading on the EURUSD pair. This indicator analyzes all EUR and USD pairs, calculates their real currency strength values, and displays them as a single realistic value to give you a head start on price. This indicator will tell you moves before they happen if you use it right. RealValueIndicator allows you to get a quick and accurate overview of the EURUSD currency pair tops and bottoms,
All in One Trade
Alexey Minkov
4.48 (27)
The All-in-One Trade Indicator (AOTI) determines daily targets for EURUSD, EURJPY, GBPUSD, USDCHF, EURGBP, EURCAD, EURAUD, AUDJPY, GBPAUD, GBPCAD, GBPCHF, GBPJPY, AUDUSD, and USDJPY. All other modules work with any trading instruments. The indicator includes various features, such as Double Channel trend direction, Price channel, MA Bands, Fibo levels, Climax Bar detection, and others. The AOTI indicator is based on several trading strategies, and created to simplify market analysis. All-in-One
作者的更多信息
**Introducing Supply Demand Zones Indicator for MT4** Hello, esteemed traders in the financial markets! Today, we are pleased to introduce to you a powerful tool called the "Supply Demand Zones Indicator" - a valuable utility designed for the MetaTrader 4 (MT4) platform, aimed at helping you identify key supply and demand areas on your trading charts. **Brief Introduction:** The Supply Demand Zones Indicator is a unique technical analysis tool that assists in pinpointing significant price l
FREE
ZigZag Fibo Retracement
Dang Khoa Nguyen
5 (1)
ZigZag Fibo Retracement Indicator Optimize Your Trading Strategy! Are you seeking to optimize your trading strategy in the financial markets? Explore the unique features of the ZigZag Fibo Retracement Indicator, a powerful tool designed to help you identify potential support and resistance levels based on the combination of ZigZag patterns and Fibonacci ratios. Integration of ZigZag Patterns and Fibonacci: The ZigZag Fibo Retracement Indicator combines the effectiveness of ZigZag patterns, helpi
FREE
Pivotal Moments
Dang Khoa Nguyen
Dear everyone, Today, I would like to introduce you to an amazing tool on the MetaTrader 4 platform - "Pivotal Moments." This indicator will be a reliable companion on your trading journey in the financial market. "Pivotal Moments" is not just an ordinary indicator, but an intelligent tool that helps you better understand significant fluctuations on the chart. With a variety of customization options, it provides valuable information and deep insights into the market. The key features of "Pivotal
FREE
Enhanced Volume
Dang Khoa Nguyen
Sure, here's the introduction for the "Enhanced Volume" indicator designed for MetaTrader 4 (MT4): --- ## "Enhanced Volume" Indicator for MetaTrader 4 (MT4) Greetings MT4 Traders! The "Enhanced Volume" indicator is a powerful tool designed to help you track and analyze trading volume alongside signals of changing market trends.  ### Key Features: 1. **Separate Window Display:** The "Enhanced Volume" indicator can be displayed on a separate window, making it easy to observe and analyze
FREE
Bollinger Bands Stops
Dang Khoa Nguyen
5 (1)
Bollinger Bands Stops Indicator for MT4 The Bollinger Bands Stops Indicator is a versatile tool designed to help traders make informed decisions in the financial markets. Developed for the MetaTrader 4 (MT4) platform, this indicator provides valuable insights by visually representing the Bollinger Bands along with stops and signals. Key Features: Bollinger Bands Analysis: The indicator incorporates Bollinger Bands, a widely used technical analysis tool. These bands help traders identify potentia
FREE
"终极非重绘智能"指标 - 一套智能的非重绘交易系统。 产品概述: "终极非重绘智能"指标是专为MT4平台的交易者设计的强大工具,有助于优化市场分析和交易决策。通过多种指标和智能系统的组合,该指标不仅有助于识别潜在的买入和卖出点,还提供可靠的交易信号。 主要特点: 非重绘系统:该指标的一个关键优势是其非重绘功能,确保交易信号一旦出现在图表上就不会改变。这增强了信号的可靠性,使您能够做出准确的交易决策。 多样化的技术指标:"终极非重绘智能"指标结合了多种领先的技术指标,包括移动平均线、相对强弱指数(RSI)、布林带(Bollinger Bands)、买入力量指标(Bulls Power)、卖出力量指标(Bears Power)等。这些指标的智能融合提供了全面的市场视角,并增加了成功交易的机会。 支持和阻力MTF:该指标提供多时间框架的支持和阻力功能,帮助您在不同时间框架上识别重要的价格水平。这有助于确定重要的价格水平和更有效的入场点。 显示Pinbar:该指标还提供Pinbar显示功能,方便您轻松识别图表上的Pinbar蜡烛图形。这有助于识别潜在的趋势反转信
**"Support and Resistance Breakout" Indicator for MetaTrader 4 (MT4)** Hello traders and investors on the MetaTrader 4 (MT4) platform, We are excited to introduce to you the "Support and Resistance Breakout" indicator - a powerful tool designed for MT4 that helps you capitalize on trading opportunities involving support and resistance breakouts effectively and confidently. **Overview:** The "Support and Resistance Breakout" indicator is a custom tool built on the MetaTrader 4 platform,
你好, 您是否正在寻找在MetaTrader 4(MT4)平台上从金融市场获利的最佳解决方案?介绍一款“Sonic R Non Repaint Smart”智能交易系统,为交易者带来准确性和效率。 关于“Sonic R Non Repaint Smart”: “Sonic R Non Repaint Smart”是一个强大的交易指标,基于备受推崇的Sonic R交易策略构建。我们自豪地提供了一个解决方案,不仅可以帮助您准确地识别市场趋势,还可以自动化交易过程。 主要特点: 无重绘,高准确性:通过“Sonic R Non Repaint Smart”,您将收到从不改变的精确交易信号。这增强了您在做交易决策时的信心。 自动交易:该系统自动分析市场,并根据Sonic R策略提供买入和卖出信号。这节省了您在管理交易方面的时间和精力。 多时间框架集成: “Sonic R Non Repaint Smart”允许您在不同时间框架上监视市场,从小到大。这为您提供了总体视图,使您能够做出明智的决策。 智能风险管理:该系统集成了基于ATR指标的止损和止盈等风险管理工具。
MT4 EA产品 - AI PowerTrend Intelligence 尊敬的客户您好, 我们荣幸地向您介绍我们的MT4 EA(专家顾问)产品 - "AI PowerTrend Intelligence",这是一个强大的工具,专为MT4交易平台而设计。该EA的开发目标是在金融市场交易中提供智能和高性能。 突出特点: 智能指标:该产品使用多种技术指标,如指数移动平均线(EMA)、相对强弱指数(RSI)、布林带、牛市力量和熊市力量等,以作出智能交易决策。 自动交易:该产品允许您设置交易参数,如止损、止盈和资金比例,以使EA能够自动执行买入/卖出交易。 风险管理:EA提供固定手数或基于账户余额的风险比例等风险管理选项。 多时间框架指示(MTF):您可以激活此功能,使EA基于多个不同时间框架的趋势来做出交易决策。 智能追踪止损:EA使用追踪止损来保护您的利润,并确保您有最大的机会获得利润。 智能交易时间:您可以设置适合您日程安排的交易时间和交易日期。 声音和警报支持:EA可以在有交易信号时发出声音警报,确保您不会错过任何重要的交易机会。 使用方
AI Sonic R Trader
Dang Khoa Nguyen
AI Sonic R Trader - 智能自动交易产品,适用于MT4 亲爱的尊敬客户, 我们非常自豪地介绍AI Sonic R Trader,这是一款由KPRO团队开发的智能高效的专家顾问(EA),专为MT4平台设计。该产品的创建旨在为您在金融市场上提供一流的自动化交易能力。 Sonic R Trader策略与人工智能的先进技术相结合,为该产品的成功奠定了基础。 AI Sonic R Trader的主要特点: 智能自动交易:EA利用智能算法结合技术指标,包括指数移动平均线(EMA),如根据Sonic R策略设定的EMA34和EMA89,以识别图表上的最佳入场和出场点。 灵活的风险管理和ATR利用:我们为您提供根据平均真实范围(ATR)指标定制交易的风险管理能力。该产品允许您根据ATR值设置获利点和止损点,确保智能和有效的帐户保护。 专业追踪止损选项:追踪止损功能保护利润并优化开放交易。此选项遵循ATR设置。 不使用马丁格尔和网格:我们在交易过程中不使用马丁格尔和网格方法。 灵活的交易管理:您可以设置最大开放交易数量,连续交易之间的时间间隔,并根据您的
TradeMatic EA
Dang Khoa Nguyen
**Introduction to TradeMatic EA for MT4 - Adjust Trading Strategy and Risk Management** TradeMatic EA is a versatile indicator created with version 1.1 by KPRO for MetaTrader 4 (MT4). Designed to assist traders in automating their trading processes, this indicator provides multiple settings and options to fine-tune your trading strategy along with strict risk management. **Key Features:** 1. **Diverse Risk Management:** TradeMatic EA offers various risk management options, allowing you to
AI Breakout Box
Dang Khoa Nguyen
大家好,热爱金融市场和在MT4平台上交易的同行们, 我们自豪地介绍我们独特而强大的EA(专家顾问) - AI Breakout Box。这是为那些寻求可靠的自动交易工具以优化他们在MetaTrader 4平台上的交易结果,尤其是在突破策略中的完美解决方案。 关于AI Breakout Box AI Breakout Box是一个专门设计的专家顾问,用于检测和利用突破市场条件中的交易机会。简而言之,突破是指价格试图突破一个区间范围内的价格水平。这是一个关键时刻,可能标志着趋势潜在变化或重大市场动向。 突破策略的特点和优势 自动突破检测:AI Breakout Box根据技术指标(如RSI,EMA和ATR)自动识别突破信号。这确保您在图表上不会错过任何重要的突破机会。 优化的入场和出场点:该EA利用各种参数,如止盈、止损和追踪止损,帮助您从突破信号中最大化利润。 多时间框架分析:通过监控多个时间框架,您可以识别不同时间框架上的突破,并做出更明智的交易决策。 自动交易:AI Breakout Box自动执行所有交易决策。这节省了您的时间,使您可以专注于市场分析,而不是不断监控图表。 为什么选
**MT4的突破盒指标 - 发掘高效的交易机会** 亲爱的交易者们,您好, 我们非常高兴向您介绍突破盒指标版本2.0 - 这是由KPRO创建的强大而准确的交易工具。这是一个宝贵的资产,可帮助您捕捉外汇市场中的交易机会,优化您的利润并同时降低风险。 **主要特点:** 1. **高效的突破交易:** 突破盒指标专门设计用于识别图表上关键的突破点。这使您能够捕捉强劲的价格波动并抓住最佳的交易机会。 2. **不重绘信号:** 该指标的一个独特特点是其不重绘信号能力。这确保您可以依赖指标提供的买入和卖出信号,为您的交易决策创造可信的基础。 3. **多时间框架(MTF)和集成EMA:** 通过多时间框架的能力,您可以利用来自不同时间框架的信息做出更明智的交易决策。该指标还集成了EMA线,帮助您高效地识别市场趋势。 4. **灵活的设置:** 突破盒指标提供了可定制的参数,以匹配您的交易风格和策略。您可以调整突破时间周期、偏移、颜色等等因素。 5. **警报和通知:** 该指标通过MT4平台支持警报和通知功能,确保您不会错过任何重要的交易机会。 **使用方
**解锁自动化交易的力量,利用您钟爱的技术指标 - 引介 IndicatorTrader Pro 适用于 MT4** 问候, 您是否曾经发现自己不断盯着图表,根据您辛苦设置的技术指标寻找交易信号?您是否正在寻找减少压力和节省时间的交易决策方式?请不要再寻找,因为 IndicatorTrader Pro 就是您的最佳交易伙伴 - 我们自豪地背后支持的名字 - 适用于每位交易者的完美选择。 ### 通过现有技术指标轻松自动化 为什么要麻烦执行每次技术指标产生信号时的买卖订单呢?IndicatorTrader Pro 是解决这一困境的终极解决方案。它专为根据您选择的技术指标自动检测和执行买卖订单而设计。 ### 发挥技术指标的威力 通过 IndicatorTrader Pro,您可以充分发挥技术指标(如 RSI、MA 和 ADX)的威力。该 EA 密切监控市场波动性,并在这些指标产生信号时自动执行买卖订单。您不再需要整天盯着屏幕 - 取而代之的是,您可以轻松地抓住潜在的交易机会。 ### 定制以适应您的需求 如果您想表达您独特的交易观点,IndicatorT
Introducing the "Zone of Supply and Demand Pro" Indicator - Redefining Precision with Multi-Time Frame (MTF) Technology and Non-Repaint Capability In the intricate world of financial markets, understanding supply and demand can be the key to success. We are excited to present the "Zone of Supply and Demand Pro" - a powerful analytical tool designed not only to help you seize trading opportunities but also to ensure unparalleled accuracy through groundbreaking technology. **The Significance
Order Block Pro
Dang Khoa Nguyen
**全新推出:Order Block Pro - 您的MT4交易利器!** 是否想要一款能够在金融市场中最大化您潜力的全新交易工具?现在,我们自豪地为您介绍 Order Block Pro - 一款功能强大的工具,不仅提供广泛的功能,还能够克服传统指标的局限性。 **Order Block Pro的主要特点** **1. 精确捕捉买卖信号:** 在与图表交互时,Order Block Pro 不仅会显示买卖箭头,还能保证这些箭头不会出现“重绘”。这意味着您将获得独特的买卖信号,消除了任何不确定性。 **2. 及时准确的提醒:** Order Block Pro 不仅可以帮助您确定重要的订单区域,还会在价格接近这些区域时提醒您。这使您能够迅速准确地抓住交易机会。 **3. 灵活易调整:** Order Block Pro 可根据您的偏好进行自定义设置。您可以调整订单区域、关键价格水平以及相应的支撑/阻力线显示。这使您可以根据个人的交易风格进行调整。 **4. 增强价格结构理解:** Order Block Pro 不仅仅是一个交易工具,更是一个有价值的助手,能够
TrendLine ProX
Dang Khoa Nguyen
**TrendLine ProX - MT4平台上的非重绘交易指标** **产品介绍:** 我们自豪地推出 TrendLine ProX - 在MT4平台上交易的优化且可靠的工具。凭借其准确的趋势识别和非重绘功能,TrendLine ProX 将成为您在交易时智能决策支持的可靠伙伴。 **TrendLine ProX的优势:** TrendLine ProX 不仅仅是一个交易工具,它将技术和市场分析完美结合。以下是一些显著特点: **1. 防止重绘功能:** 我们的团队致力于确保 TrendLine ProX 提供的交易信号始终保持准确,不会在出现后进行更改。这确保您始终拥有可靠的交易决策信息。 **2. 多样的交易策略:** TrendLine ProX 可识别短期和长期趋势,使您在制定交易策略时更加灵活。您可以从短期波动和长期趋势的机会中受益,以实现最佳绩效。 **3. 智能趋势线集成:** 除了提供买入/卖出信号外,TrendLine ProX 还集成了智能趋势线。这帮助您紧密监控趋势的发展和图表上的关键点。 **4. 高准确度:** 利用先进算法,Tr
Introducing Market Structure AIO: The Smart Money Concepts Mastermind Tired of chasing false signals and battling market confusion?   Introducing Market Structure AIO, the all-in-one indicator powered by Smart Money Concepts, designed to   unravel market structure, identify high-probability trade opportunities, and empower you to trade with confidence. What is Market Structure AIO? A comprehensive Smart Money Concepts toolkit:   Analyze market structure, identify imbalances, and anticipate price
筛选:
无评论
回复评论
版本 2.0 2023.08.09
Update Non Repaint