Range Breakout Catcher
- 指标
- Issam Kassas
- 版本: 1.0
- 激活: 20
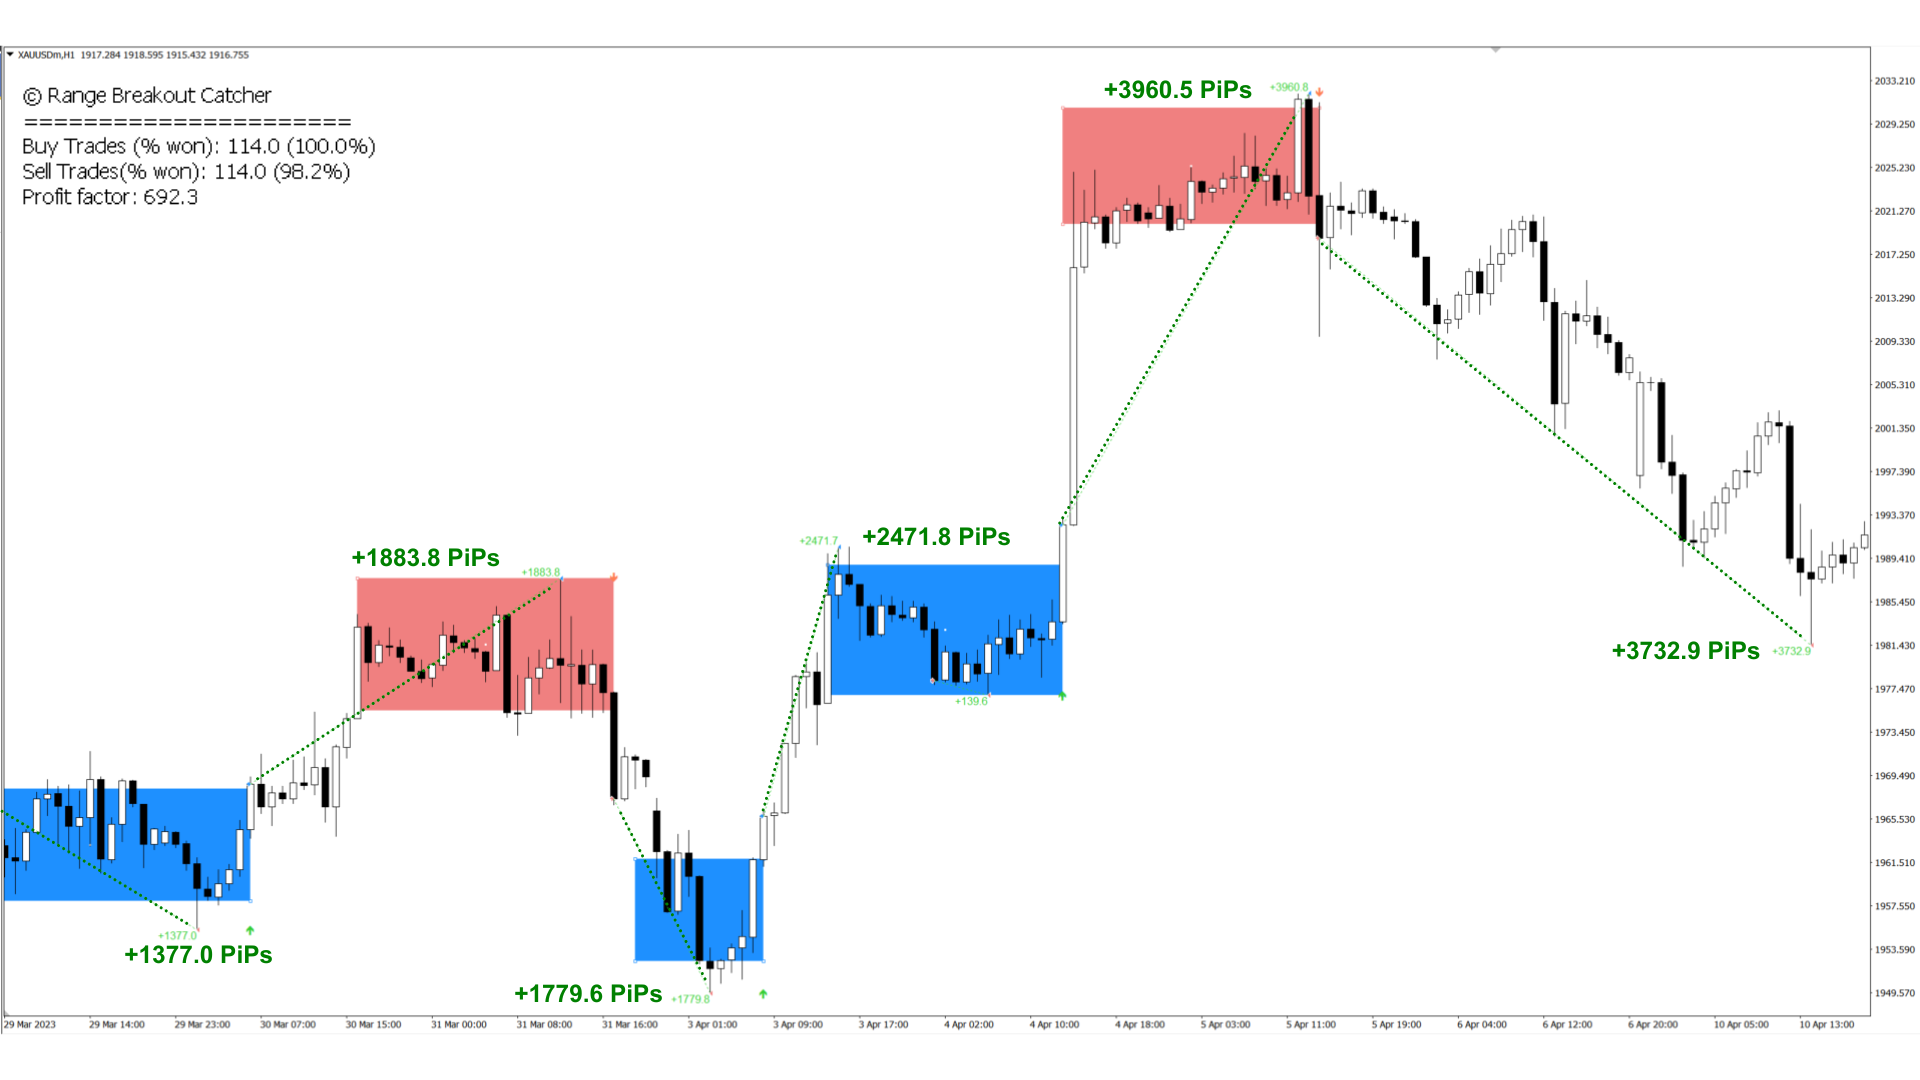
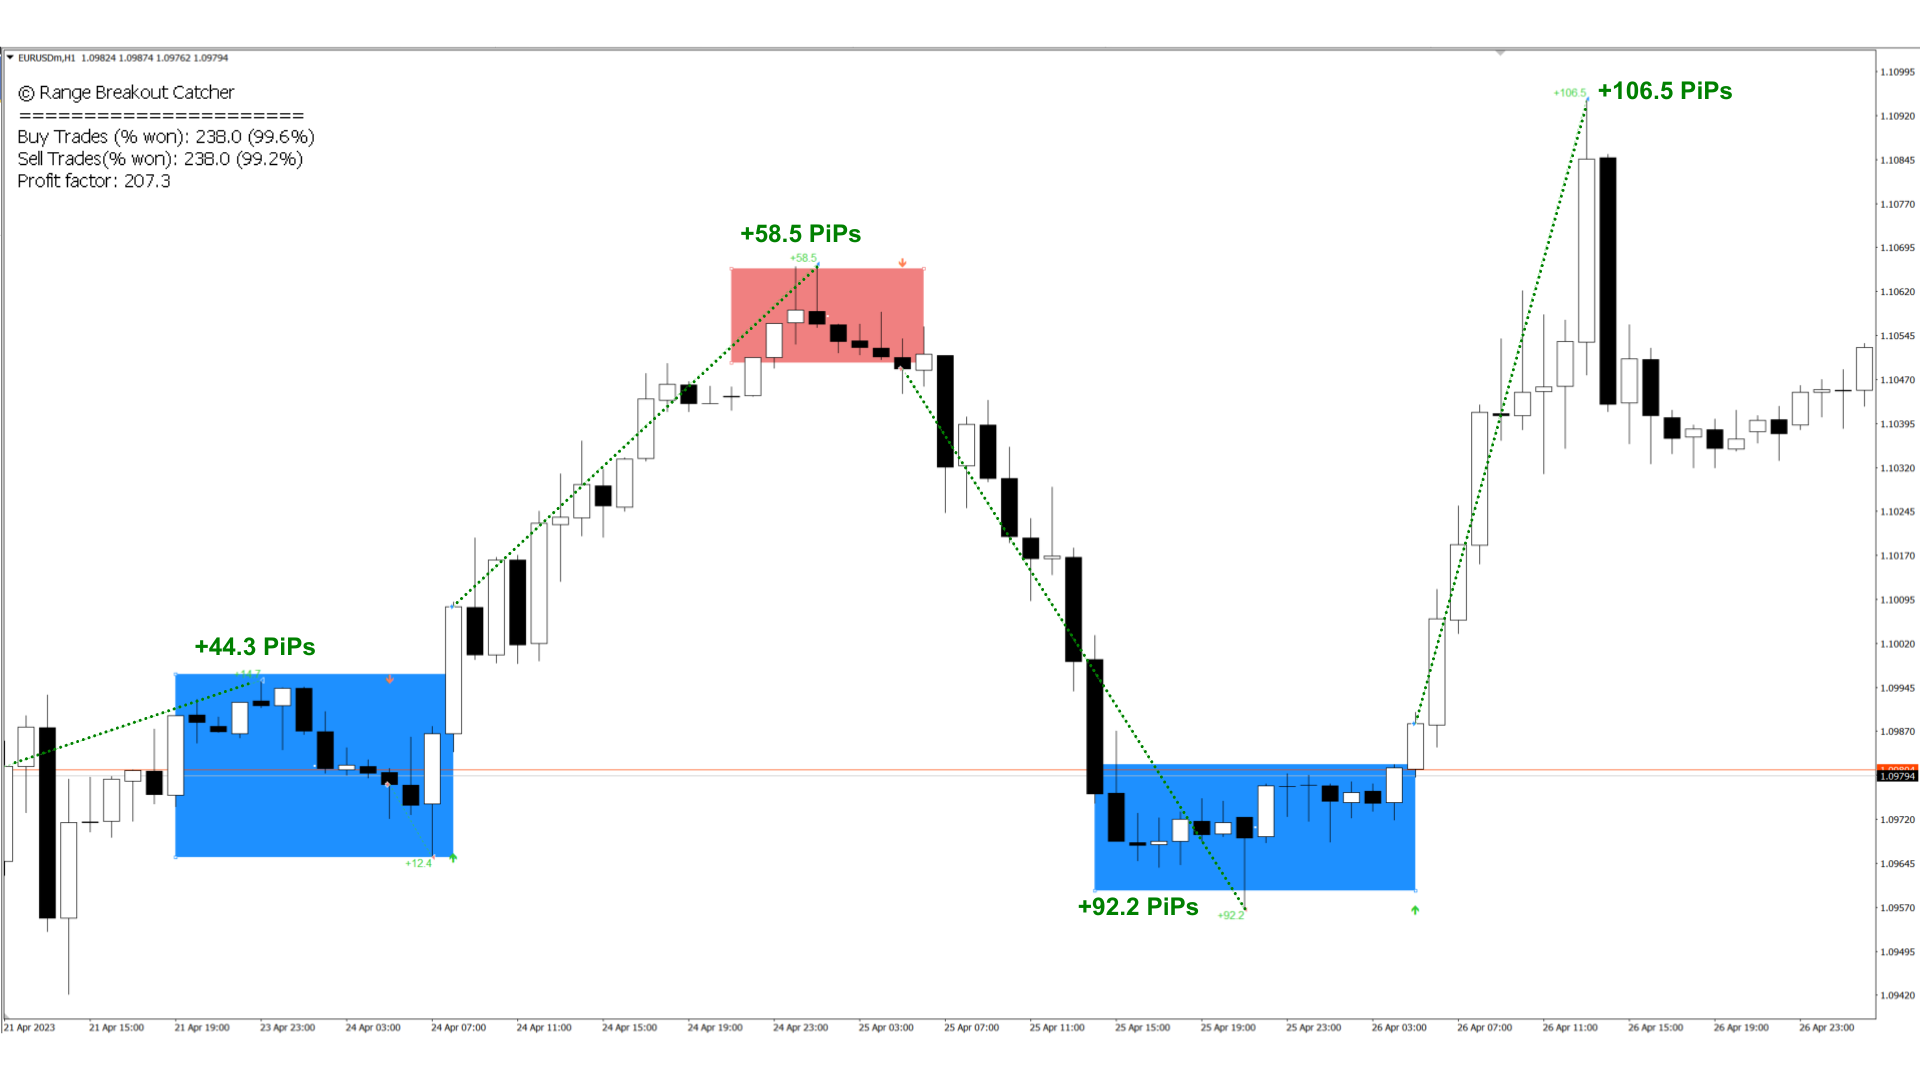
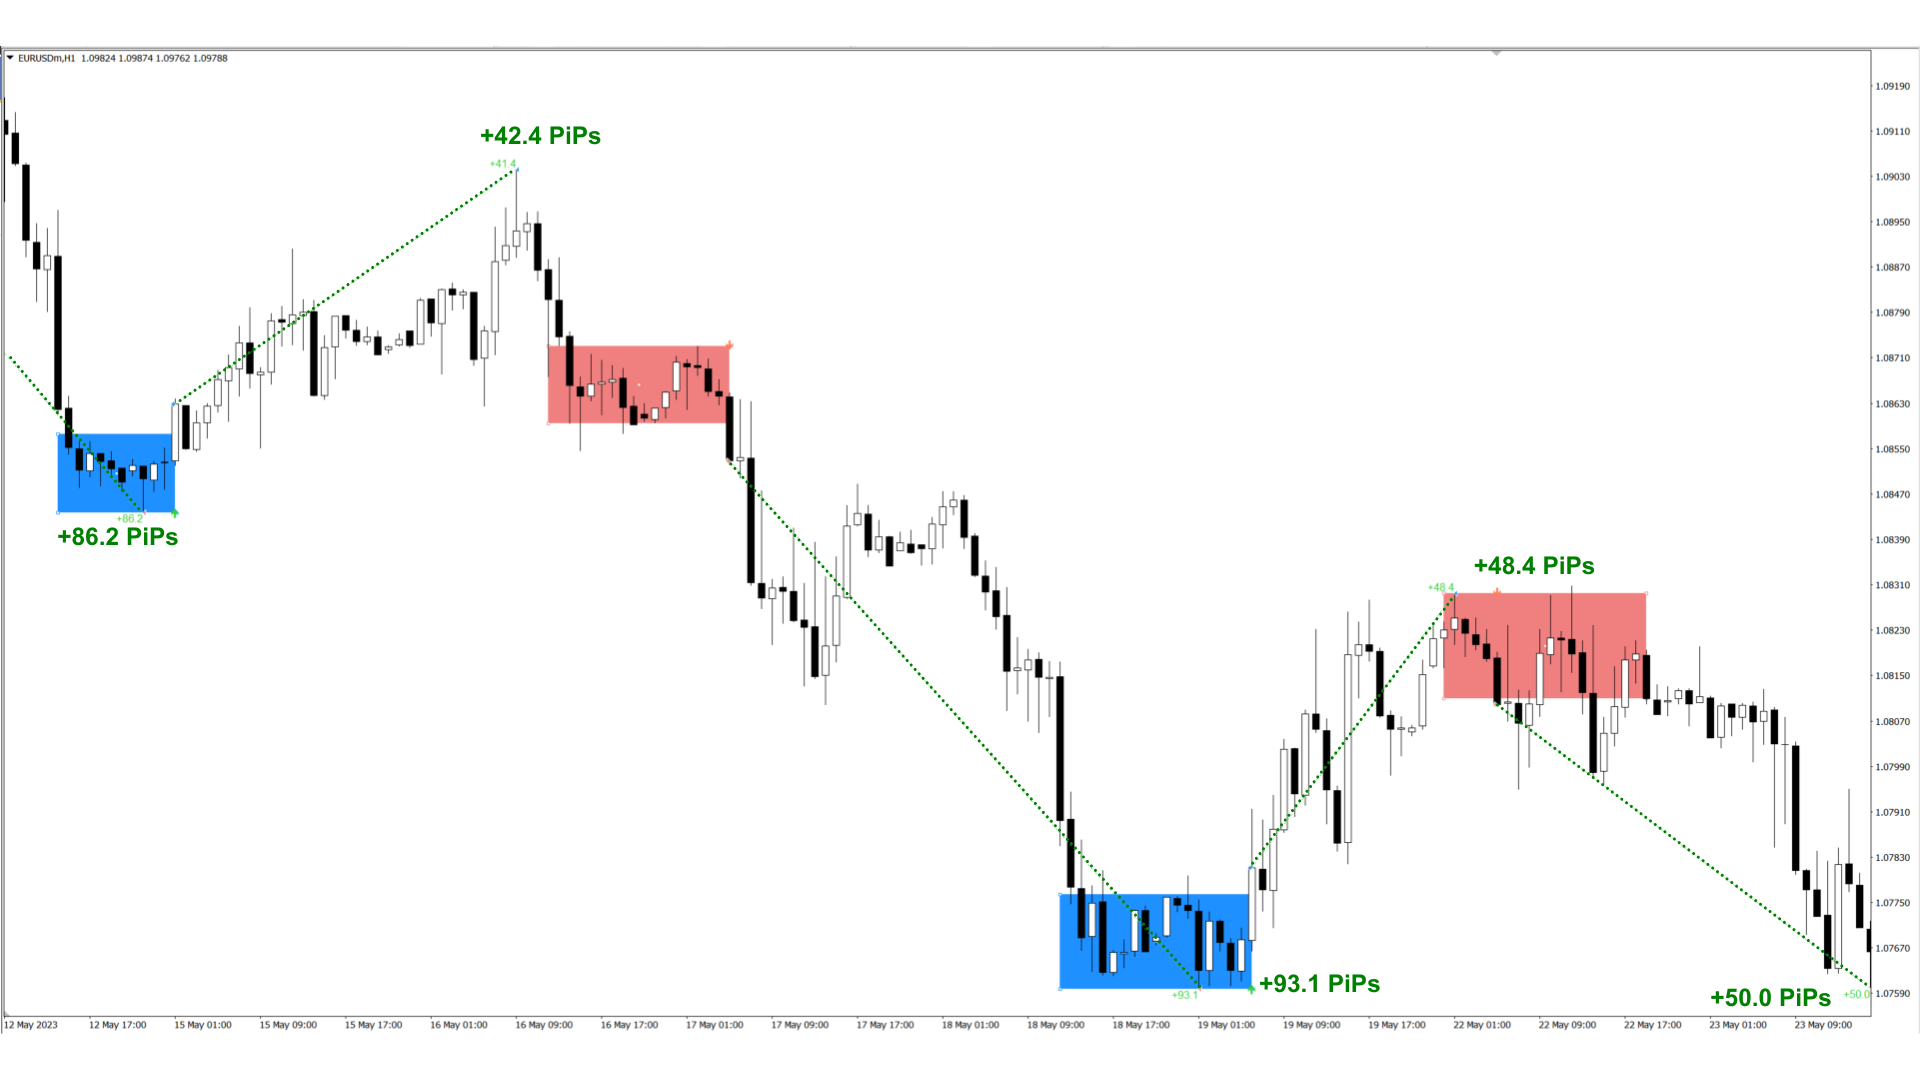
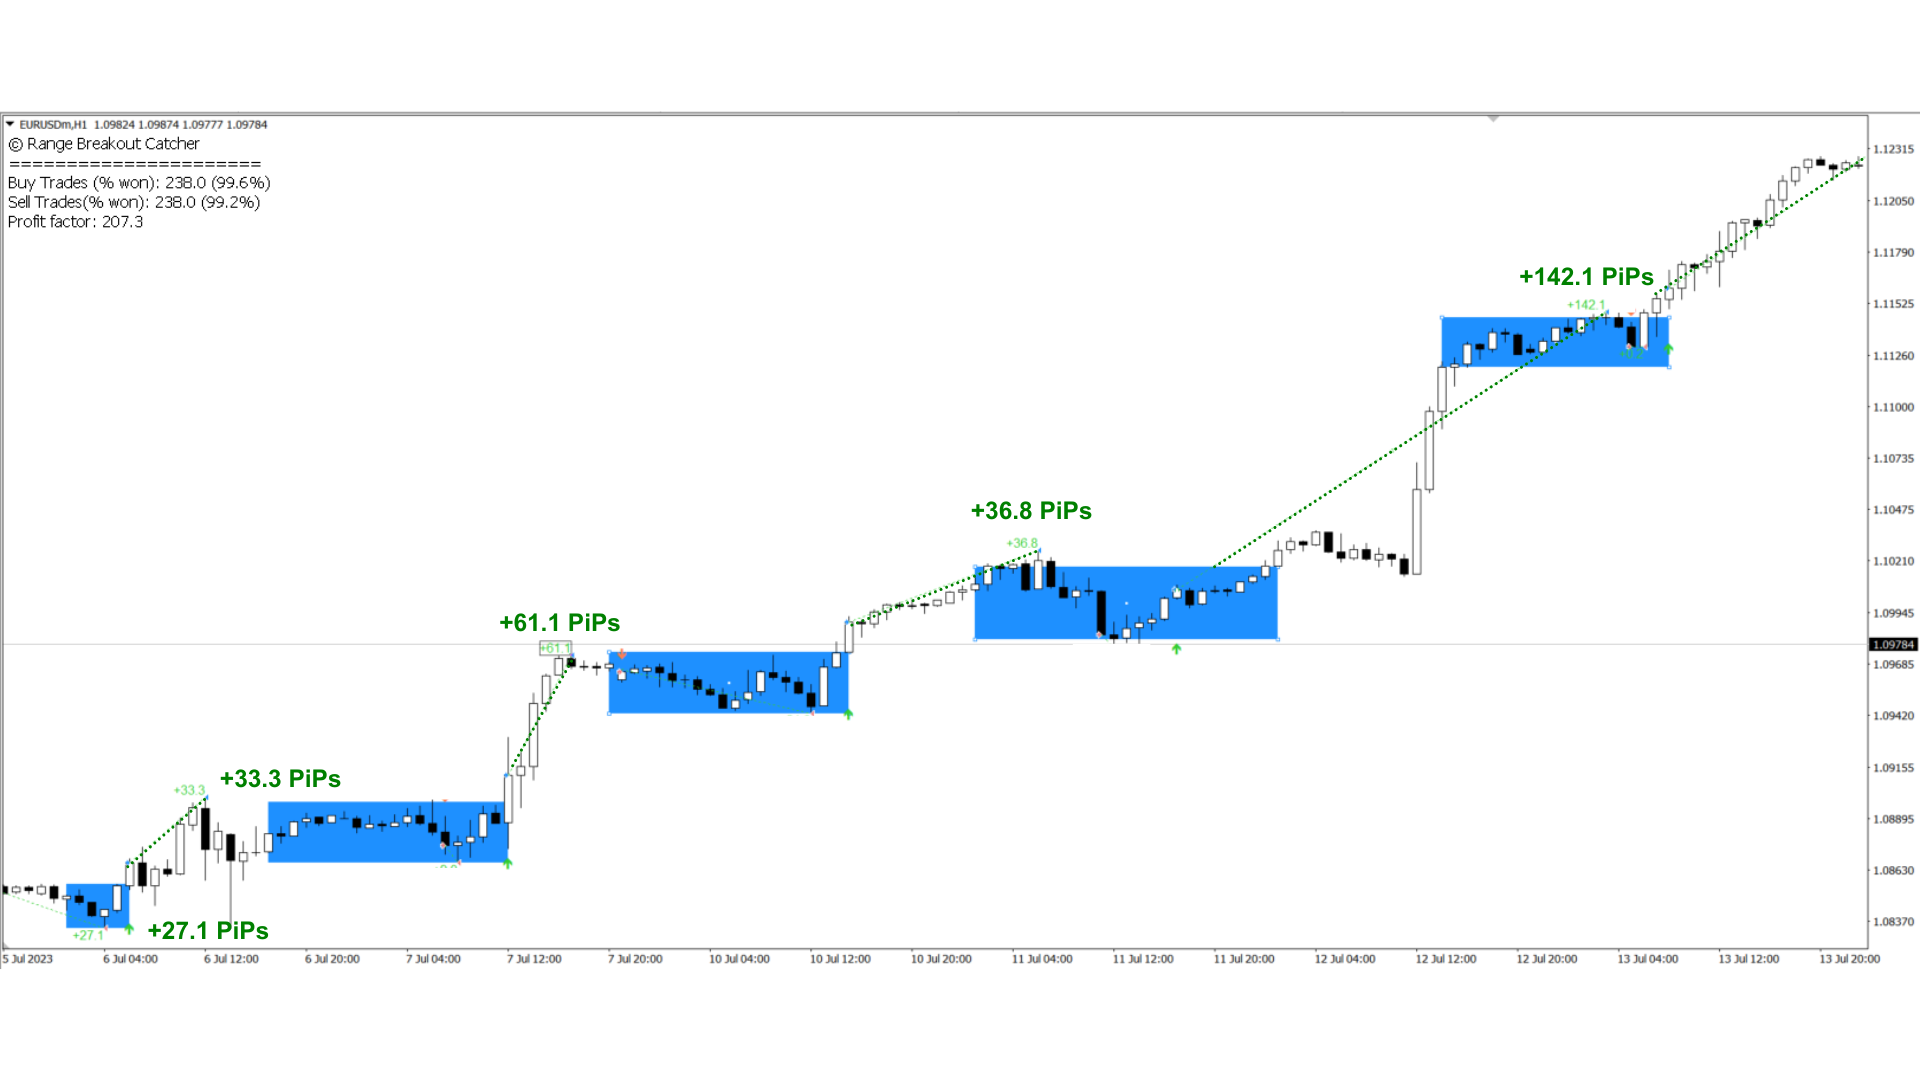
Description:
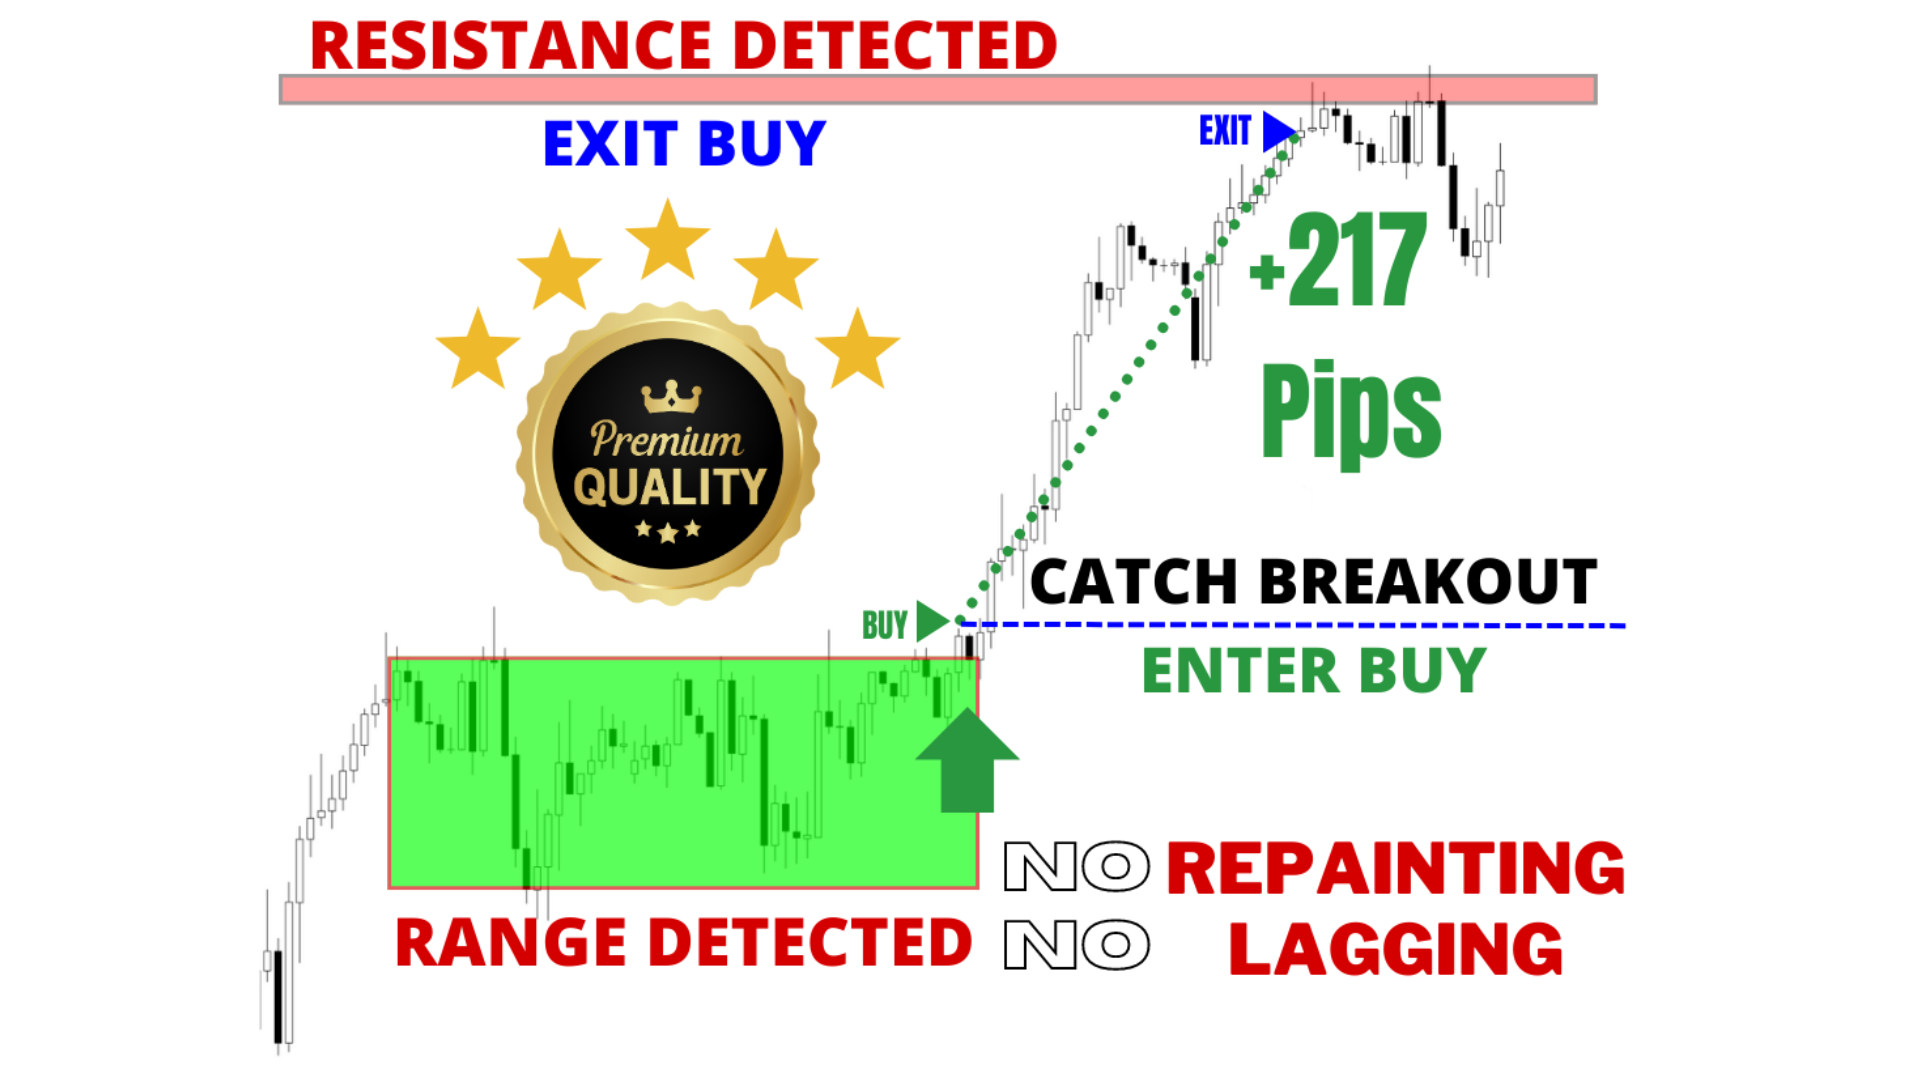
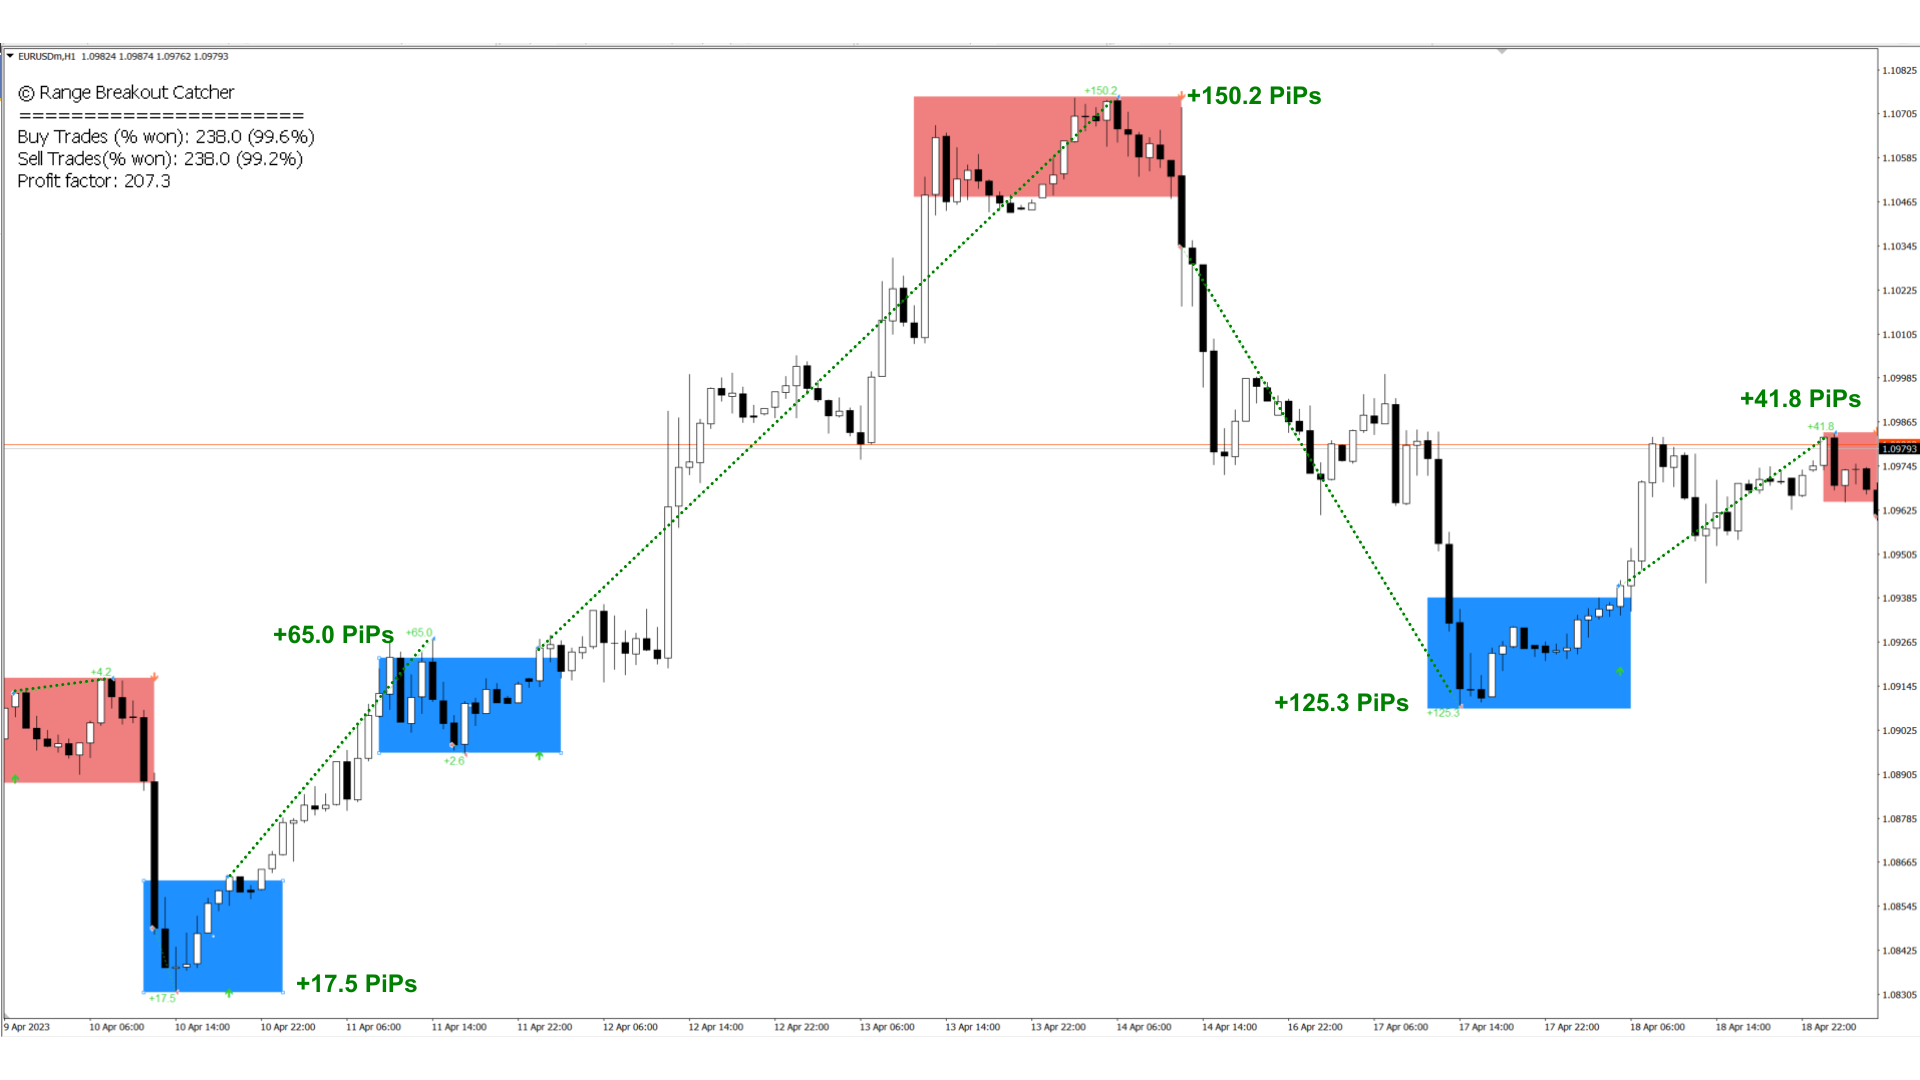
The Range Breakout Catcher Indicator is a powerful tool known for its non-repainting, non-redrawing, and non-lagging capabilities, making it suitable for both manual and robot trading. This indicator utilizes a smart algorithm to calculate ranges and generate early signals for Buy and Sell positions at the breakout of these ranges, facilitating the capture of trends during ranging consolidations. The range calculation involves a comprehensive system based on various elements, providing a redundant structure that detects ranges, breakout points, and predicts subsequent trends. On the chart, users will observe key elements, including the Range box drawn by the algorithm, Buy and Sell signals represented by upward and downward arrows, respectively, trading statistics displaying historical performance, and live trade updates showcasing real-time pip movements. The algorithm excels at identifying two types of ranges:
- Continuation Ranges within the trend, predicted for continuation.
- Reversal Ranges at the trend's end, forecasting reversal moves.
Features:
- Works on all assets and all timeframes.
- Early Entry Detection.
- Simple Trading Strategy.
- Alerts to phone and email when new trades are detected.
- Trading statistics.
- Visual live pip gain count.
- Entry and Exit Points.
Related Topics:
Range Market, Range Indicator, Ranging Market, Range Breakout, Reversal Range, Consolidation Market, Pullback Breakout, Market Range Identifier, Ranging Indicator Tool, Range Breakout Detector, Reversal Range Predictor, Consolidation Market Analyzer, Pullback Breakout Indicator, Range Breakout Predictor, Market Range Scanner, Ranging Market Analyzer, Reversal Range Identifier, Consolidation Breakout Tool, Pullback Range Detector, Reversal Range, Reversal Strategy, Reversal Pattern, Strategy for Reversal, Reversal Pattern Finder