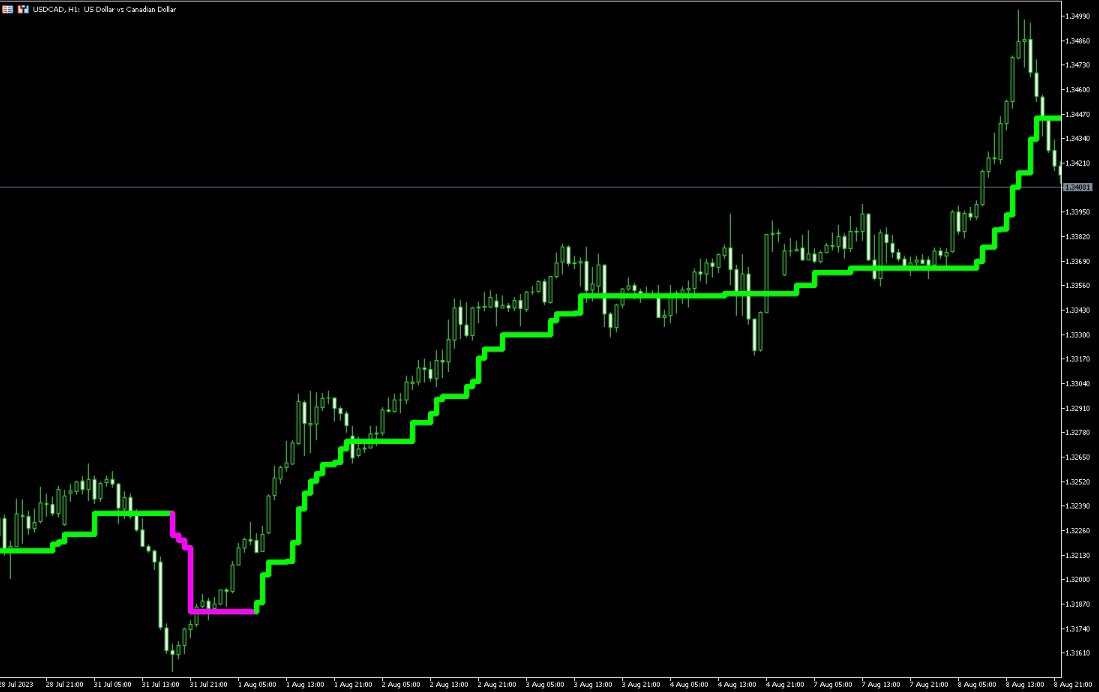
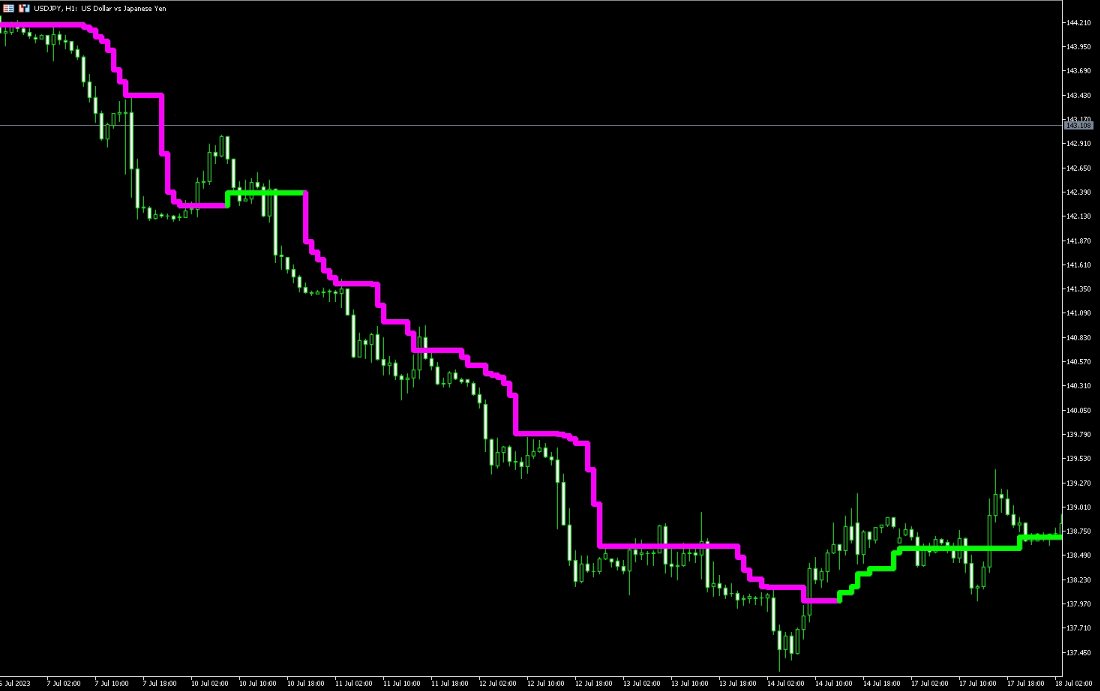
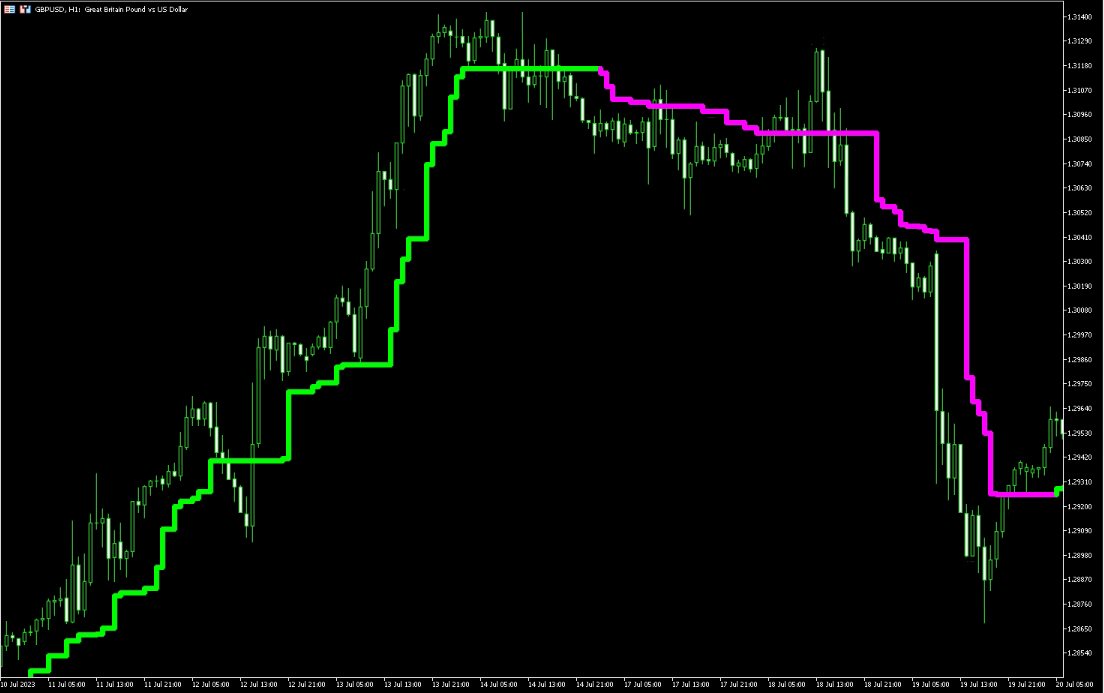
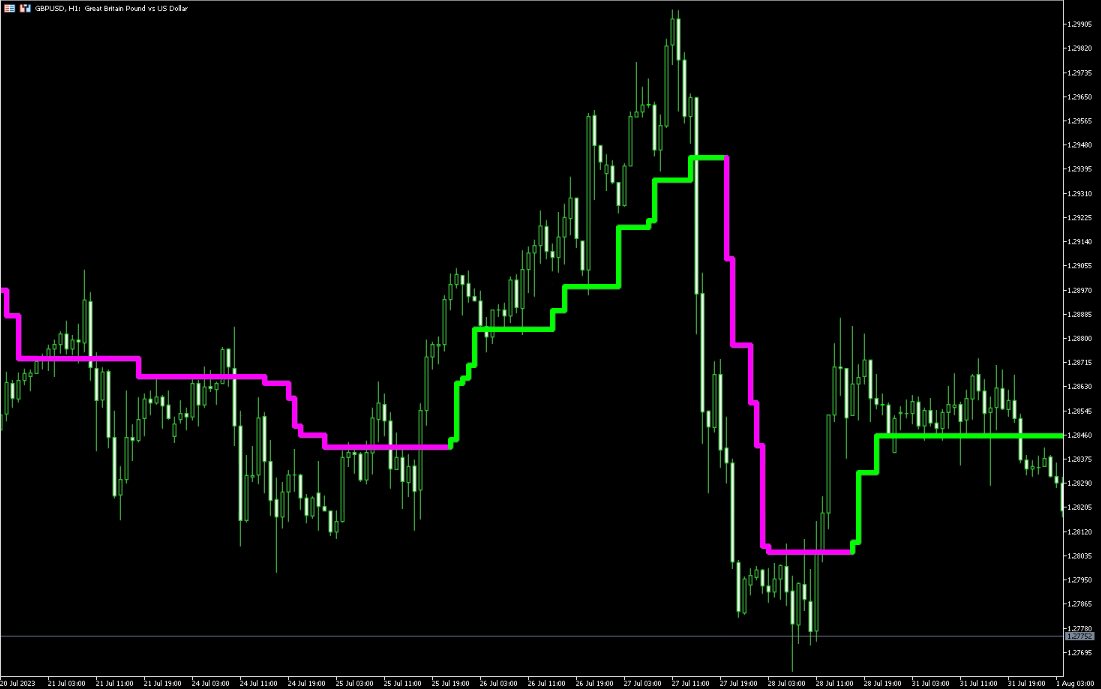
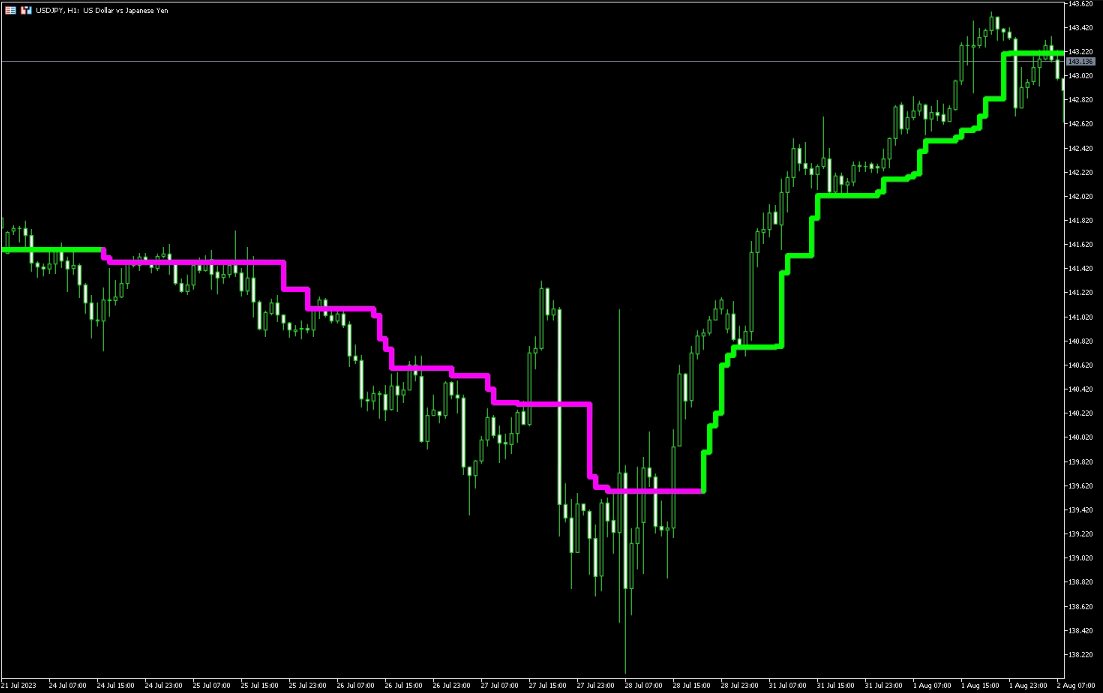
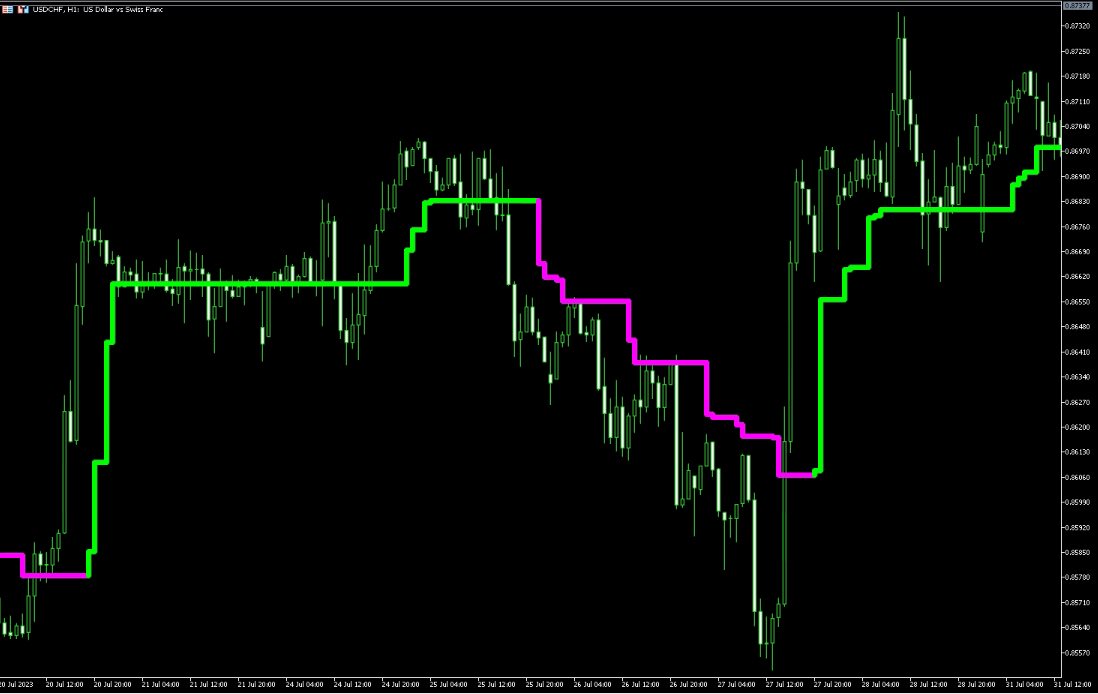
KT Fractal Channel Breakout draws a continuous channel by connecting the successive Up and Down fractals. It provides alerts and also plots the Up and Down arrows representing the bullish and bearish breakout of the fractal channel.
Features
If you use Bill Williams fractals in your technical analysis, you must also include it in your trading arsenal. It can be very effective and useful for stop-loss trailing. A new market trend often emerges after a fractal channel breakout in a new directi
!! FLASH SALE !! Over 80% off !! For ONE week only. Now only $47 - normally $297! >>> Ends on 30 June 2023 - Don't miss it!
Buy and Sell Alerts when price breaks out following strict price action. Sends Alerts – #On MT5 To Your Phone To Your Email
Does not repaint .
Works on any Forex pair, any timeframe.
10 Activations allowed so you are free from limitations >> MT4 Version Here For spreads from a tiny 0.1pip RAW/ECN Accounts, click here . Check out my Waka Esque EA sign
To download MT4 version please click here . - This is the exact conversion from TradingView: "Linear Regression Candles" By "ugurvu". - The overall look of the indicator is like Heiken Ashi. - It can be used as a trend confirmation indicator to detect the right trend direction. - This indicator lets you read the buffers for Candles' OHLC. - This is a non-repaint and light processing load indicator - You can message in private chat for further changes you need. Thanks
ATR Professional. is an indicator similar to the bollinger, but this back is more advanced to scalp and long in h4 or h1, It has its bands, the strategy is that it marks entry when the candle leaves the band, or does it bounce on the upper roof or lower floor, works for all seasons! works for forex markets and synthetic indices also crypto! Good profit! World Investor.
【Super Scanner】Indicator Introduction : The color of the Super Scanner which is green and climbing up means that the price trend is going up.The color of the Super Scanner is red and going down means that the price trend is going down.
It is very simple to use it to judge the market trend! What's even better is that the open parameters of the indicators allow investors to adjust. You can adjust【Super Scanner】according to your needs. Adjust it faster to be closer to short-term market fluctuati
Indicator of trend deviation with a static level. The deviation coefficient is set for the trend histogram. Signals are the intersection of the level trend histogram in the direction of the trend or during a trend reversal - the option is selected in the indicator settings by the "Revers" parameter. There are all the necessary settings for the design of the indication and sending messages to mail or a mobile terminal. All input parameters have an intuitive name. Analog for MT4: https://www.mql5.
The main application of the Faradenza indicator is to generate buy and sell signals. The indicator tracks the market trend with unrivaled reliability, ignoring sharp market fluctuations and noise around the average price. Determining the market trend is an important task for traders. The Faradenza indicator implements an advanced algorithm for visualizing the market trend. It catches the trend and shows favorable moments of entering the market with arrows. The main purpose of the indicator is to
Простой индикатор тренда в NRTR виде с отрисовкой линий стоплосса и тейпрофита, цвет и направление движения которых определяются действующим трендом. Индикатор имеет возможность подавать алерты, отправлять почтовые сообщения и push-сигналы при смене направления тренда. Следует учесть что значение входного параметра индикатора Deviation of the take profit line in points для каждого финансового актива на каждом таймфрейме необходимо подбирать индивидуально!
This indicator can be considered as a trading system. It offers a different view to see the currency pair: full timeless indicator, can be used for manual trading or for automatized trading with some expert advisor. When the price reaches a threshold a new block is created according to the set mode. The indicator beside the Renko bars, shows also 3 moving averages.
Features renko mode median renko custom median renko 3 moving averages wicks datetime indicator for each block custom notificatio
The Trend Detect indicator combines the features of both trend indicators and oscillators.
This indicator is a convenient tool for detecting short-term market cycles and identifying overbought and oversold levels. A long position can be opened when the indicator starts leaving the oversold area and breaks the zero level from below. A short position can be opened when the indicator starts leaving the overbought area and breaks the zero level from above. An opposite signal of the indicator can
The Urgently indicator is designed to quickly determine the situation in the market, reflect the state of the market and signal profitable levels for opening trades. Market conditions change quickly enough, requiring constant calibration of trading strategies. Recommended for use in conjunction with any of the oscillators. The Urgently forex market trend indicator shows the trend direction and entry points. It smooths out price fluctuations when generating a signal by averaging the data and the
The indicator determines the state of the market: trend or flat.
The state of the market is determined by taking into account volatility.
The flat (trading corridor)is displayed in yellow.
The green color shows the upward trend.
The red color shows the downward trend.
The height of the label corresponds to the volatility in the market.
The indicator does not redraw .
Settings History_Size - the amount of history for calculation.
Period_Candles - the number of candles to calculate the
LevelPAttern MT5 is a technical indicator based on the daily levels and Price Action patterns. The indicator is based on the standard ZigZag indicator + reversal candlestick pattens, such as Star, Hammer (also knows as Pin bar), Engulfing and others. The indicator generates audio and text notifications when a pattern is formed and a level is touched. It also supports sending email and push notifications.
Indicator operation features It is suitable for working with any CFD and FOREX trading ins
DYNAMIC SR TREND CHANNEL
Dynamic SR Trend Channel is a simple indicator for trend detection as well as resistance/support levels on the current timeframe. It shows you areas where to expect possible change in trend direction and trend continuation. It works with any trading system (both price action and other trading system that use indicators) and is also very good for renko charting system as well. In an uptrend, the red line (main line) serves as the support and the blue line serves as the
This product is converted form Trading View of Kivanc Ozbilgic to be used on MT5 and below are descriptions of developer on Trading View:
Anıl Özekşi's latest development on his precious OTT - Optimized Trend Tracker:
In this version, there are two lines of OTT which are derived from HIGHEST price values (HOTT) and LOVEST price values (LOTT) which were originally sourced to CLOSE values on default OTT.
Another significant difference is there is no Support Line (Moving Average) in this ver
The Rocket Trend indicator is trending. The indicator draws two-color points connected by lines along the chart. This is a trend indicator, it is an algorithmic indicator. It is easy to work and understand when a blue circle appears, you need to buy, when a red one appears, sell. The indicator is used for scalping and pipsing, and has proven itself well. Rocket Trend is available for analyzing the direction of the trend for a specific period of time. Ideal for novice traders learning the laws o
This indicator scans the 1-3 Trendline pattern . The indicator is a 100 % non repaint low risk breakout system . The patterns are formed around swing high and swing lows which make them a low risk pattern with high reward.
PATTERN BACKGROUND The 1-3 Trendline Breakout pattern is formed by four(4) points which are composed of three (3) primary points and the pattern neck. A trendline is always formed by the point 1 and the neck of the pattern . When price breaks out of the trendline formed ,
This is Gekko's Cutomized Cutomized Average Directional Index (ADX), a customized version of the famous ADX indicator. Use the regular ADX and take advantage two entry signals calculations and different ways of being alerted whenever there is potential entry or exit point.
Inputs Period: Period for the ADX calculation; PlotSignalType: How will the indicator calculate entry (swing) signals: 1- ShowSwingsOnTrendLevel : Show Signals for Trend Confirmation Swings; 2- ShowSwingsOnTrendLevelDirectio
Black Card Pack indicator 5/1 point black It has the strategy of professional bollingers where each arrow gives you a different entry signal. It is used to operate in m1 and in d1 It is used for scalping and intraday, modified for forex markets ! suitable for all pairs modified for synthetic index markets suitable for all pairs! Ideal for volatility and jumps!
The Essential Trader indicator is more comfortable with whipsaw/ranging market conditions. It is not a complicated trading indicator and can be used on any timeframe with high level of confidence. Besides, it has notifications and alerts. The dotted essential points show spots where you can make immediate entries and benefit from breakout on either side of the region. On the other hand, the color filled points display reversal regions. These are important in that you can trade along the trend
The indicator detects divergence signals - the divergences between the price peaks and the MACD oscillator values. The signals are displayed as arrows in the additional window and are maintained by the messages in a pop-up window, e-mails and push-notifications. The conditions which formed the signal are displayed by lines on the chart and in the indicator window.
The indicator parameters MacdFast - fast MACD line period MacdSlow - slow MACD line period MacdSignal - MACD signal line period Mac
The Levels indicator has been created to simplify the process of plotting support and resistance levels and zones on selected timeframes. The indicator plots the nearest levels of the selected timeframes, which are highlighted in different colors. It significantly reduces the time needed to plot them on the chart and simplifies the market analysis process. Horizontal support and resistance levels are used to identify price zones where the market movement can slow down or a price reversal is like
In MetaTrader, plotting multiple horizontal lines and then tracking their respective price levels can be a hassle. This indicator automatically plots multiple horizontal lines at equal intervals for setting price alerts, plotting support and resistance levels, and other manual purposes. This indicator is suitable for Forex traders who are new and looking for chances to make quick profits from buying and selling. Horizontal lines can help traders find possible areas to start trading when the
This script automatically calculates and updates ICT's daily IPDA look back time intervals and their respective discount / equilibrium / premium, so you don't have to :) IPDA stands for Interbank Price Delivery Algorithm. Said algorithm appears to be referencing the past 20, 40, and 60 days intervals as points of reference to define ranges and related PD arrays. Intraday traders can find most value in the 20 Day Look Back box, by observing imbalances and points of interest. Longer term traders c
Fibonacci retracement levels—stemming from the Fibonacci sequence—are horizontal lines that indicate where support and resistance are likely to occur. Each level is associated with a percentage. The percentage is how much of a prior move the price has retraced. The Fibonacci retracement levels are 23.6%, 38.2%, 61.8%, and 78.6%. While not officially a Fibonacci ratio, 50% is also used. The indicator is useful because it can be drawn between any two significant price points, such as
Supertrend indicator uses a combination of a moving average and average true range to detect the trend of a trading instrument.
Supertrend indicator for MetaTrader 5 easily shows the trend as a line following the price.
Triple SuperTrend Histo indicator calculate three supertrends to show the trend as a histogram. Changing the color from red to green means you can BUY , from green to red means you can SELL .
Description of the method of drawing a histogram. The price is above the EMA 20
通过 mql5 和 Telegram 上 的晨间简报获取每日市场更新,包括详细信息和屏幕截图 ! FX Power MT5 NG 是我们长期以来非常受欢迎的货币强度计算器 FX Power 的下一代产品。 这款下一代强度计算器能提供什么?您所喜爱的原版 FX Power 的所有功能 附加功能 黄金/XAU 强度分析 更精确的计算结果 可单独配置的分析周期 可自定义计算限制,以获得更好的性能 为希望查看更多信息的用户提供特殊的多实例设置 无尽的图形设置,可在每个图表中设置您最喜欢的颜色 无数的通知选项,让您再也不会错过任何重要信息 采用 Windows 11 和 macOS 风格的全新圆角设计 神奇的移动指标面板
FX Power 主要功能 所有主要货币的完整强势历史 所有时间框架内的货币强弱历史 所有经纪商和图表的计算结果完全相同 100% 可靠的实时计算 -> 无重绘 可通过下拉列表选择分析时段
通过自定义模式单独配置分析时段 可在一个图表中使用多个实例 可移动 FX Power 显示屏(通过拖放) 适用于高分辨率 QHD、UHD 和 4K 显示器 自动终端配置 针对平板电脑
Reversal First Impulse levels (RFI) INSTRUCTIONS RUS - ENG R ecommended to use with an indicator - TREND PRO - Version MT4 A key element in trading is zones or levels from which decisions to buy or sell a trading instrument are made. Despite attempts by major players to conceal their presence in the market, they inevitably leave traces. Our task was to learn how to identify these traces and interpret them correctly.
Main functions:: Di
Bill Williams Advanced is designed for automatic chart analysis using Bill Williams' "Profitunity" system. The indicator analyzes four timeframes at once.
Manual (Be sure to read before purchasing)
Advantages
1. Automatically analyzes the chart using the "Profitunity" system of Bill Williams. The found signals are placed in a table in the corner of the screen.
2. Equipped with a trend filter based on the Alligator indicator. Most of the system signals are recommended to be used only accordi
note: this indicator is for METATRADER4, if you want the version for METATRADER5 this is the link: https://www.mql5.com/it/market/product/108106 TRENDMAESTRO ver 2.4 TRENDMAESTRO recognizes a new TREND in the bud, he never makes mistakes. The certainty of identifying a new TREND is priceless. DESCRIPTION TRENDMAESTRO identifies a new TREND in the bud, this indicator examines the volatility, volumes and momentum to identify the moment in which there is an explosion of one or more of these data a
Step into the realm of Forex trading with confidence and precision using XQ, a cutting-edge Forex indicator designed to elevate your trading game to unprecedented heights. Whether you're a seasoned trader or just stepping into the world of currency exchange, XQ Forex Indicator empowers you with the insights and signals needed to make informed trading decisions. The signal conditions are a combination of three indicators, and XQ Forex Indicator only display medium and long-term trends . The ind
"Piranha" - an autonomous trading system that determines overbought and oversold levels on the chart. Red and blue zones represent overbought and oversold levels respectively. Entry points are marked with arrows: a downward arrow in the red zone for "sell" and an upward arrow in the blue zone for "buy". The Take profit level is indicated by the green moving average. Key features: Adjusting the Take profit level as the green moving average changes position. Averaging ability when a new market e
Quantum Heiken Ashi PRO 简介 Heiken Ashi 蜡烛旨在提供对市场趋势的清晰洞察,以其过滤噪音和消除虚假信号的能力而闻名。告别令人困惑的价格波动,迎接更流畅、更可靠的图表表示。 Quantum Heiken Ashi PRO 的真正独特之处在于其创新公式,它将传统烛台数据转换为易于阅读的彩色条。红色和绿色条分别优雅地突出了看跌和看涨趋势,让您能够以非凡的精度发现潜在的进入和退出点。
量子 EA 通道: 点击这里
MT4版本: 点击这里
这一卓越的指标具有以下几个关键优势: 增强清晰度:通过平滑价格波动,Heiken Ashi 金条可以更清晰地反映市场趋势,使您更容易识别有利的交易机会。 减少噪音:告别经常导致错误信号的不稳定价格变动。 Quantum Heiken Ashi 指标可过滤噪音,使您能够做出更明智的交易决策 无缝集成:Heiken Ashi 指标专为 MetaTrader 开发,可无缝集成到您的交易平台中。它用户友好、高度可定制,并且与您的其他交易指标和过滤器兼容 无论您是寻求新优势的经验丰富的交易者,
Gartley Hunter Multi - An indicator for searching for harmonic patterns simultaneously on dozens of trading instruments and on all possible timeframes. Manual (Be sure to read before purchasing) | Version for MT4 Advantages 1. Patterns: Gartley, Butterfly, Shark, Crab. Bat, Alternate Bat, Deep Crab, Cypher
2. Simultaneous search for patterns on dozens of trading instruments and on all possible timeframes
3. Search for patterns of all possible sizes. From the smallest to the largest
4. A
Fractal Advanced - displays Fractal and Alligator indicators on the price chart. Has wide options for settings and customization. It is also equipped with alerts and a hotkey system. Manual (Be sure to read before purchasing) | Version for MT4 Advantages
1. The indicator does not fill the entire chart with fractals, but allows you to display only relevant signals. 2. The number of fractals is adjusted by scrolling the mouse while holding down the Shift key. 3. Instantly show/hide the Alligator
WHY IS OUR FXACCCURATE LS MT5 THE PROFITABLE ? PROTECT YOUR CAPITAL WITH RISK MANAGEMENT
Gives entry, stop and target levels from time to time. It finds Trading opportunities by analyzing what the price is doing during established trends. POWERFUL INDICATOR FOR A RELIABLE STRATEGIES
We have made these indicators with a lot of years of hard work. It is made at a very advanced level.
Established trends provide dozens of trading opportunities, but most trend indicators completely ignore them!
The indicator very accurately determines the levels of the possible end of the trend and profit fixing. The method of determining levels is based on the ideas of W.D.Gann, using an algorithm developed by his follower Kirill Borovsky. Extremely high reliability of reaching levels (according to K. Borovsky - 80-90%) Indispensable for any trading strategy – every trader needs to determine the exit point from the market! Precisely determines targets on any timeframes and any instruments (forex, met
The Volume by Price Indicator for MetaTrader 5 features Volume Profile and Market Profile TPO (Time Price Opportunity). Volume and TPO histogram bar and line charts. Volume Footprint charts. TPO letter and block marker collapsed and split structure charts. Session filtering and grouping. Static, dynamic and flexible range segmentation and compositing methods with relative and absolute visualizations. Graphical layering, positioning and styling options to suit the user's analytic and aesthetic n
Was: $249 Now: $99 Market Profile defines a number of day types that can help the trader to determine market behaviour. A key feature is the Value Area, representing the range of price action where 70% of trading took place. Understanding the Value Area can give traders valuable insight into market direction and establish the higher odds trade. It is an excellent addition to any system you may be using. Inspired by Jim Dalton’s book “Mind Over Markets”, this indicator is designed to suit the
Currently Price 20% OFF ( for unlimited use ) Indicator USER MANUAL , trade setups, solving issues, etc : Direct Download Here ( for users only ) Hello World! Introducing.. SMCpro tool and Indicator for MetaTrader 5 , a cutting-edge feature designed to revolutionize your trading experience. With innovative ICT Smart Money Concept, you gain unparalleled insight into market dynamics, empowering you to make informed trading decisions like never before. SMC Indicator built on th
【Super Scanner】Indicator Introduction : The color of the Super Scanner which is green and climbing up means that the price trend is going up.The color of the Super Scanner is red and going down means that the price trend is going down.
It is very simple to use it to judge the market trend! What's even better is that the open parameters of the indicators allow investors to adjust. You can adjust【Super Scanner】according to your needs. Adjust it faster to be closer to short-term market fluctuati