SMC Unmitigated Finding MT4
- 指标
- Panthita Aichoi
- 版本: 1.2
- 更新: 1 八月 2023
- 激活: 5
1 of 10 for 69$
.
Next Price is 89$
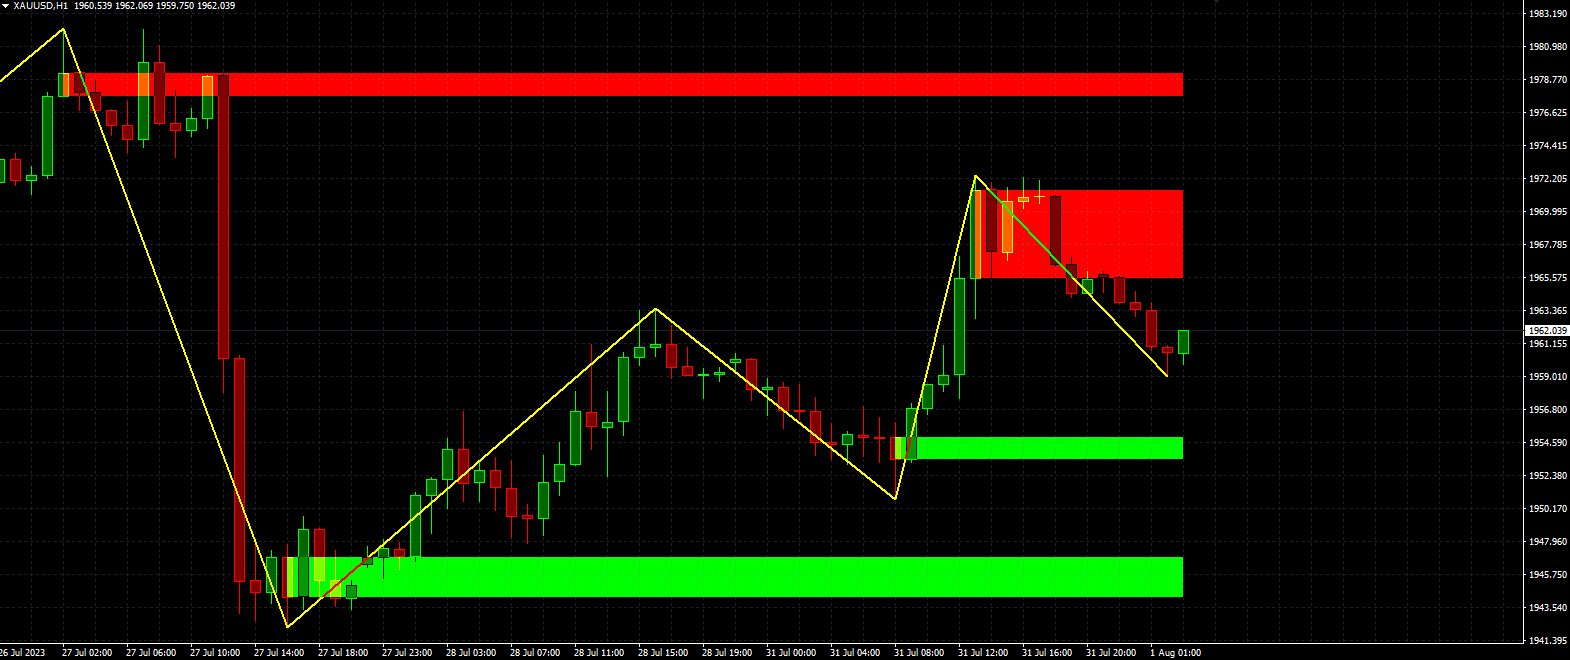
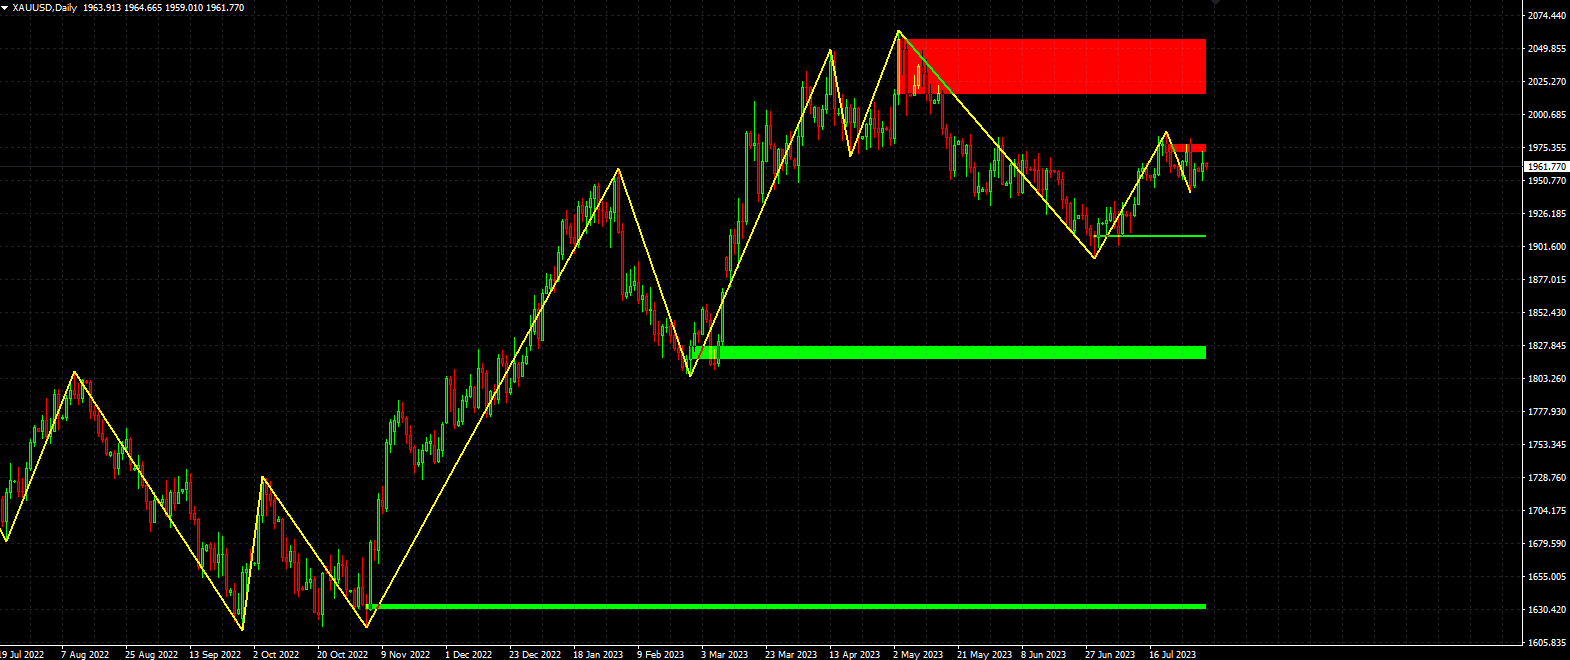
SMC Unmitigated Finding is a indicator for find unmitigated supply and demand in previous legs of price
Settings
- Zigzag Settings
- ZZDepth - by Default is 12.
- ZZDeviation - by Default is 5.
- ZZBackStep - by Default is 3.
- Rectangle Settings
- SupportColor- color for Support line.
- ResistanceColor - color for Resistance line.
- Settings
- Num of Show- Number of Support & Resistance Show.