• 概述
  • 评论
  • 评论 (5)
  • 新特性

Order Book

结合 Delta 足迹图,全面了解市场容量概况:

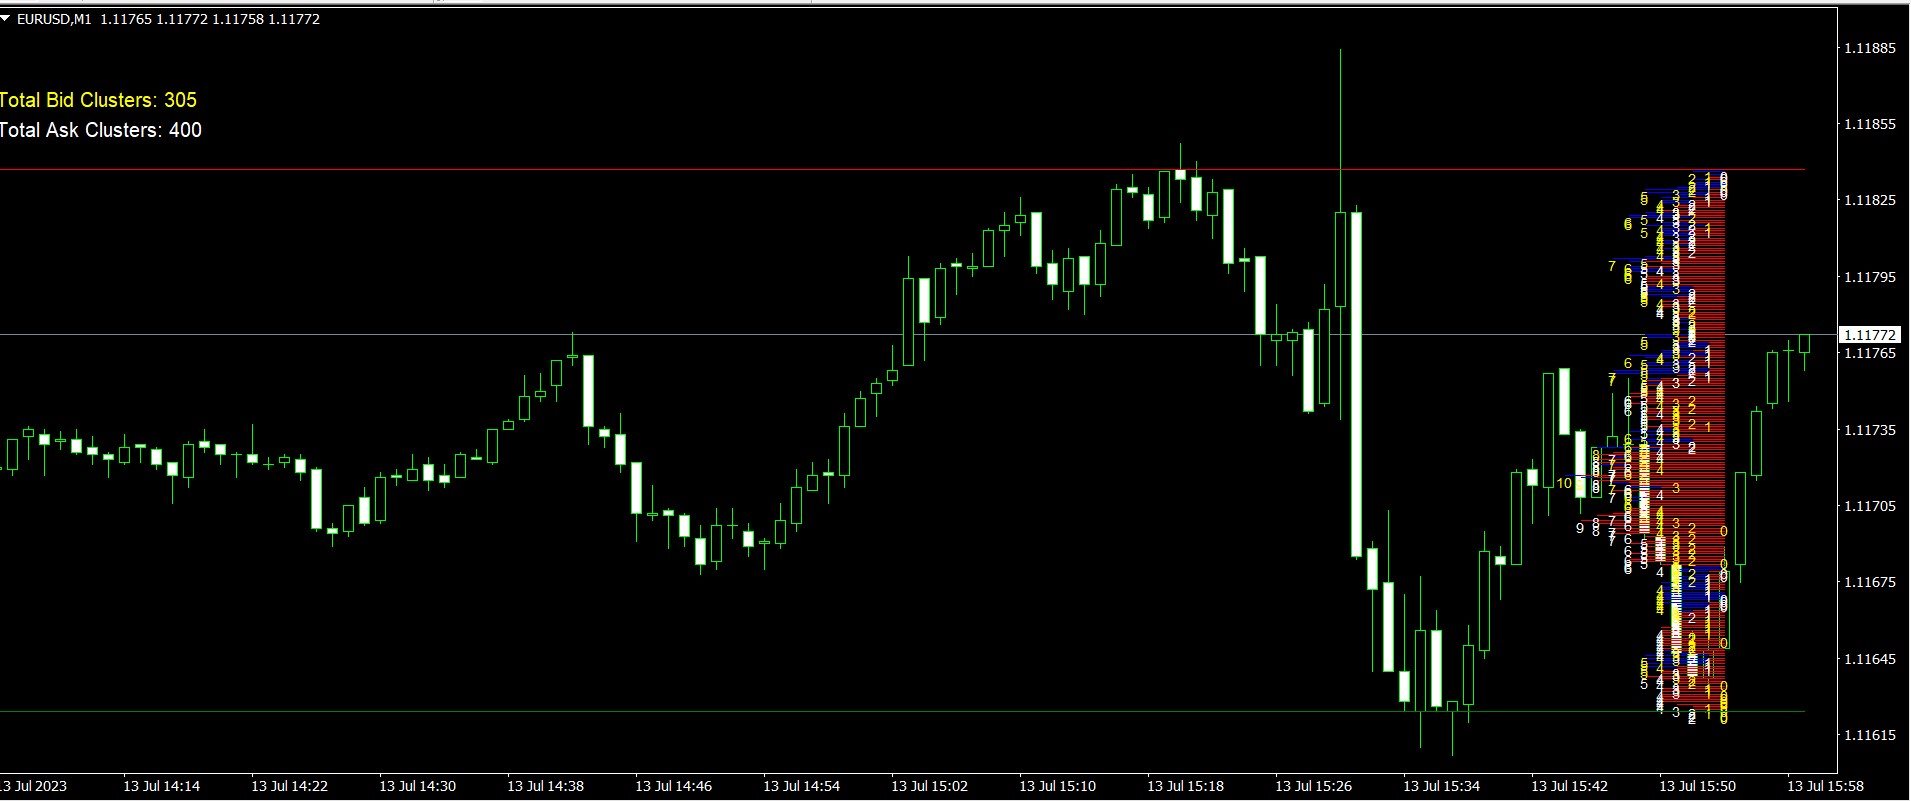
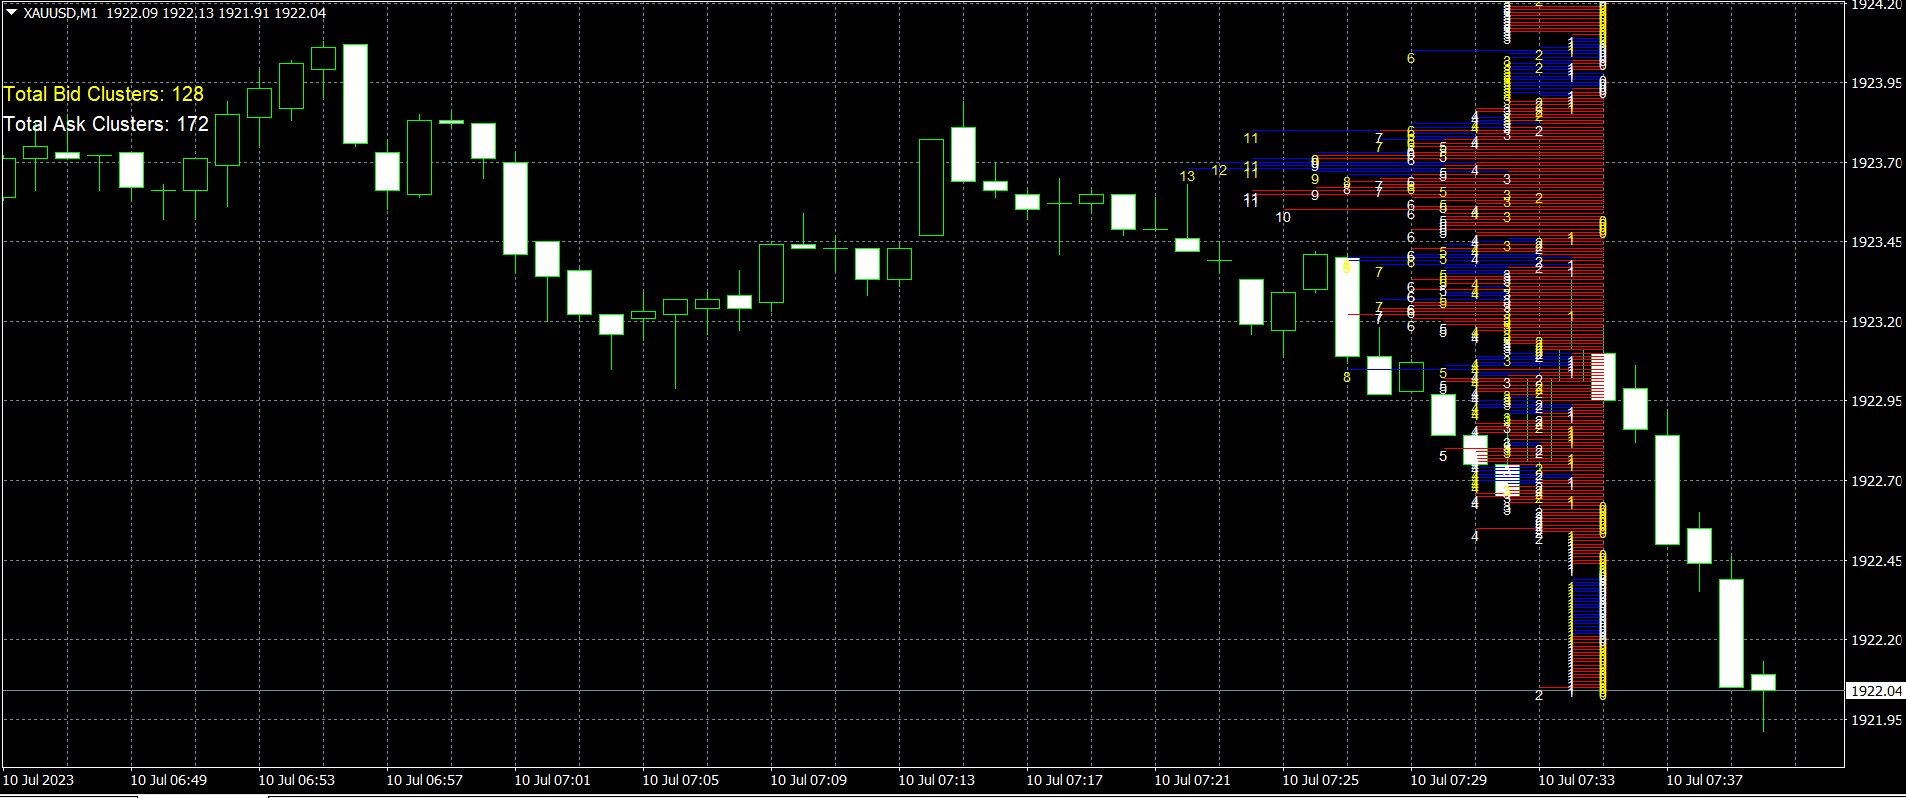
“订单簿”指标在价格图表上显示代表买价和卖价数量集群的直方图。

  该指标分析历史价格数据并计算指定数量的柱内每个价格水平的买价和卖价交易量集群。 买入量集群显示为蓝色,而卖出量集群显示为红色。

该指标提供有关不同价格水平的买入量和卖出量分布的信息。 交易者可以使用此信息来识别交易活动频繁的区域和潜在的支撑/阻力水平。 直方图条代表每个价格水平的买入和卖出集群的数量,提供市场流动性的直观表示。

除了直方图条形之外,该指标还显示文本标签,显示分析期间的出价和要价集群总数。 随着新价格数据的出现,这些标签会实时更新。
推荐产品
BoxChart MT4
Evgeny Shevtsov
4.5 (6)
The market is unfair if only because 10% of participants manage 90% of funds. An ordinary trader has slim changes to stand against these "vultures". This problem can be solved. You just need to be among these 10%, learn to predict their intentions and move with them. Volume is the only preemptive factor that faultlessly works on any timeframe and symbol. First, the volume appears and is accumulated, and only then the price moves. The price moves from one volume to another. Areas of volume accumu
Volume Profile Indicator for MT4 Gain a trading edge with the "Volume Profile" indicator for MetaTrader 4 (MT4). This advanced technical analysis tool allows you to precisely identify key support and resistance levels based on transaction volume. Easily visualize market areas of high interest, where trading volumes are highest, and use this information to make more informed trading decisions. Key Features: Clear and detailed visualization : The indicator displays volume histograms directly on th
这是一个预测蜡烛收盘价的指标。 该指标主要用于 D1 图表。 该指标适用于传统外汇交易和二元期权交易。 该指标可以用作独立的交易系统,也可以作为您现有交易系统的补充。 该指标分析当前蜡烛,计算蜡烛本身内部的某些强度因素,以及前一根蜡烛的参数。 因此,该指标预测市场走势的进一步方向和当前蜡烛的收盘价。 由于这种方法,该指标既适用于短期盘中交易,也适用于中长期交易。 该指标允许您设置指标在分析市场情况期间将产生的潜在信号的数量。 在指标设置中有一个特殊的参数。 此外,该指标可以通过图表上的消息、电子邮件以及推送通知的形式通知新信号。感谢您的关注!交易愉快! 购买后一定要写信给我! 我会给你我的交易指标的建议! 还可以获得奖金!
Blahtech Market Profile
Blahtech Limited
4.53 (15)
Was: $249  Now: $149   Market Profile defines a number of day types that can help the trader to determine market behaviour. A key feature is the Value Area, representing the range of price action where 70% of trading took place. Understanding the Value Area can give traders valuable insight into market direction and establish the higher odds trade. It is an excellent addition to any system you may be using. Blahtech Limited presents their Market Profile indicator for the MetaTrader community. In
VPO Profile MT4
Kyra Nickaline Watson-gordon
5 (2)
Definition : VPO is a Volume Price Opportunity. Instead of using bars or candles with an Open, High, Low, and Close price, each "bar" in a Market Profile is represented by horizontal bars against the price It is called Market Profile terminology. In other words volume-price-opportunity (VPO) profiles are histograms of how many volumes were traded at each price within the span of the profile. By using a VPO chart, you are able to analyze the amount of trading activity, based on volume, for each
Market Dynamics
Thomas Bradley Butler
市场动态用于趋势剥头皮。 蓝色是买入,红色是卖出。 这些线是价格整合的区域,常规的蜡烛线是未确定的。 价格将在支撑线和阻力线之间盘整,然后价格走势突破该区域。 在上方或下方绘制头皮区域,并遵循头皮的主要趋势或日间交易。 市场动态用于趋势剥头皮。 蓝色是买入,红色是卖出。 这些线是价格整合的区域,常规的蜡烛线是未确定的。 价格将在支撑线和阻力线之间盘整,然后价格走势突破该区域。 在上方或下方绘制头皮区域,并遵循头皮的主要趋势或日间交易。 市场动态用于趋势剥头皮。 蓝色是买入,红色是卖出。 这些线是价格整合的区域,常规的蜡烛线是未确定的。 价格将在支撑线和阻力线之间盘整,然后价格走势突破该区域。 在上方或下方绘制头皮区域,并遵循头皮的主要趋势或日间交易。
该指标旨在确定一天内最大交易活动的时间。 计算完成后,指标建立最重要的交易水平。 将这些水平与实际价格行为进行比较可以提供有关市场趋势强度和方向的信息。 指标的特点 时间范围必须低于 D1。 推荐时间范围:M15、M30 和 H1。 H1 以上的时间框架可以给出非常粗略的画面。 使用低于 M15 的时间框架可能会导致短暂的交易爆发。 该指标对历史数据敏感。 因此,我建议在图表窗口中至少设置 50,000 个柱。 指标参数 Base - 设置计算交易活动的基准期。 day - 计算交易活动时考虑了一天中的时间。 week – 交易活动的计算考虑了一天中的时间和一周中的某一天。 Width - 线宽。 ClrMean、ClrUp 和 ClrDn 是中、上、下交易水平的颜色。 Style1 - Style5 – 显示交易水平的样式。 AlertsOn - 打开交易时段开始的通知。 MailOn - 启用将消息发送到电子邮件的权限。 NotificationOn - 允许向移动终端发送消息。 
A technical indicator that calculates its readings on trading volumes. In the form of a histogram, it shows the accumulation of the strength of the movement of the trading instrument. It has independent calculation systems for bullish and bearish directions. Works on any trading instruments and time frames. Can complement any trading system. The indicator does not redraw its values, the signals appear on the current candle. It is easy to use and does not load the chart, does not require addition
VN Trade Panel II
Vyacheslav Nekipelov
4 (1)
The new version of the trading panel, which now has the ability to separately close Buy and Sell orders, display targets for all orders on the chart, as well as the ability to use the panel to trade with brokers working on the FIFO rule. Also, the new version adds option buttons for separate management of open orders. It has a convenient visualized interface and intuitive control without a lot of additional tabs to which traders have to be distracted and switch their attention. Thanks to this,
Master scalping M1
Nataliia Marchuk
Master Scalping M1 is an innovative indicator that uses an algorithm to quickly and accurately determine the trend.The indicator calculates the time of opening and closing positions, the indicator's algorithms allow you to find the ideal moments to enter a deal (buy or sell an asset), which increase the success of transactions for most traders. Benefits of the indicator: Easy to assemble, does not overload the chart with unnecessary information. Can be used as a filter for any strategy. Works on
Blahtech Supply Demand
Blahtech Limited
4.58 (36)
Was: $299  Now: $149   Supply Demand uses previous price action to identify potential imbalances between buyers and sellers. The key is to identify the better odds zones, not just the untouched ones. Blahtech Supply Demand indicator delivers functionality previously unavailable on any trading platform. This 4-in-1 indicator not only highlights the higher probability zones using a multi-criteria strength engine, but also combines it with multi-timeframe trend analysis, previously confirmed swings
Introduction It is common practice for professional trades to hide their stop loss / take profit from their brokers. Either from keeping their strategy to the themselves or from the fear that their broker works against them. Using this indicator, the stop loss / take profit points will be drawn on the product chart using the bid price. So, you can see exactly when the price is hit and close it manually.  Usage Once attached to the chart, the indicator scans the open orders to attach lines for t
EZZ Elite Zig Zag is an indicator for the MetaTrader 4 terminal. This indicator traces the peak of the trend based on the market reversal, thus showing various opportunities in the financial market. EZZ Elite Zig Zag is a visual tool, intuitive, and easy to understand and use.  Test it Yourself by Downloading it for Free. Author Paulo Rocha all rights reserved
VR Grid
Vladimir Pastushak
5 (3)
VR 网格指示器 设计 用于创建具有用户定义设置的图形网格。与 标准网格 不同,VR 网格用于构建 圆形关卡 。根据用户的选择,轮次级别之间的步长可以是任意的。此外,与其他指标和实用程序不同,即使时间段发生变化或终端重新启动,VR Grid 也能保持网格的位置 。 设置、设置文件、演示版本、说明、问题解决,可以从以下位置获取 [博客] 您可以在以下位置阅读或撰写评论 [关联] 版本为 [MetaTrader 5] 垂直级别 基于实际时间间隔并 忽略缺失 或不存在的周期。因此,级别之间的步长严格对应于用户选择的值。 使用 VR 网格指标时,交易者 可以更改任何级别的垂直线和水平线的样式 、颜色和粗细。这使您可以控制金融工具的 回合水平 。 整数位是 以两个或多个零结尾 的价格(例如:1.23500、5.65900、1923.200)。人们相信,这样的水平 经常充当 作为支撑或阻力的强点。 Horizontal line settings Horizontal line step Horizontal line color Horizontal line style Horizonta
FREE
VolumeProfile
Robert Hess
3.8 (5)
Descption: The Volume Profile displays detailed informations of historical trading activities at certain price levels (Market Profile). So you can locate the areas with the best prices in the market and get an advantage about other market participants. Features: Customizable Volume Profile / Market Profile Shows the "fair" Value Area with 70% of all Volume Shows critical low volume zones Shows VPOC, VAL and VAH Points Works on all timeframes Also available for MT5 ( https://www.mql5.com/en/mark
The Chaikin Oscillator is a technical indicator developed by Marc Chaikin that combines price and volume data to measure the accumulation and distribution of a financial instrument. It aims to identify potential buying and selling opportunities in the market. The Chaikin Oscillator is calculated by subtracting a 10-day exponential moving average of the Accumulation Distribution Line (ADL) from a 3-day exponential moving average of the ADL. Here's how to use the Chaikin Oscillator indicator in tr
History Pattern Search
Yevhenii Levchenko
该指标建立当前报价,可以与历史报价进行比较,并在此基础上进行价格走势预测。指示器有一个文本字段,用于快速导航到所需日期。 选项: 符号 - 选择指标将显示的符号; SymbolPeriod - 选择指标从中获取数据的时段; IndicatorColor - 指示器颜色; HorisontalShift - 由指标绘制的报价移动指定的柱数; Inverse - true 反转引号,false - 原始视图; ChartVerticalShiftStep - 图表垂直移动(键盘上的向上/向下箭头); 接下来是文本字段的设置,您可以在其中输入日期,您可以通过按“回车”立即跳转到该日期。 接下来是文本字段的设置,您可以在其中输入日期,您可以通过按“回车”立即跳转到该日期。
This multicurrency indicator is the Lite version of the Cosmic Diviner Reversal Zone Pro indicator. The indicator is based on original formulas for analyzing the volatility and price movement strength. This allows determining the overbought and oversold states of instruments with great flexibility, as well as setting custom levels for opening buy or sell orders when the overbought or oversold values of the instruments reach a user-defined percentage. A huge advantage of Reversal Zone Lite is the
Simply The Best Pro
Szymon Palczynski
5 (1)
This indicator displays the histogram and arrows on chart. When Simple The Best Pro are placed on a chart, they identify the trend.  The color of may be blue or red. The blue color stands for upside moves and the red color stands for downside trends. The indicator offers to set Stop Loss (SL) and  Take Profit (TP)  setting. The default value is ATR. Indicator has automatic optimization. The STB is a unique indicator that shows the tendency (button Bars) of a particular signals. The STB tells us
Force Price Power
Jesus Daniel Quiroga
強制價格力量是一個非常強大的指標,除了市場中正在發生的操作量之外,還通過動態平均提供有價值的實際價格信息。 該指標特別適用於識別價格的動態力量。 零距離(從零向上或從零向下)將表示強度和功率的程度,無論是看跌還是看漲。 Force Price Power is a very powerful indicator that provides valuable and useful information about the real force of the price, dynamically averaging the volume of operations that are taking place in the market. This indicator is special to identify the dynamic force of the price. The zero distance (either up from zero or down from zero) would indicate the degree of strength and power,
An indicator of patterns #24, #25, #26 and #27 ("Head and Shoulders", "Complex Head and Shoulders") from Encyclopedia of Chart Patterns by Thomas N. Bulkowski. Parameters: Alerts - show alert when an arrow appears   Push - send a push notification when an arrow appears (requires configuration in the terminal) PeriodBars - indicator period K - an additional parameter that influences the accuracy of pattern shape recognition. The smaller the value is, the smoother the row of peaks/valleys should
Quantum Volume Point of Control Indicator
QUANTUM TRADING SOFTWARE LIMITED
5 (1)
The Quantum VPOC indicator has been developed to expand the two dimensional study of volume and price, to a three dimensional one which embraces time. The volume/price/time relationship then provides real insight to the inner workings of the market and the heartbeat of sentiment and risk which drives the price action accordingly. The Quantum VPOC indicator displays several key pieces of information on the chart as follows: Volume Profile - this appears as a histogram of volume on the vertical pr
GND Tail Candle
Nguyen Dang Giang
A tall upper shadow occurs when the price moves during the period, but goes back down, which is a bearish signal. A tall lower shadow forms when bears push the price down, but bulls pull it back up, which leaves a long line or shadow. This is considered a bullish signal. Some technical analysts believe a tall or long shadow means the stock will turn or reverse. Some believe a short or lower shadow means a price rise is coming. In other words, a tall upper shadow means a downturn is coming, while
CumulativeDeltaBars
Stanislav Korotky
This indicator is a conventional analytical tool for tick volumes changes. It calculates tick volumes for buys and sells separately, and their delta on every bar, and displays volumes by price clusters (cells) within a specified bar (usually the latest one). The algorithm used internally is the same as in the indicator VolumeDelta , but results are shown as cumulative volume delta bars (candlesticks). Analogous indicator for MetaTrader 5 exists - VolumeDeltaBars . This is a limited substitution
TWO PAIRS SQUARE HEDGE METER INDICATOR Try this brilliant 2 pairs square indicator It draws a square wave of the relation between your two inputs symbols when square wave indicates -1 then it is very great opportunity to SELL pair1 and BUY Pair2 when square wave indicates +1 then it is very great opportunity to BUY pair1 and SELL Pair2 the inputs are : 2 pairs of symbols         then index value : i use 20 for M30 charts ( you can try other values : 40/50 for M15 , : 30 for M30 , : 10 for H1 ,
Trend Deviation
VLADISLAV AKINDINOV
Trend indicator with calculation of dynamic levels and signaling their intersection. Description of input parameters: StepTF = true; - Calculation of the indicator by closing the bar (true) or by each tick (false) BarsCount = 300; - Number of settlement bars Price = PRICE_CLOSE; - Type of price used TimeFrame = PERIOD_CURRENT; - Estimated timeframe TrendPeriod = 9; - Trend calculation period TrendDeviations = 4.9; - coefficient of deviation PeriodTrendSmooth = 1; - Trend smoothing perio
This indicator presents an alternative approach to identify Market Structure. The logic used is derived from learning material created by   DaveTeaches (on X) Upgrade v1.10: add option to put protected high/low value to buffer (figure 11, 12) When quantifying Market Structure, it is common to use fractal highs and lows to identify "significant" swing pivots. When price closes through these pivots, we may identify a Market Structure Shift (MSS) for reversals or a Break of Structure (BOS) for co
The indicator analyzes the change in the minimum and maximum prices of the previous bars fixing the entrance of the big players. If the change (delta) increases, a signal is displayed on the graph in the form of an arrow. At the same time, virtual trade on history is carried out. In case of a repeat of the signal, the positions are increased (refilling). Thus the lot of positions can differ. The results of virtual trading in the form of losses / losses, profitability, drawdown and transaction li
Trade with Gann on your side!! MASTER CIRCLE 360 CIRCLE CHART, originally created by Gann admitted that this is “The Mother of all charts”. It is one of the last studies that this great trader left for us. The numeric tab le is apparently quite simple like all the tables and is based on square numbers, the SQUARE OF 12 and is by evolution, one of the most important square numbers. Here we can find CYCLE, PRICE AND TIME thanks to angles and grades, to show past and future support and resistance.
Noize Absorption Index MT4
Ekaterina Saltykova
5 (1)
Noize Absorption Index - is the manual trading system that measures the difference of pressure between bears forces and bulls forces. Green line - is a noize free index that showing curent situation. Zero value of index shows totally choppy/flat market.Values above zero level shows how powerfull bullish wave is and values below zero measures bearish forces.Up arrow appears on bearish market when it's ready to reverse, dn arrow appears on weak bullish market, as a result of reverse expectation. S
该产品的买家也购买
Cycle Maestro
Stefano Frisetti
NOTE: CYCLEMAESTRO is distributed only on this website, there are no other distributors. Demo version is for reference only and is not supported. Full versione is perfectly functional and it is supported CYCLEMAESTRO , the first and only indicator of Cyclic Analysis, useful for giving signals of TRADING, BUY, SELL, STOP LOSS, ADDING. Created on the logic of Serghei Istrati and programmed by Stefano Frisetti ; CYCLEMAESTRO is not an indicator like the others, the challenge was to interpret only t
Gann Made Easy
Oleg Rodin
4.81 (119)
Gann Made Easy 是一个专业且易于使用的外汇交易系统,它基于使用先生理论的最佳交易原则。 W.D.江恩。该指标提供准确的买入和卖出信号,包括止损和获利水平。您甚至可以使用推送通知在旅途中进行交易。 购买后请联系我!我将免费与您分享我的交易技巧和丰厚的红利指标! 您可能已经多次听说过江恩交易方法。通常 Gann 的理论不仅对于新手交易者而且对于那些已经有一定交易经验的人来说都是非常复杂的东西。这是因为江恩的交易方法在理论上并不那么容易应用。我花了几年时间来完善这些知识,并将最好的原则应用到我的外汇指标中。 该指标非常易于应用。您所需要的只是将其附加到您的图表并遵循简单的交易建议。该指标不断进行市场分析工作并寻找交易机会。当它检测到一个好的入口点时,它会为您提供一个箭头信号。该指标还显示止损和获利水平。 换句话说,当您像先生一样进行交易时,该指标会为您提供最佳江恩建议。江恩亲自告诉你此时此刻该做什么。但最好的部分是您不需要了解任何有关江恩交易原则的知识,因为该指标会为您完成整个市场分析工作。
Gold Stuff
Vasiliy Strukov
4.86 (258)
Gold Stuff 是专为黄金设计的趋势指标,也可用于任何金融工具。 该指标不会重绘,也不会滞后。 推荐时间框架 H1。 在它指标工作全自动专家顾问 EA Gold Stuff。 你可以在我的个人资料中找到它。 重要! 购买后立即与我联系,以获得说明和奖金!   您可以免费收到我们的强力支持和趋势扫描指标的副本,请私信。大部头书! 购买后立即联系我以获得设置和个人奖励!   设置 绘制箭头 - 打开关闭。 在图表上绘制箭头。 警报 - 打开关闭声音警报。 电子邮件通知 - 打开关闭。 电子邮件通知。 Puch-notification - 打开关闭。 推送通知。 接下来,调整色域。 Gold Stuff 是专为黄金设计的趋势指标,也可用于任何金融工具。 该指标不会重绘,也不会滞后。 推荐时间框架 H1。 在它指标工作全自动专家顾问 EA Gold Stuff。 你可以在我的个人资料中找到它。 购买后立即联系我以获得设置和个人奖励!   设置 绘制箭头 - 打开关闭。 在图表上绘制箭头。 警报 - 打开关闭声音警报。 电子邮件通知 - 打开关闭。 电子邮件通知。 Puch
Scalper Inside PRO
Alexey Minkov
4.76 (63)
!SPECIAL SALE! An exclusive indicator that utilizes an innovative algorithm to swiftly and accurately determine the market trend. The indicator automatically calculates opening, closing, and profit levels, providing detailed trading statistics. With these features, you can choose the most appropriate trading instrument for the current market conditions. Additionally, you can easily integrate your own arrow indicators into Scalper Inside Pro to quickly evaluate their statistics and profitability
Trend Screener
STE S.S.COMPANY
4.78 (93)
趋势指标,趋势交易和过滤的突破性独特解决方案,所有重要趋势功能都内置在一个工具中! 它是 100% 非重绘多时间框架和多货币指标,可用于所有符号/工具:外汇、商品、加密货币、指数、股票。 限时优惠:支撑和阻力筛选指标仅售 50美元,终身有效。(原价 250 美元)(优惠延长) 趋势筛选器是有效的指标趋势跟踪指标,它在图表中提供带有点的箭头趋势信号。 趋势分析器指标中可用的功能: 1.趋势扫描仪。 2. 具有最大利润分析的趋势线。 3.趋势货币强度计。 4. 带有警报的趋势反转点。 5. 带有警报的强趋势点。 6. 趋势箭头 每日分析示例,每日信号表现...等与我们的趋势筛选指标,可以在这里找到: 点击这里 限时优惠:Trend Screener Indicator 仅售 50 美元且终身可用。原价 125$) 通过访问我们的 MQL5 博客,您可以找到我们所有的高级指标以及分析示例、每日信号表现...等。 : 点击这里 我们的趋势系统由 2 个指标组成: 1. Trend Screener Indicator:显示趋势仪表盘、图表中的趋势线、入场点...等。 2. Trend
TrendMaestro
Stefano Frisetti
4 (4)
note: this indicator is for METATRADER4, if you want the version for METATRADER5 this is the link:  https://www.mql5.com/it/market/product/108106 TRENDMAESTRO ver 2.4 TRENDMAESTRO recognizes a new TREND in the bud, he never makes mistakes. The certainty of identifying a new TREND is priceless. DESCRIPTION TRENDMAESTRO identifies a new TREND in the bud, this indicator examines the volatility, volumes and momentum to identify the moment in which there is an explosion of one or more of these data a
FX Volume
Daniel Stein
4.6 (35)
FX Volume:从经纪商视角洞察真实市场情绪 简要概述 想要提升您的交易策略? FX Volume 可提供零售交易者和经纪商的持仓实时数据——远早于诸如 COT 之类的延迟报告。不论您希望获得持续稳定的收益,还是想在市场中多一分制胜的砝码, FX Volume 都能帮您识别重大失衡、确认突破以及完善风险管理。立即开启体验,让真实的成交量数据为您的交易决策带来革新! 1. 为什么 FX Volume 对交易者格外有用 极具准确度的早期预警 • 快速捕捉有多少交易者正在买入或卖出某个货币对——比大多数人提前一步。 • FX Volume 是 唯一 能够整合多家零售经纪商真实成交量数据并以简洁方式呈现的工具。 强力风险管理 • 及时识别多头或空头仓位的巨大不平衡,这往往预示着潜在的趋势反转,帮助您更自信地设置止损和目标位。 • 独家而真实的数据让每一次交易决策更具可靠性。 优化进场与出场点 • 发现“过度集中”的交易(大多数交易者都在同一方向),并通过真实成交量来确认突破。 • 避免依赖常见指标可能带来的误导信号,而是利用真实的实时成交量。 适配各种交易策略 • 将 FX
M1 Arrow
Oleg Rodin
5 (17)
M1 Arrow - 基于市场的两个基本原则的盘中策略。 该算法基于使用附加过滤器对交易量和价格波动的分析。该指标的智能算法仅在两个市场因素合二为一时才会发出信号。该指标使用较高时间框架的数据计算 M1 图表上某个范围的波浪。为了确认波浪,该指标使用了成交量分析。 从理论上讲,该指标可以与其他时间框架一起使用,但您需要考虑到该指标最初是为在 M1 上交易而开发的这一事实。 该指标是一个现成的交易系统。交易者所需要的只是跟随信号。此外,该指标可以成为您自己的交易系统的基础。交易仅在分钟图表上进行。 尽管指标使用 MTF 原理,但指标算法尽可能稳定。 购买后,一定要写信给我!我将与您分享我的交易设置和建议!祝您交易成功!感谢您的关注!
Algo Pumping MT4
Ihor Otkydach
5 (7)
PUMPING STATION – 您的专属“全包式”交易策略 我们为您推出PUMPING STATION —— 一款革命性的外汇指标,它将使您的交易变得更加有趣且高效。这不仅仅是一个辅助工具,而是一套完整的交易系统,具备强大的算法,帮助您开始更加稳定的交易。 购买本产品,您将免费获得: 专属设置文件:用于自动配置,实现最大化性能。 逐步视频教程:学习如何使用PUMPING STATION策略进行交易。 Pumping Utility:专为PUMPING STATION打造的半自动交易机器人,让交易变得更加方便和简单。 购买后请立即联系我,我将为您提供所有额外资源的访问权限。 PUMPING STATION如何工作: 趋势监控:能够即时识别市场趋势方向。趋势是您最好的朋友。 进场信号:图表上的箭头会提示您何时进场以及交易方向。 明确的交易目标:指标会自动识别最佳的平仓时机。 回调交易:内置的基于布林带的价格通道可检测修正结束并发出新趋势开始的信号。 效率分析:如果当前设置效果较差,系统会自动提示。只需调整PUMPING STATION,即可获得最佳性能。 功能强大: 推送和邮件通知:即
System Trend Pro
Aleksandr Makarov
5 (2)
Special offer! https://www.mql5.com/ru/users/bossik2810 System Trend Pro - This is the best trend trading indicator!!! The indicator no repaint!!!  The indicator has   MTF   mode, which adds confidence to trading on the trend (   no repaint   ). How to trade? Everything is very simple, we wait for the first signal (big arrow), then wait for the second signal (small arrow) and enter the market in the direction of the arrow. (See screens 1 and 2.) Exit on the opposite signal or take 20-30 pips,
目前八折优惠! 对任何新手或专家交易者来说都是最好的解决方案! 这个仪表板软件适用于28种货币对。它基于我们的两个主要指标(高级货币强度28和高级货币冲动)。它对整个外汇市场提供了一个伟大的概述。它显示高级货币强度值,货币运动速度和28个外汇对在所有(9)时间段的信号。想象一下,当你可以使用图表上的单一指标观察整个市场,以确定趋势和或剥头皮的机会时,你的交易将得到改善 我们已经在这个指标中建立了一些功能,使你更容易识别强势和弱势货币,同时识别和确认潜在的交易。该指标以图形方式显示货币的强势或弱势是增加还是减少,以及它在所有时间段的表现。 增加的新功能是动态市场斐波那契水平,它适应当前的市场条件变化,这是一个已经在我们的高级货币强度28和高级货币冲动指标中使用的成熟的加分项。 在交易时,总是将弱势货币和强势货币配对,这个新指标将帮助你做到这一点。 用户手册:点击这里  https://www.mql5.com/en/blogs/post/708783 特点  显示每个时间段的ACS28和GAP-speed(冲动)的货币强度值。 列:颜色代码以7种颜色显示货币强度:强势
Easy Breakout
Mohamed Hassan
5 (12)
After your purchase, feel free to contact me for more details on how to receive a bonus indicator called VFI, which pairs perfectly with Easy Breakout for enhanced confluence!   Easy Breakout is a powerful price action trading system built on one of the most popular and widely trusted strategies among traders: the Breakout strategy ! This indicator delivers crystal-clear Buy and Sell signals based on breakouts from key support and resistance zones. Unlike typical breakout indicators, it levera
Golden Trend Indicator
Noha Mohamed Fathy Younes Badr
5 (10)
Golden Trend indicator  is The best indicator for predicting trend movement this indicator never lags and never repaints and never back paints    and give  arrow buy and sell    before the candle appear  and it will help you and  will make your trading decisions clearer its work on all currencies and  gold and crypto and all time frame This unique  indicator uses very secret algorithms to catch the  trends, so you can trade using this indicator and see the trend clear on charts  manual guide and
Dynamic Forex28 Navigator
Bernhard Schweigert
5 (5)
Dynamic Forex28 Navigator - 下一代外汇交易工具。 当前 49% 折扣。 Dynamic Forex28 Navigator 是我们长期流行的指标的演变,将三种功能合二为一: 高级货币强度 28 指标 (695 条评论)+ 高级货币 IMPULSE 带警报 (520 条评论)+ CS28 组合信号(奖励)。 有关指标的详细信息 https://www.mql5.com/en/blogs/post/758844 下一代强度指标提供什么? 您喜欢的原始指标的一切,现在通过新功能和更高的精度进行了增强。 主要特点: 专有货币强度公式。  所有时间范围内的平滑和准确的强度线。 非常适合识别趋势和精确进入。 动态市场斐波那契水平(市场斐波那契)。  此指标独有的独特功能。 斐波那契应用于货币强度,而不是价格图表。 适应实时市场活动以获得准确的反转区域。 实时市场动量。  第 9 行显示市场是活跃还是被动。 对于定时交易至关重要。 全面的警报和显示。  每种货币最强的买入和卖出动量。 ​​28 对的双重动量买入和卖出。 超买/超卖警告外部范围和止损。 反转
Stratos Pali
Michela Russo
5 (3)
Stratos Pali Indicator   is a revolutionary tool designed to enhance your trading strategy by accurately identifying market trends. This sophisticated indicator uses a unique algorithm to generate a complete histogram, which records when the trend is Long or Short. When a trend reversal occurs, an arrow appears, indicating the new direction of the trend. Important Information Revealed Leave a review and contact me via mql5 message to receive My Top 5 set files for Stratos Pali at no cost! Dow
Currency Strength Wizard
Oleg Rodin
4.86 (49)
货币强度向导是一个非常强大的指标,为您提供成功交易的一体化解决方案。该指标使用多个时间范围内所有货币的数据来计算这个或那个外汇对的力量。此数据以易于使用的货币指数和货币电力线的形式表示,您可以使用它们来查看这种或那种货币的力量。 您所需要的只是将指标附加到您要交易的图表上,该指标将向您显示您交易的货币的真实强度。该指标还向您显示买卖量压力的极值,您可以在顺势交易时利用这些压力。该指标还显示了基于斐波那契的可能目标。该指标可用于各种交易时间范围。该指标支持各种货币对的交易。 该指标为您提供所有类型的警报,包括推送通知。 购买后请联系我。我将与您分享我的交易技巧,并免费为您提供丰厚的红利指标! 祝您交易愉快,获利丰厚!
TPSproTREND PrO
Roman Podpora
4.68 (25)
VERSION MT5        —        ИНСТРУКЦИЯ RUS           —        INSTRUCTIONS  ENG 主要功能: 准确的输入信号,无需渲染! 如果出现信号,它仍然相关!这是与重提指标的一个重要区别,重提指标可以提供信号然后改变信号,这可能导致存款资金的损失。现在您可以以更高的概率和准确度进入市场。还有一个功能是在箭头出现后为蜡烛着色,直到达到目标(止盈)或出现反转信号。 显示止损/获利区域 为了提高搜索切入点时的视觉清晰度,创建了一个模块,该模块最初显示买入/卖出区域,在该区域中搜索进入市场的最佳点。用于处理止损水平的附加智能逻辑有助于随着时间的推移减小其大小,从而降低进入交易(移动 sl)时的初始风险。 显示较高时间范围内的最小值/最大值(MTF 模式) 添加了一项功能,可以显示较高时间间隔的最小/最大校正位置,并显示趋势变化。此外,MIN/MAX 现在有编号,显示修正内容。 风险回报率 (RR) 使用指标算法,可以检测精确的入场点,平均风险回报比超过1k2。这也伴随着视觉效果,例如,收到信号后会出现蜡烛的彩色草图。 无论价
Scalper Vault
Oleg Rodin
5 (30)
Scalper Vault 是一个专业的剥头皮系统,为您提供成功剥头皮所需的一切。该指标是一个完整的交易系统,可供外汇和二元期权交易者使用。推荐的时间范围是 M5。 该系统为您提供趋势方向的准确箭头信号。它还为您提供顶部和底部信号以及江恩市场水平。无论您拥有何种交易经验,该系统都易于使用。您只需要遵循简单的规则并每天重复该过程。 建议将此系统用于主要货币对。感谢您的关注! 请注意,该指标在策略测试器中可能无法正常工作。因此,我建议仅在模拟或真实账户的真实交易条件下使用该系统。 指示器提供所有类型的警报,包括推送通知。 购买指标后请与我联系。我将免费与您分享我的个人交易建议和出色的奖励指标! 祝您交易愉快,盈利!
- Real price is 80$ - 40% Discount (It is 49$ now) - Lifetime update free Contact me for instruction, add group and any questions! Related Products:  Bitcoin Expert , Gold Expert - Non-repaint - I just sell my products in Elif Kaya profile, any other websites are stolen old versions, So no any new updates or support. Introduction The breakout and retest strategy is traded support and resistance levels. it involves price breaking through a previous level.  The break and retest strategy is design
Reversal Master
Alexey Minkov
4.92 (13)
!SPECIAL SALE! The Reversal Master is an indicator for determining the current direction of price movement and reversal points. The indicator will be useful for those who want to see the current market situation better. The indicator can be used as an add-on for ready-made trading systems, or as an independent tool, or to develop your own trading systems. The Reversal Master indicator, to determine the reversal points,  analyzes a lot of conditions since the combined analysis gives a more accura
TPSpro RFI Levels
Roman Podpora
4.85 (27)
反转区域 / 峰值交易量 / 主要参与者的活跃区域 =       TS TPSPRO系统 俄语使用说明     /       指示     英语     /       Version MT5 该指标的每位购买者还可免费获得: 6 个月内可访问 RFI SIGNALS 服务的交易信号 - 根据 TPSproSYSTEM 算法准备的切入点。 定期更新的培训材料 - 让您沉浸在策略中并提高您的专业水平。 工作日每天 24 小时提供支持,并可以访问封闭的交易者聊天室 - 沟通、协助和市场情况分析。 作者设定的文件——自动指标设置,无需额外努力即可实现最大效果。 主要功能: 显示卖家和买家的活跃区域! 指标显示所有正确的买入和卖出第一脉冲水平/区域。当这些水平/区域被激活时,即开始寻找切入点的地方,水平会改变颜色并填充特定颜色。还会出现箭头,以便更直观地了解情况。 LOGIC AI - 激活模板时显示用于搜索入口点的区域(圆圈) 为了提高视觉清晰度,添加了使用人工智能搜索入口点的显示区域的功能。 显示更高时间范围内的级别/区域(MTF 模式) 添加了使用更高时间间隔显示级别/区域的功能
PRO Renko System
Oleg Rodin
5 (26)
PRO Renko Arrow Based System for trading renko charts.  准确的信号交易任何外汇工具. 另外,我将免费提供系统的附加模块! PRO Renko系统是RENKO图表上高度准确的交易系统。该系统是通用的。 该交易系统可应用于各种交易工具。 该系统有效地中和了所谓的市场噪音,打开了获得准确反转信号的通道。 该指标易于使用,只有一个参数负责产生信号。 您可以很容易地使算法适应您感兴趣的交易工具和renko酒吧的大小。 我很乐意通过提供任何咨询支持来帮助所有客户有效地使用该指标。 祝您交易成功!购买后,立即写信给我! 我将与您分享我的建议和我的renko发电机。 另外,我将免费提供系统的附加模块!
FX Power MT4 NG
Daniel Stein
4.94 (18)
FX Power:分析货币强度,助您做出更明智的交易决策 概述 FX Power 是一款专业工具,帮助您全面了解主要货币和黄金在任何市场条件下的真实强度。通过识别强势货币用于买入,弱势货币用于卖出, FX Power 简化了交易决策,并帮助您发现高概率的交易机会。不论您是想跟随趋势还是通过极端的 Delta 值预测反转,这款工具都能完美适应您的交易风格。别再盲目交易——用 FX Power 让您的交易更加智慧。 1. 为什么 FX Power 对交易者极具价值 实时货币和黄金强度分析 • FX Power 实时计算并显示主要货币和黄金的相对强度,助您全面了解市场动态。 • 监控领先或落后资产,轻松识别值得交易的货币对。 全面的多时间框架视图 • 跟踪短期、中期和长期时间框架的货币和黄金强度,以便将您的交易策略与市场趋势保持一致。 • 无论是快进快出的短线交易还是更长期的投资策略, FX Power 都能为您提供所需的信息。 Delta 动态分析用于趋势和反转 • 极端 Delta 值常常预示反转机会,而平缓的 Delta 变化则确认趋势延续。 • 使用 Delta 分析,轻
Beast Super Signal
Dustin Vlok
4.73 (89)
正在寻找可以帮助您轻松识别有利可图的交易机会的强大外汇交易指标? Beast Super Signal 就是您的不二之选。 这个易于使用的基于趋势的指标持续监控市场状况,寻找新的发展趋势或跳入现有趋势。当所有内部策略一致且彼此 100% 融合时,Beast Super Signal 会发出买入或卖出信号,无需额外确认。当您收到信号箭头警报时,只需买入或卖出。 购买后给我留言,让我加入我的私人 VIP 群组! (仅限购买完整产品)。 购买后给我发消息以获取最新的优化设置文件。 此处提供 MT5 版本。 在此处 获取 Beast Super Signal EA。 查看评论部分以查看最新结果! Beast Super Signal 根据您偏好的 1:1、1:2 或 1:3 风险回报率建议入场价、止损和获利水平,让您放心交易。这个 Beast Super Signal 是 100% 不可重新绘制的,这意味着它永远不会重新计算或重新绘制,每次都能为您提供可靠的信号。 Beast Super Signal 指标适用于所有时间范围,包括货币对、指数、商品和加密货币对。 Beast Su
Hit Rate Top Bottom Signal
Martin Alejandro Bamonte
命中率顶部底部信号 命中率顶部底部信号 命中率顶部底部信号 提供了一种完全创新的方法。 它非常适合那些希望预先评估信号在特定 TP-SL 下的表现以及在哪些货币对/时间框架(TF)中效果最佳的人。 命中率顶部底部信号 策略是 任何交易员和任何交易类型 的重要工具,因为它不仅发出 精确且不重绘的信号 ,明确指示何时交易以及交易方向,而且还 详细记录每个货币对和时间框架的命中率 ,并预设止盈(TP)和止损(SL)。 这使得能够提前知道信号的有效性比率 ,对于良好的风险管理和精确的交易至关重要。 该策略的独特之处在于它专注于在波动的反转点进行检测,而不是在整个行情中,这使得信号的发出频率比传统的顶部底部信号更高,专注于 市场每一个重要波动的关键时刻。 这种以百分比显示 信号历史效果与SL/TP比率结合的能力 使得这项策略成为安全交易的最佳选择,让交易员能够基于数据做出决策。 依靠一个不仅清晰直接而且历史记录良好的信号,我们正在使用市场上最好的策略之一。 如何使用该系统进行交易? 打开多个货币对并在每个货币对上加载指标。现在,分析每个货币对,以确定哪些货币对和时间框架(TF)信号效果
Quantum Trend Sniper Indicator MT4
Bogdan Ion Puscasu
4.68 (40)
介绍   量子趋势狙击指标 ,突破性的 MQL5 指标,正在改变您识别和交易趋势反转的方式!由拥有超过13年交易经验的资深交易员团队开发,     量子趋势狙击指标   旨在通过其创新的方式以极高的准确度识别趋势反转,将您的交易之旅推向新的高度。 ***购买量子趋势狙击指标,即可免费获得量子突破指标!*** 当量子突破指标识别出趋势反转时,它会向您发出警报和信号箭头,并建议您三个止盈水平。 它既适合新手交易者,也适合专业交易者。 量子 EA 通道:       点击这里 MT5版本:       点击这里 建议: 时间范围:  所有时间范围。为了获得最佳结果,我们建议在 M15、M30 和 H1 时间范围内使用它。 货币对:欧元兑美元、英镑兑美元、澳元兑美元、欧元兑英镑, EURAUD, XAUUSD 账户类型:ECN、Raw 或 Razor,点差极低 经纪时间:任意 经纪商:IC Markets、Pepperstone with Raw 和 Razor 的点差最低 建议止损:50 点 建议止盈水平:20 点、50 点和 100 点 规格: 不重漆! 最多
Currency Strength Exotics
Bernhard Schweigert
4.88 (32)
目前8折优惠! 对任何新手或专家交易者来说都是最好的解决方案! 这个指标是专门用来显示任何符号的货币强度,如异国货币对、商品、指数或期货。它是同类产品中的第一个,任何符号都可以添加到第9行,以显示黄金、白银、石油、DAX、US30、MXN、TRY、CNH等的真实货币强度。这是一个独特的、高质量的、负担得起的交易工具,因为我们已经纳入了一些专有的功能和一个新的公式。想象一下,你的交易将如何改善,因为你能够准确地确定新趋势或剥头皮机会的触发点? 用户手册:点击这里   https://www.mql5.com/en/blogs/post/708876 它适用于所有时间框架。你将很快能够看到TREND! 根据新的基础算法设计,它使识别和确认潜在交易变得更加容易。这是因为它以图形方式显示了8种主要货币和一种符号的强弱。 该指标显示了8种主要货币(澳元加元瑞士法郎欧元英镑日元新西兰美元)的强弱线,再加上一个符号! 该指标显示了符号的真实价值。例如:对于XAUUSD(黄金):价格以美元报价。如果黄金在上涨,你怎么能知道是黄金的强势还是美元的弱势?只有当黄金走强时,我们才会进行交易。该指
IQ FX Gann Levels
INTRAQUOTES
5 (2)
IQ FX Gann Levels a precision trading indicator based on W.D. Gann’s square root methods. It plots real-time, non-repainting support and resistance levels to help traders confidently spot intraday and scalping opportunities with high accuracy. William Delbert Gann (W.D. Gann) was an exceptional market analyst, whose trading technique was based on a complex blend of mathematics, geometry, astrology, and ancient mathematics which proved to be extremely accurate. Download the Metatrader 5 Version M
Enigmera
Ivan Stefanov
5 (7)
ENIGMERA: 市场的核心 重要提示:MQL5.com 演示版本在策略测试器中运行,可能无法完全反映 Enigmera 的功能。请查看描述、截图和视频了解详细信息。如有任何问题,请随时联系我! 该指标的代码已完全重写。版本 3.0 增加了新功能并修复了自指标发布以来积累的错误。 简介 这个指标和交易系统是金融市场的一种独特方法。ENIGMERA 使用分形周期来精确计算支撑和阻力水平。它展示了真实的积累阶段,并提供了方向和目标。无论是在趋势中还是在修正中,这个系统都能工作。 它是如何工作的 指标的大部分功能通过图表左侧的按钮控制,使得能够快速响应不同的市场情况。 按钮 ON/OFF – 显示或隐藏整个指标。 Channel – 激活支撑通道,显示可接受的偏差范围。 Dev1 (第一偏差) – 指示价格在支撑偏差内的波动,信号表示市场正在整合或积累力量。 Dev2 (第二偏差) – 显示价格在偏差之间的波动,表示趋势形成和方向。 Dev3 (第三偏差) – 表示趋势的显著加速和高波动性。 45deg (45度) – 显示市场的节奏和相对于 45 度线的运动稳定性。 Tgt1/2
Golden Arrow Scalper
Felipe Jose Costa Pereira
5 (1)
GOLDEN ARROW SCALPER! 主要功能: 精准入场信号 :基于数学计算,识别理想的入场时机,优化您的交易决策。 即时提醒 :每当交易信号出现时,实时接收声音通知。 可自定义设置 :调整EMA参数,使指标与您的交易策略和风格相匹配。 直观的可视化效果 :利用对比鲜明的颜色(海绿色和红色)突出信号,方便阅读和决策。 高速性能 :专为在任何交易平台上快速高效运行而设计。 为什么选择Golden Arrow Scalper? 专家打造 :由Felipe FX开发,他因对交易市场和分析工具的卓越贡献而备受推崇。 实用且易用 :适合初学者和经验丰富的交易者,配置直观且易于使用。 持续更新和支持 :享受定期更新和专属支持,确保您的工具始终跟随市场趋势。 立即获取,让您的交易更加自信精准!
作者的更多信息
HFTHackerMT5
Thomas Bradley Butler
5 (2)
由於優化過程的複雜性和用戶的混亂,這已經回到了簡單版本而沒有恢復。 如果您購買了低於 15 的先前版本且具有恢復功能,請勿使用 15。 如果它太複雜用戶就不會使用。 在測試和使用之前優化 EA。僅在優化後才購買。這適合那些知道如何優化並希望憑藉自身優勢獲利的交易者。 您設定您的風險參數。如果您選擇不成功的交易,則可透過停損獲得高勝率。降低長壽風險。 這適用於所有帳戶,是一個風險管理工具,請閱讀所有評論、描述和部落格。 MT4版本: https://www.mql5.com/en/market/product/73834 此智慧交易系統 (EA) 使用每個部位的固定手數自動執行買賣交易。其核心特點是無論帳戶餘額如何,都保持一致的交易規模,確保交易者完全控制每筆交易的風險。這種方法可以實現簡單且可預測的交易策略,無需根據帳戶規模或波動進行調整。透過保持手數大小固定,交易者可以避免動態大小的複雜性,同時堅持他們首選的風險管理策略。 透過購買和使用此 Expert Advisor (EA),您承認您已在策略測試器上徹底測試了 EA,並了解自動交易中涉及的相關風險。您進一步承認,過去的表
NeuroScalper
Thomas Bradley Butler
5 (1)
更新!箭头被添加到 100 和 200 级别。 该指标可准确访问极端情况,并主要支持 1 分钟时间范围内的买入头寸。可以使用其他时间范围,但级别不同。它是一个更好的振荡器,并与其他振荡器进行比较以查看差异。 使用神经网络概念的日间交易。该指标使用神经网络的基本形式来生成买卖信号。在 1 分钟图表上使用该指标。指示器不会重新绘制。下载并使用 1 分钟图表或其他使用不同级别的图表在测试仪上运行,分析交易以亲自查看。剥头皮市场的许多机会。可用于更高的时间范围,但应根据您的判断更改水平。较高的时间范围具有较高的范围。 使用此模型要考虑的概念和事项: 使用了多个指标,应用了权重,最大值和最小值为 2 个数据点。该指标主要用于交易上升趋势在振荡器的设置(见图)100 和 200 中添加级别,如果使用不同的时间框架,则添加其他级别。
ForexReversal
Thomas Bradley Butler
4 (1)
耐心是无压力剥头皮的关键。 当您看到它通过 200 移动平均线时交易箭头,并通过扩大或从没有移动平均过滤器的最后一个摆动点形成趋势。 适用于 1 分钟时间框架,捕捉日内动量走势。 使用追踪止损轻松获得 20 个点或为更大的趋势停留更长时间。 查看该指标中真正大笔交易的照片中的示例。 1 分钟的时间框架效果最好。 缩小以查看趋势。 箭头不会重新绘制或重新计算。 附加到 1 分钟的时间框架并研究交易,看看它是否可用于您的策略。 一世 规则: 买蓝色 红色出售 远离横盘整理 交易量大,交易动量 使用止损 耐心是无压力剥头皮的关键。 当您看到它通过 200 移动平均线时交易箭头,并通过扩大或从没有移动平均过滤器的最后一个摆动点形成趋势。 适用于 1 分钟时间框架,捕捉日内动量走势。 使用追踪止损轻松获得 20 个点或为更大的趋势停留更长时间。 查看该指标中真正大笔交易的照片中的示例。 1 分钟的时间框架效果最好。 缩小以查看趋势。 箭头不会重新绘制或重新计算。 附加到 1 分钟的时间框架并研究交易,看看它是否可用于您的策略。 一世 规则: 买蓝色 红色出售 远离横盘整理 交易量
VolumeDayTrader
Thomas Bradley Butler
僅限股票(差價合約)的日間交易。 交易需要工作。 沒有捷徑或指標可以告訴您所有的進入和退出。 利潤來自心態。 指標是與資金管理和成功心理學結合使用的工具。 查找音量配置文件中的不平衡。 貿易價格量不平衡。 許多不平衡發生在收盤、開盤和新聞中。 查看股票中的買家與賣家。 使用 5 分鐘到 1 小時來查看誰可以控制價格並發現價格不平衡。 更大的股票是 15 分鐘及以上。 將鼠標懸停在顏色音量條上以查看過去條的數量。 當前條形圖的音量寫在右上角。 找出交易量的不平衡,看看價格在一段時間內可能走向何方。 跟隨主導趨勢以獲得最佳結果 如果趨勢發展尋找交易趨勢。 使用追踪止損並留意大量反轉不平衡。 交易 Apple、SPY、GOOLE、TESLA。 所有你最喜歡的股票
GoldBuyBackScalper
Thomas Bradley Butler
4 (1)
该指标仅适用于 XAU/USD,1 分钟图表。 每对都有独特的特征和价格走势。 使用该指标交易 V 形反转。 头皮使用追踪止损购买并避免新闻,因为它们更加极端并且可能导致突然抛售。 在回测中附加到 1 分钟的时间范围并查看反转购买。 指标从不重新绘制或重新计算。 仅在营业时间内交易 该指标仅适用于 XAU/USD,1 分钟图表。 每对都有独特的特征和价格走势。 使用该指标交易 V 形反转。 头皮使用追踪止损购买并避免新闻,因为它们更加极端并且可能导致突然抛售。 在回测中附加到 1 分钟的时间范围并查看反转购买。 指标从不重新绘制或重新计算。 仅在营业时间内交易 该指标仅适用于 XAU/USD,1 分钟图表。 每对都有独特的特征和价格走势。 使用该指标交易 V 形反转。 头皮使用追踪止损购买并避免新闻,因为它们更加极端并且可能导致突然抛售。 在回测中附加到 1 分钟的时间范围并查看反转购买。 指标从不重新绘制或重新计算。 仅在营业时间内交易
TrueSupplyandDemand
Thomas Bradley Butler
This is based on short term strength or weakness and not on moving averages.  Moving averages are used for filter only. Trade supply and demand with arrows. Supply and demand breakouts and strength of the buyers or sellers .  Don't trade buy arrow to sell arrow.  Trade the strength with trendlines or moving averages and use stops.  The arrow can have some strong moves.  Trade on all time frames.  Try it out in the back tester. The pips can be made with this indicator, follow the arrows and make
ScalpingMaster
Thomas Bradley Butler
Master scalping with this indicator.  Trade on any time frame for scalps on buy or sells.  Follow trends using a 200 moving average and stops and targets.  Use with your own system.  This indicator can give pips if following it correctly.  Stick to rules and pick up pips daily.  Use as entries in a trend, scalp for a few pips or exit on opposite signal.  Best to follow higher time frame trends. Indicator doesn't repaint or recalculate. Rules: Don't trade overnight, only trade during active sessi
DayTradeKing
Thomas Bradley Butler
This indicator is good for small time frames like 1 and 5 minutes and made for day trading. The indicator never repaints or recalculates. The indicator works is for trading swing points in day trading, following bulls or bears.  Its a simple to use, non cluttered indicator with a high success rate.  This indicator works well to capture ranges.  All indicators come with limitations and no indicator or system is always accurate. Use money management for long term trading success.   Place in backte
DTKGold
Thomas Bradley Butler
This is the DayTradeKing for gold on a 1 minute time frame.  It is a different calculation for the range. Use a 200 period moving average as a filter.  Always use stops and avoid news, wait for more conformation.  This looks to capture intraday ranges. Put it in the back tester on 1 minute to see the price action and how it works. Trade with trend Use filter Use stops Alerts are added for pop ups and sound. 
SuperArrowScalper
Thomas Bradley Butler
Trade trends with the Super Scalper Use on all time frames and assets it is  designed for scalping trends. Works good on small time frames for day trading.  The arrows are easy to follow.  This is a simple no repaint/no recalculate arrow indicator to follow trends with.  Use in conjunction with your own system or use moving averages.  Always use stops just below or above the last swing point or your own money management system The indicator comes with push notifications, sound alerts and email
Levels Trading
Thomas Bradley Butler
This indicator is a simple stripped down version of any advanced support and resistance indicator.  All the support and resistance indicators work from a number of bars that have developed over time. Get rid of clutter and confusing levels.  Find levels according to a number of bars. Look at days, session, numbers of hours, periods of consolidation.  Watch levels develop and use as breakout points, or areas of buyers and sellers.  Features and things to consider This indicator is for a frame of
ForexReversalEA
Thomas Bradley Butler
https://www.mql5.com/en/market/product/57345 该 EA 基于外汇反转指标。 如果您更喜欢手动交易系统,请下载指标并试用。 EA 将跟随趋势并相应地开仓。 结果显示具有较低回撤的稳定收益,但在回测器、优化器和时间框架中进行试验,看看什么有效。 显示的所有结果都是假设的。 注意:这不是鞅或网格。 该指标确实具有对冲能力 此 EA 具有以下功能,并根据您的风险进行更改。 EA根据可用保证金添加,根据参数买卖。 通过输入控制风险。 inp 5 是卖 inp 7 是购买 固定止损手数 固定获利   可用保证金百分比 该 EA 基于外汇反转指标。 如果您更喜欢手动交易系统,请下载指标并试用。 EA 将跟随趋势并相应地开仓。 结果显示具有较低回撤的稳定收益,但在回测器、优化器和时间框架中进行试验,看看什么有效。 显示的所有结果都是假设的。 注意:这不是鞅或网格。 该指标确实具有对冲能力 此 EA 具有以下功能,并根据您的风险进行更改。 EA根据可用保证金添加,根据参数买卖。 通过输入控制风险。 inp 5 是卖 inp 7
HFTHacker
Thomas Bradley Butler
由於優化過程的複雜性和用戶的混亂,這已經回到了簡單版本而沒有恢復 在測試和使用之前優化 EA。僅在優化後才購買。這適合那些知道如何優化並希望憑藉自身優勢獲利的交易者。 您設定您的風險參數。如果您選擇不成功的交易,則可透過停損獲得高勝率。降低長壽風險。 這適用於所有帳戶,是一個風險管理工具,請閱讀所有評論、描述和 MT5版本: https://www.mql5.com/en/market/product/74421 此智慧交易系統 (EA) 會自動執行買賣交易,同時根據交易者的帳戶餘額調整部位規模。其核心功能是動態調整交易規模,確保隨著帳戶的成長或收縮,風險與可用資本保持成比例。這有助於保持一致的交易策略,而不會在任何特定交易中過度槓桿化或風險過低。我不提供文件。透過購買和使用此 Expert Advisor (EA),您承認您已在策略測試器上徹底測試了 EA,並了解自動交易中涉及的相關風險。您進一步承認,過去的表現並不能保證未來的結果,並且使用此 EA 存在固有風險,包括潛在的投資資本損失。 設定: 輸入 int inp1_CompareCount = 0; 輸入雙精度
MarketMaker
Thomas Bradley Butler
自动化供需交易。做一个市场。 这个 EA 的制作和灵感来自于每个人都在销售和模仿的流行供需指标。 EA 继续交易和对冲,做市。也可以在非对冲账户上交易。需要评估风险并使用时间框架、手数、对冲能力。我已经在一个月左右的时间里一次断断续续地交易了多对。 系统概念: EA 交易供需水平。水平发生变化,因此 EA 将继续交易新水平。在手数较低的多对之间进行分配是系统中的一项功能。在保持稳定收益的同时,应避免大幅回撤。 SL 可以使用,但我解释的对冲方面允许这是一种选择。我在多对小手上得到的回撤是 4%,这是没有止损的。较大的地块显示为 6%。因此,较小的尺寸是保守的,而较大的则更具侵略性。这些是保持交易手数低于余额的原因。行业需要发展空间。 特征: 贸易计数 固定手数 音量上限 止损 获利
Top Trader
Thomas Bradley Butler
Top Trader Indicator This is an arrow reversal indicator. This is with deviations and arrows.  Trade a blue arrow for buy and trade a red arrow for sell.  Change the time period and the deviations of the bands.  This is similar to others but these arrows don't repaint.  Load in back tester and study which periods and deviations work the best.  It works on all time frames.  15 min to 1 hr would give good results for take profits.  Try according to your own risk management.
Quant Bot
Thomas Bradley Butler
Quant Bot 用于欧元/美元一小时时间框架内的趋势交易。 没有设置文件,但如果使用其他对,则可能需要优化。 关于机器人: 它使用基因生成并使用 ATR 进行交易。 前行期用于防止曲线拟合 EA 在每笔交易中都使用止损。 资金管理是按余额百分比放大 回溯期为 2003-2020 年,前进期为 2020-2022 年。(见图)。 Quant Bot 用于欧元/美元一小时时间框架内的趋势交易。 没有设置文件,但如果使用其他对,则可能需要优化。 关于机器人: 它使用基因生成并使用 ATR 进行交易。 前行期用于防止曲线拟合 EA 在每笔交易中都使用止损。 资金管理是按余额百分比放大 回溯期为 2003-2020 年,前进期为 2020-2022 年。(见图)。
Crypto Net
Thomas Bradley Butler
Crypto Net 用于在  BTCUSD。 它使用基因进化来进化策略。 该 EA 交易趋势遵循 ATR 和 Ichimoku 指标。 这是构建并通过了一系列强大的测试,包括 Monte Carlo 和 Walk Forward。 输入: 最低风险的账户百分比。 最大手数 停止交易的时间 没有其他任何改变。 Crypto Net 用于在 BTCUSD。 它使用基因进化来进化策略。 该 EA 交易趋势遵循 ATR 和 Ichimoku 指标。 这是构建并通过了一系列强大的测试,包括 Monte Carlo 和 Walk Forward。 输入: 最低风险的账户百分比。 最大手数 停止交易的时间 没有其他任何改变。 输入: 最低风险的账户百分比。 最大手数 停止交易的时间 没有其他任何改变。 输入: 最低风险的账户百分比。 最大手数 停止交易的时间 没有其他任何改变。
PropTrader
Thomas Bradley Butler
*使用前优化 EA* 欧元/美元优化外汇交易策略 通过专家顾问 (EA) 在一两年内获得巨额财富是一个不切实际的说法。 回测和真实交易重点关注欧元/美元货币对。 关于该策略: 这代表了我们战略的初始迭代,并有进一步发展的潜力。 经过 100% 质量数据的严格测试,没有 MT4 错误。 该策略按照趋势跟踪的逻辑原则运作。 当趋势看涨时,EA 启动并部署追踪止损,反之亦然。 本质上,这是一种简单的趋势跟踪方法。 主要优点和注意事项: 轻松设置:坚持使用默认设置,仅根据您的喜好修改批量大小。 风险管理:该策略不采用鞅或对冲。 风险缓解:每笔交易都配备了追踪止损和止盈水平,由平均真实波动幅度 (ATR) 确定,有助于更好的风险管理。 趋势识别:此方法旨在帮助交易者识别并利用更持久的趋势。 外汇交易风险免责声明: 外汇交易涉及保证金交易外币,风险较高,可能并不适合所有投资者。 过去的表现并不是未来业绩的保证。
Down Under
Thomas Bradley Butler
Down Under 在 1 小时的时间范围内交易澳元/美元对。 该 EA 交易 ATR 和 OHLC。 它在这个时间范围内为这对格式化。 复合使用分钟。 手数和最大。 批量。 余额的百分比是在获胜交易中复合的。 随着余额波动,手数也会波动。 设置: 毫米风险% 毫米批次 最大手数 没有什么可以改变的。 这没有马丁格尔或对冲能力。 唯一需要更改的其他功能是,如果您交易的是澳元/美元的差价合约。 在经纪人平台上按小数点更改。 风险免责声明 期货、期权和货币交易都有很大的潜在回报,但也有很大的潜在风险。 为了投资这些市场,您必须意识到风险并愿意接受它们。 Down Under 在 1 小时的时间范围内交易澳元/美元对。 该 EA 交易 ATR 和 OHLC。 它在这个时间范围内为这对格式化。 复合使用分钟。 手数和最大。 批量。 余额的百分比是在获胜交易中复合的。 随着余额波动,手数也会波动。 设置: 毫米风险% 毫米批次 最大手数 没有什么可以改变的。 这没有马丁格尔或对冲能力。 唯一需要更改的其他功能是,如果您交易的是澳元/美元的差价合约。 在经纪人平台
Cable Trader
Thomas Bradley Butler
GBP/USD 1hr. 该 EA 交易动量和会话。 这有一个固定的手数组成部分,并将随着它的发展继续修改 TP。 设置: 批量 没有什么可以改变的。 这没有马丁格尔或对冲能力。 唯一要更改的其他功能是,如果您交易的是英镑/美元的差价合约。 在经纪人平台上按小数点更改。 风险免责声明 期货、期权和货币交易都有很大的潜在回报,但也有很大的潜在风险。 为了投资这些市场,您必须意识到风险并愿意接受它们。 Cable Trade 在 1 小时的时间范围内交易 GBP/USD 对。 现场交易前的演示。 该 EA 交易动量和会话。 这有一个固定的手数组成部分,并将随着它的发展继续修改 TP。 设置: 批量 没有什么可以改变的。 这没有马丁格尔或对冲能力。 唯一要更改的其他功能是,如果您交易的是英镑/美元的差价合约。 在经纪人平台上按小数点更改。 风险免责声明 期货、期权和货币交易都有很大的潜在回报,但也有很大的潜在风险。 为了投资这些市场,您必须意识到风险并愿意接受它们。
Euclidean
Thomas Bradley Butler
欧几里得是我 8 年前提出的一种独特的交易算法。 该 EA 是该系统的一部分。 它作为一个封闭系统工作。 当角度正确以捕捉趋势时,EA 将启动买入。 止损是角度的10%。 就是这么简单。 输入: 手数余额百分比 1 微手 1,000 美元 获利水平 = 默认为 50 点 如何和需要考虑的事项: 止损是内置的,并根据价格以 10% 的角度进行交易。 止盈设置为 50 点,但可以是您想要的金额。 在 1 到 5 分钟的小时间范围内进行交易。 在回测器中对此进行测试的错误为零。 不同的平台和经纪人有不同的数据,因此请检查下载数据以进行测试。 外汇交易风险免责声明 欧几里得是我 8 年前提出的一种独特的交易算法。 该 EA 是该系统的一部分。 它作为一个封闭系统工作。 当角度正确以捕捉趋势时,EA 将启动买入。 止损是角度的10%。 就是这么简单。 输入: 手数余额百分比 交易量上限 = 最大手数 获利水平 = 默认为 50 点 如何和需要考虑的事项: 止损是内置的,并根据价格以 10% 的角度进行交易。 止盈设置为 50 点,但可以是您想要的金额。 在 1 到 5 分钟
Pip Scalper
Thomas Bradley Butler
每个人的指标 Pip Scalper 用于剥头皮趋势。 使用此指标更长时间地保持趋势。 它适用于所有时间框架和资产。 使用此工具获取每日点数。 使用 200 移动平均线过滤交易。 建议使用较小的时间范围。 用于日间交易。 关于和如何使用: Pips Scalper 基于长期趋势交易。 买蓝色 卖出红色 在活跃期间使用 200 移动平均线作为过滤器和交易。 Pip Scalper 用于剥头皮趋势。 使用此指标更长时间地保持趋势。 它适用于所有时间框架和资产。 使用此工具获取每日点数。 使用 200 移动平均线过滤交易。 建议使用较小的时间范围。 用于日间交易。 关于和如何使用: Pips Scalper 基于长期趋势交易。 买蓝色 卖出红色 在活跃期间使用 200 移动平均线作为过滤器和交易。
Evolved Trends
Thomas Bradley Butler
OPTIMIZE BEFORE TEST AND USE TO FIND BEST INPUTS Hey there traders! Want a cutting-edge Expert Advisor for your MT4 platform? Look no further than Evolved Trends! This powerful trading algorithm, created with machine learning technology, focuses on trading GBP/USD on 1 Hour time frames. But hey, feel free to experiment with other assets and time frames for optimization! Just customize the inputs to match your own risk tolerance. With stops based on ATR and the ability to lock in profits and cu
Combine Winner
Thomas Bradley Butler
Trade any Forex combine out there.  Many prop firms offer challenge or instant funding combines.  The biggest problem is controlling the loss.  With this indicator you can get a visual system that can limit loss and teach discipline.  This uses the MACD and the strategy is scalping.  You can determine the risk and reward.  Visually follow small trends for scalps.  Trade during active sessions.  It's just a simple system to instill discipline while limiting loss and scalping pips with the paramet
Holy Grail Arrow
Thomas Bradley Butler
Holy Grail arrow is for scalping.  The period you use will determine the trend.  You can try different time frames and periods to see what works best for your strategy.  Filters can be applied like a moving average or trendlines.  The 1 minute works good for scalps and always trade during active periods and avoid consolidation times.  Using other indicators to determine trends is recommended but this can also be a free flowing scalping system alone with tp and sl. Inputs: Period = trend period
Twenty Eight Forex Pairs
Thomas Bradley Butler
OPTIMIZE EA BEFORE TEST AND USE No EA turns hundreds into millions in a year or 2.  This is a lie if presented this way. Trade Twenty Eight Forex Pairs.  Use this EA to trade the pairs and time frames with tp and sl according to risk.  This comes with advanced money management built in.  It has break evens and take profits on 50% with sl and tp accordingly.  1 hour recommended but try on others for intraday or swing trading.
Fulltrend
Thomas Bradley Butler
Improve trading with this indicator.  Find areas of buys or sells in Fibonacci retracement areas.  Fulltrend is for scalping and making swing trades.  Fib levels are added for take profits and stop losses. This works on any time frame and can be used by itself or together with other systems and indicators for filters. The indicator doesn't repaint.  Alerts are added and can be true or false.  No need to sit glued to the computer, just set on charts and listen or the alerts to come.  Take a posi
Scalping Code
Thomas Bradley Butler
Scalping Code is for trend scalping.  It is simple to use and is profitable.  It can work on any time frame and any asset.  This indicator can be used on it's own or together with another system.  The arrow does not repaint or recalculate.   The rules are as follows:   A blue arrow above the moving average is a buy. An exit for the buy above the moving average is a red arrow or target. A red arrow below the moving average is a sell. An exit for the red below the moving average is a blue arrow
Order Flow Volume
Thomas Bradley Butler
OPTIMIZE BEFORE BACKTEST AND USE FOR A YEAR TO FIND BEST VALUES Order Flow is unique in that is trades the volume.  It was built on EUR/USD and is optimized from  11/11/2021 to 10/24/2022 on 1 hour charts.  Optimization inputs for money management are used.  This EA uses strict money management, it is not a get rich quick martingale or EA without a sl. Trading is about risk management, not gambling.   Run on EUR/USD 1 hour chart or if you want to find other assets and time frames to optimize th
AI Signal
Thomas Bradley Butler
AI Signal is an indicator that is a ready to made scalping system that doesn't repaint Instructions: Load indicator.  Use arrows as entries in trends and stay out of sideways markets.  Trade with the larger trend and trade only active volatile hours Buy blue arrow above yellow and exit at red arrow or at discretion.  Sell red arrow below yellow and exit at blue arrow  or at discretion.  Easy to follow and is based on trends.  The indicator works on all time frames and assets. Use at your own d
筛选:
无评论
回复评论
版本 2.0 2023.07.13
added support and resistance lines for the profile