Limit Map AM
- 指标
- Andriy Matviyevs'kyy
- 版本: 26.1
- 更新: 26 九月 2023
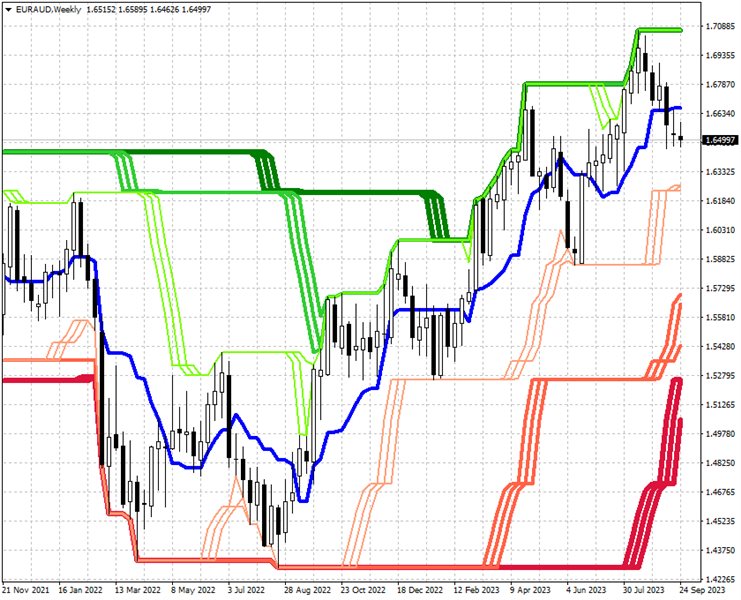
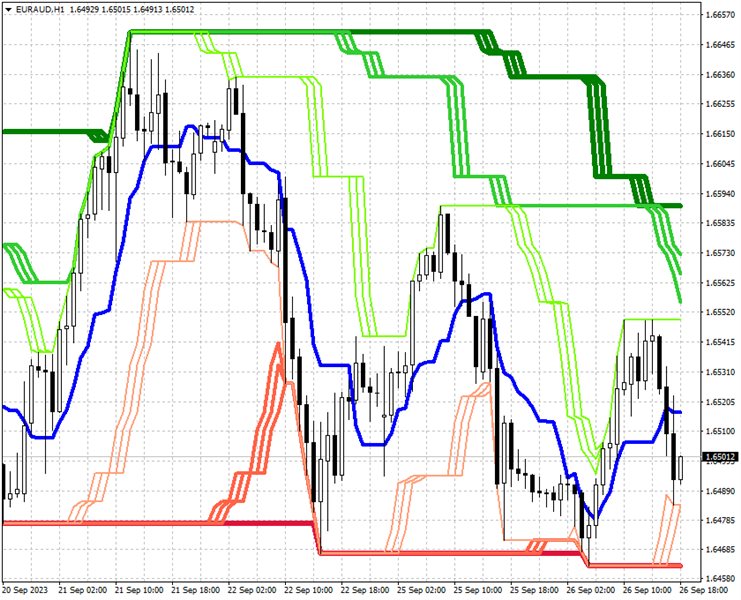
This indicator is a system of channels based on the minimum and maximum price values.
The task of the indicator is to visualize the trend direction and support/resistance lines.
The indicator is designed to be used in combination with indicators of the "Signal" or "Candles" series (a lot of free indicators of this type can be found on my page).
At the same time, the indicator can be used independently according to the following rules:
- Buy/Sell signals are used to open a position only in the direction of the trend;
- Signals to buy/sell against the trend are used only to close positions;
- The signal is confirmed when the price breaks the high/low of the bar on which the signal was given;
- The closing price is above the center line (the previous closing price is below the center line) - a buy signal;
- The closing price is below the center line (the previous closing price is above the center line) - a sell signal;
- The maximum price is above the resistance line for the previous period (in the previous period, the maximum price was below the resistance line) - a buy signal;
- The minimum price is below the support line for the previous period (in the previous period, the minimum price was above the support line) - a sell signal;
- The maximum price is below the resistance line for the previous period (in the previous period, the maximum price was equal to the resistance line) - a sell signal;
- The minimum price is above the support line for the previous period (in the previous period, the minimum price was equal to the support line) - a buy signal;
