• 概述
  • 评论
  • 评论
  • 新特性

MarketMagnet

Are you ready to take your trading journey to new heights? Look no further than MarketMagnet, this groundbreaking indicator designed to propel your trading success with excitement and accuracy. Powered by the convergence of Momentum and CCI (Commodity Channel Index), MarketMagnet equips traders with the ultimate tool to determine direction and entry prices for a wide range of recommended currency pairs and instruments. It is designed for traders seeking to scalp for a few pips on lower timeframes to hundreds of pips on higher timeframes. If you are a beginner, an intermediate level trader who is having issues with consistency and strategy hunting or a professional who seeks to discover another trading edge then this indicator is for you.

Advantages:

  1. Early Entries: MarketMagnet stands out by providing traders with early entry opportunities. By leveraging the combined power of Momentum and CCI, this indicator allows you to spot potential trades at the inception of a trend, continuation of a trends, entry into pull-backs and enabling you to seize opportunities before the crowd.

  2. Precision and Accuracy: MarketMagnet's methodology incorporates rigorous analysis and complex algorithms, providing traders with reliable signals that yield precise entry position. With its robust design, this indicator helps eliminate guesswork and enhances trading decisions with a scientific edge.

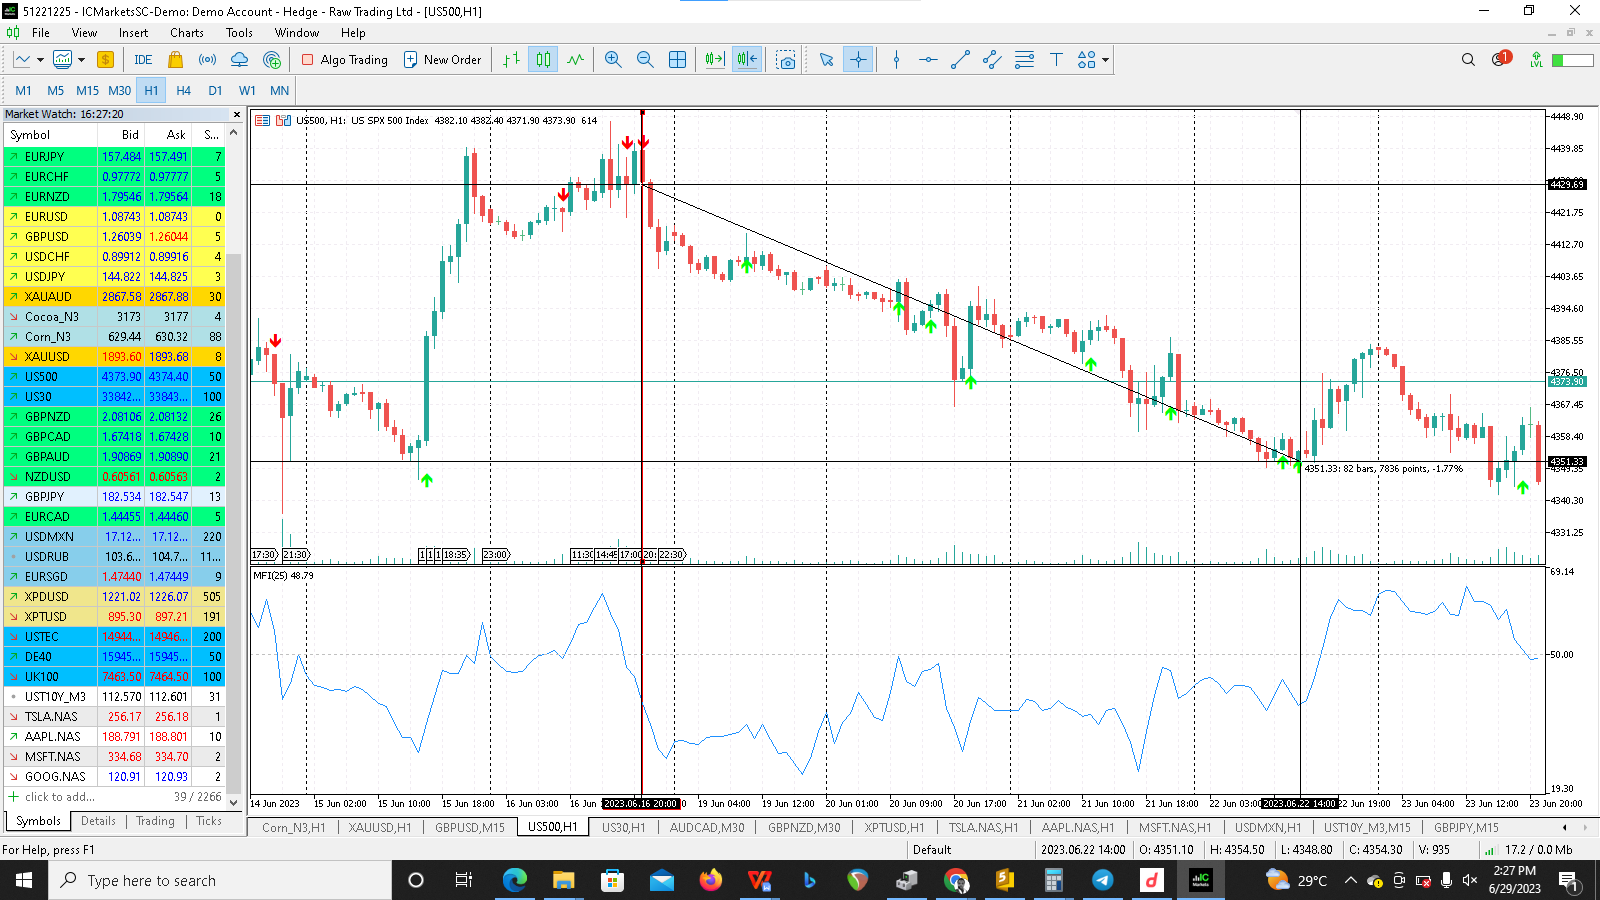
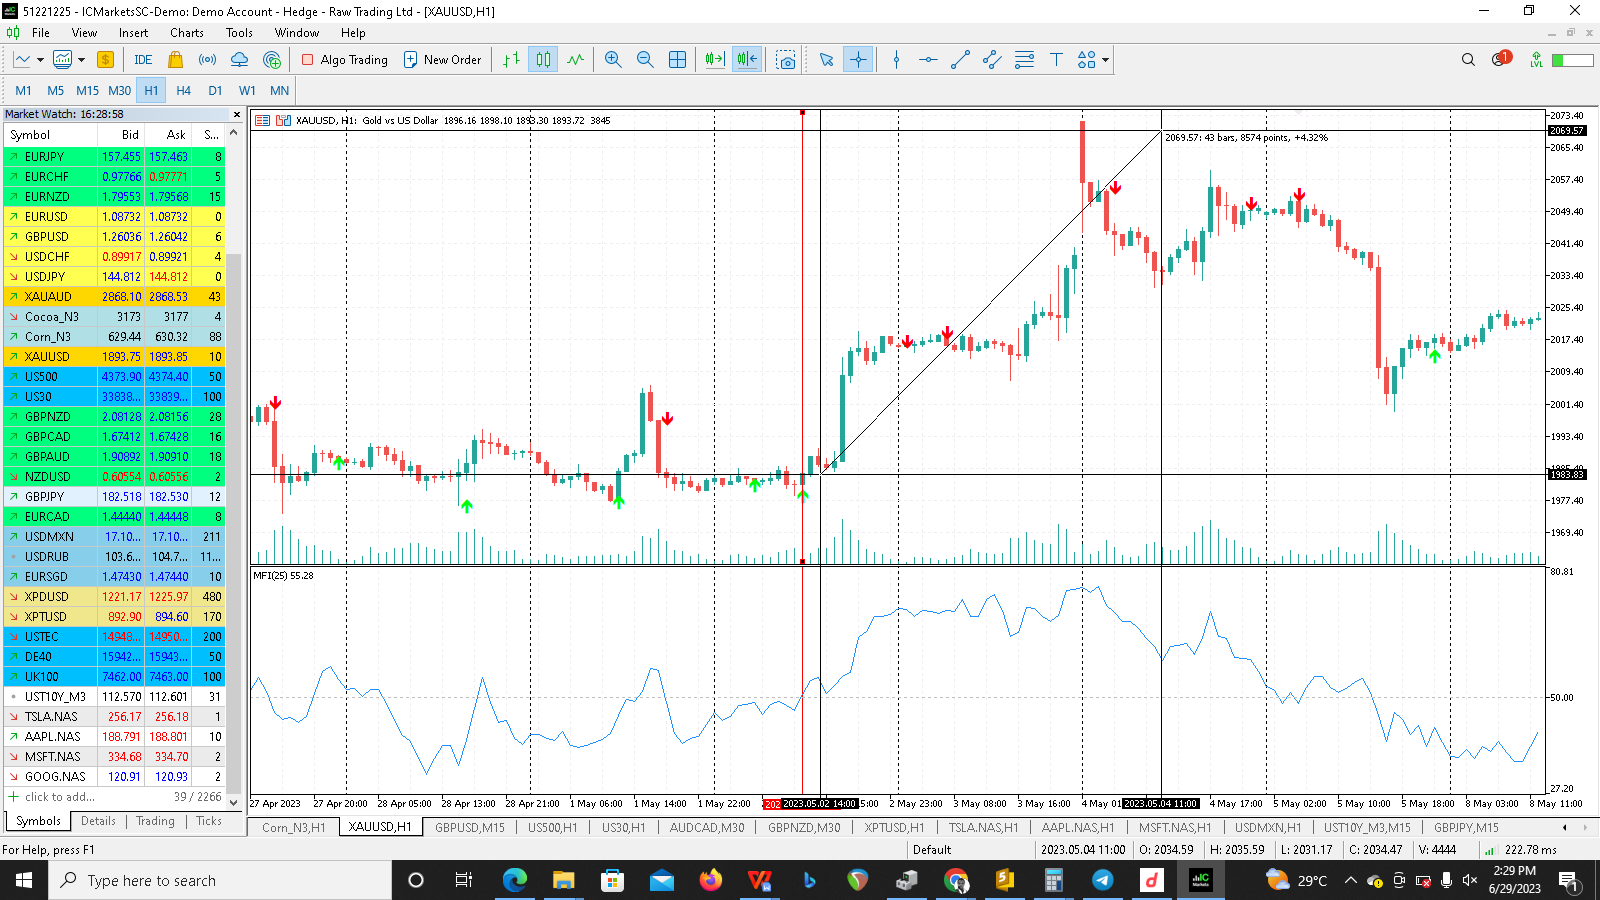
  3. Diversified Opportunities: MarketMagnet is not limited to a single currency pair or market segment. It caters to the needs of both forex and stock traders, offering recommended pairs such as GBPUSD, XAUUSD, Dow Jones, S&P500, and even popular stocks like TSLA. This versatility allows you to explore various markets and maximize your profit potential.

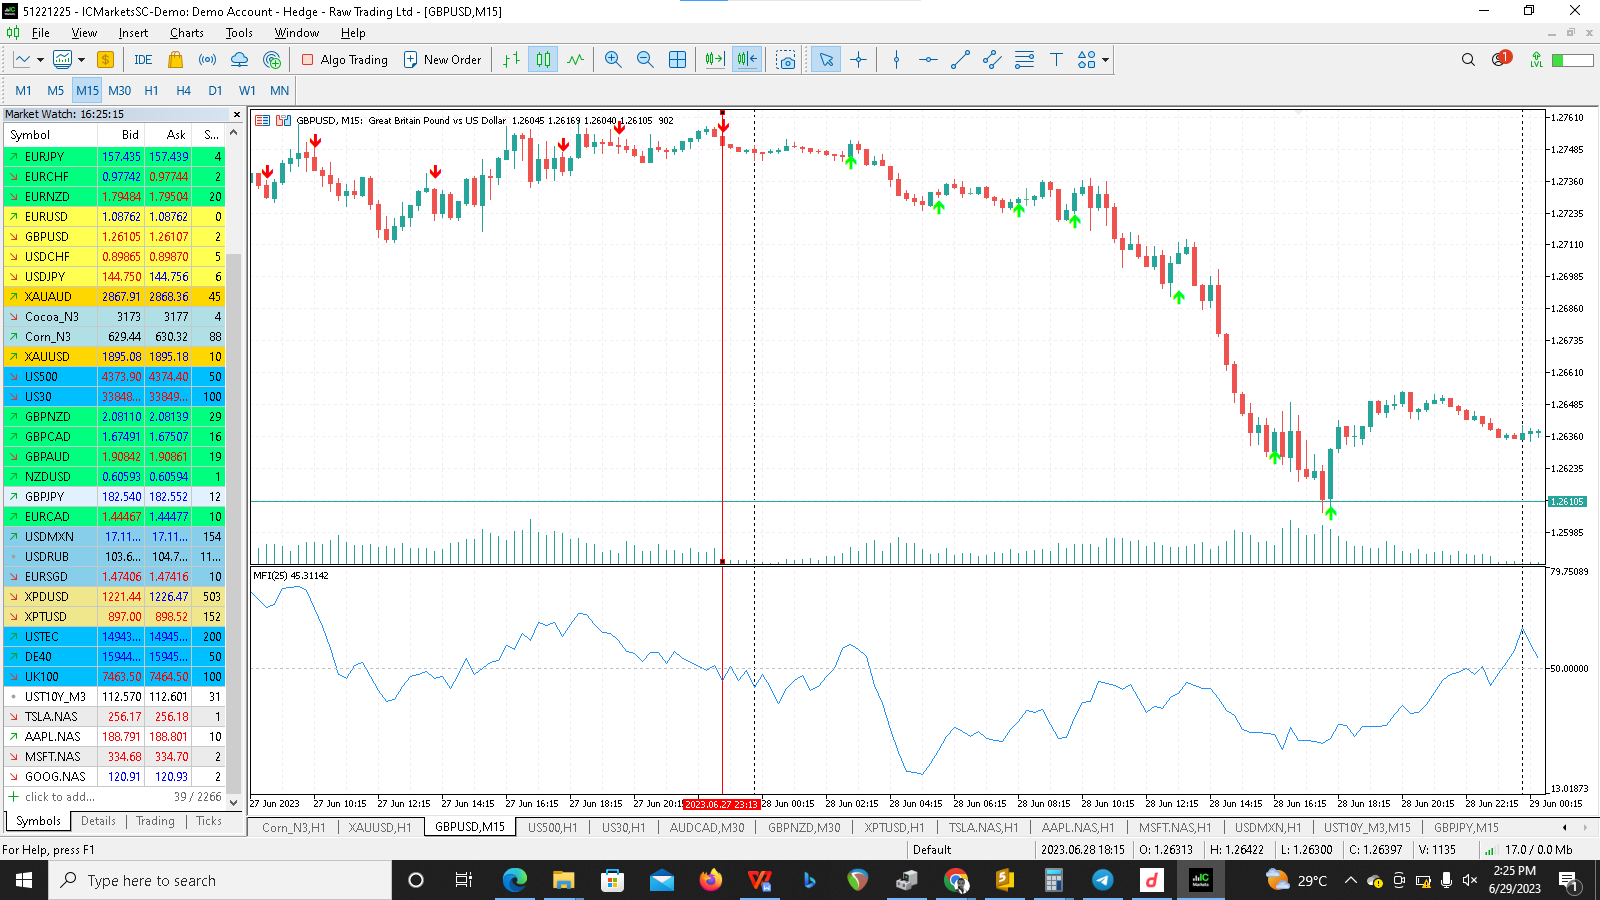
  4. Streamlined Decision-Making: With MarketMagnet, traders can make informed decisions efficiently. The indicator's user-friendly interface simplifies complex data into clear and actionable signals, empowering you to navigate the market with confidence and agility. It is as simple as placing a buy when there is an arrow up and placing a sell order when the arrow down appears on your chart.

  5. Tailored Time Frames: MarketMagnet adapts to your trading style and preferences by offering flexibility in time frames. Whether you prefer shorter time frames for quick trades or longer time frames for comprehensive analysis, this indicator has you covered, allowing you to optimize your strategies based on your preferred trading horizon.

Disadvantages:

  1. Early Entry Fake-Outs: While MarketMagnet excels at identifying early entry points, it is important to acknowledge the possibility of fake-outs. Due to the volatile nature of the market, early entries may sometimes result in false signals. Traders must exercise caution and employ appropriate risk management strategies to mitigate potential losses. In order to reduce fake-outs and false signals please read till last paragraph (It is crucial).

  2. Learning Curve: MarketMagnet is a sophisticated indicator that requires traders to familiarize themselves with its methodology and interpretation. As with any powerful tool, it may take some time to grasp the intricacies and harness its full potential. However, with discipline, you will have a solid understanding of the indicator and its filter then the rewards can be substantial.

To better understand the capabilities and intricacies of MarketMagnet, let's explore some frequently asked questions (FAQs):

  1. How does MarketMagnet identify the convergence of Momentum and CCI? This indicator weighs the momentum of the price in either direction and confirms the influence the price has in relation to the timeframe to determine the direction of the price and whether or not the perceived momentum has the required volume to reverse or continue a trend.    
  2. What specific parameters does the indicator utilize to generate signals? Velocity/Price, Momentume/Volume.
  3. Can I customize the indicator's settings based on my trading preferences? Certainly, however, we advice the user to consider changing timeframes of the instrument rather than modifying the settings or overfitting it to a particular trading conditions.
  4. How often does MarketMagnet generate signals? Are they time-sensitive? It all depends on the chosen timeframe. M5 will produce more signals for shorter trends while higher timeframes would produce less signals. NB: Not all signals generated by the indicator is tradeable without consulting the filter as indicated below. 
  5. Can I use MarketMagnet as a standalone tool, or should I combine it with other indicators? We have recommended a filter to enable users enjoy the most benefit of the indicator. More updates may help reduce its dependency on other filters.
  6. Does MarketMagnet provide any exit signals or guidance for trade management? No. That decision is solely the responsibility of the end user. However, we may make suggestions on and exit strategies especially for traders who prefer to trade on lower timeframes. 
  7. Are there any specific trade management strategies or recommendations associated with MarketMagnet? No. MarketMagnet only gives entry signals. The confirmation of those entries is the responsibility of the trader, the management and exit of those trades are essentially the responsibility of the trader.
  8. How can I effectively use MarketMagnet in different market conditions, such as trending or ranging markets? MarketMagnet works in both trending and ranging market conditions. It shines during a trend especially when used with its recommended filter.
  9. Can I backtest MarketMagnet's performance to assess its historical accuracy? Yes.
  10. Does MarketMagnet offer any additional features or support, such as user forums or educational resources? Yes, we usually respond to private messages in a few minutes. Except of weekends and public holidays.

In order to make the most of MarketMagnet, you need to use a filter and the only indicator we recommend is a Money Flow Index which is a volume indicator. The following is the settings for the Money Flow Indicator (MFA).


Parameters Tab: 

Period: 25

Volume: Tick


Levels Tab: 

Level: 50


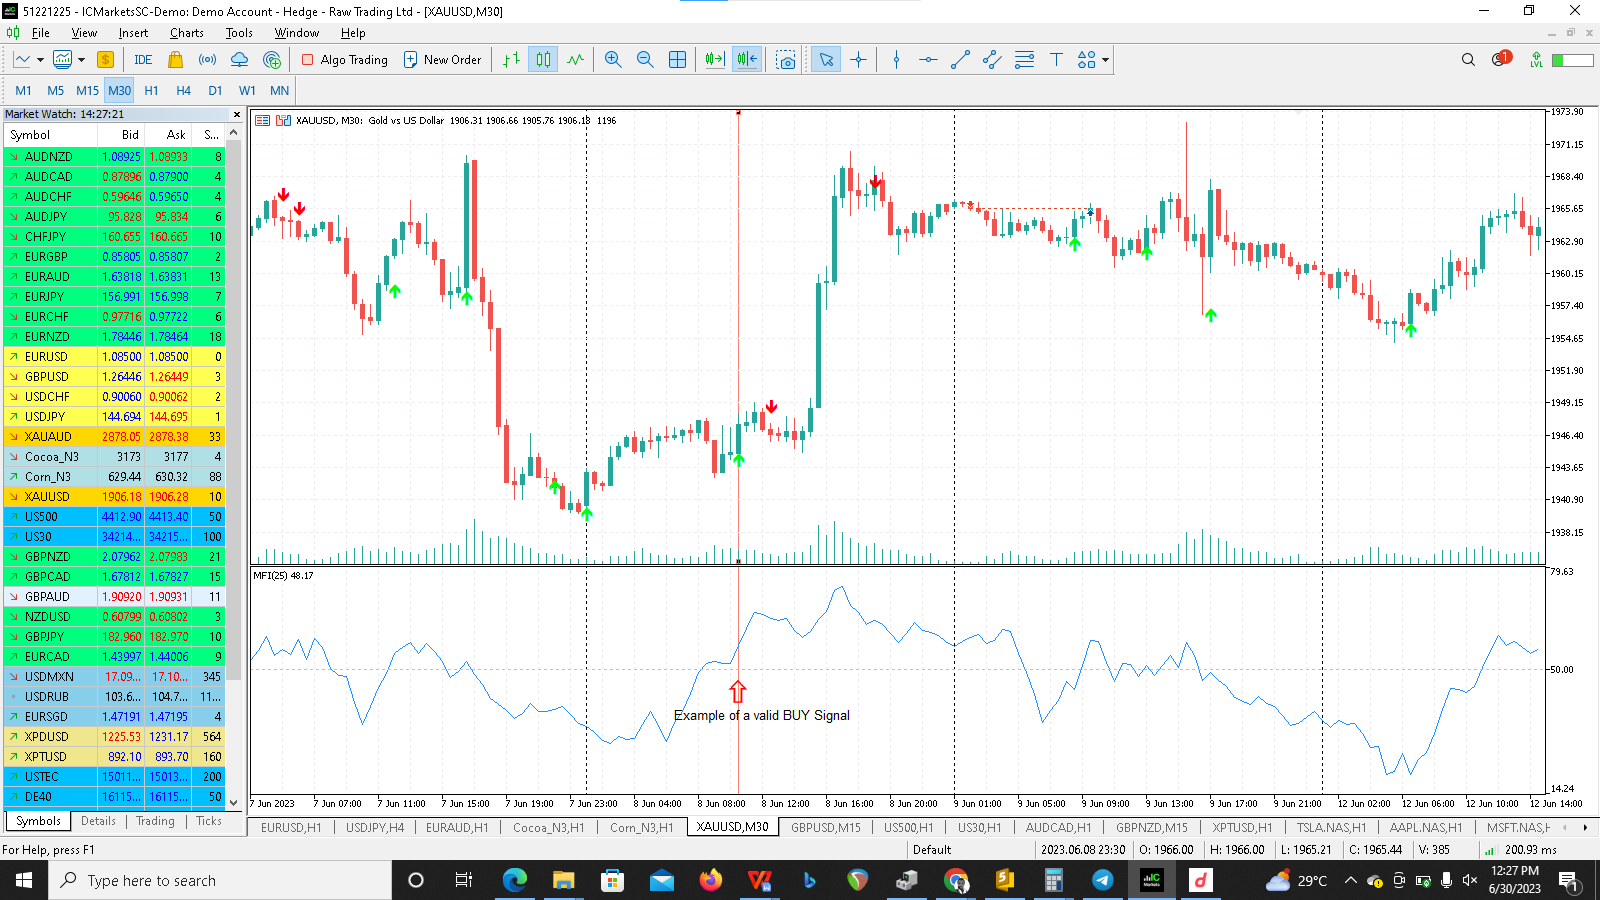
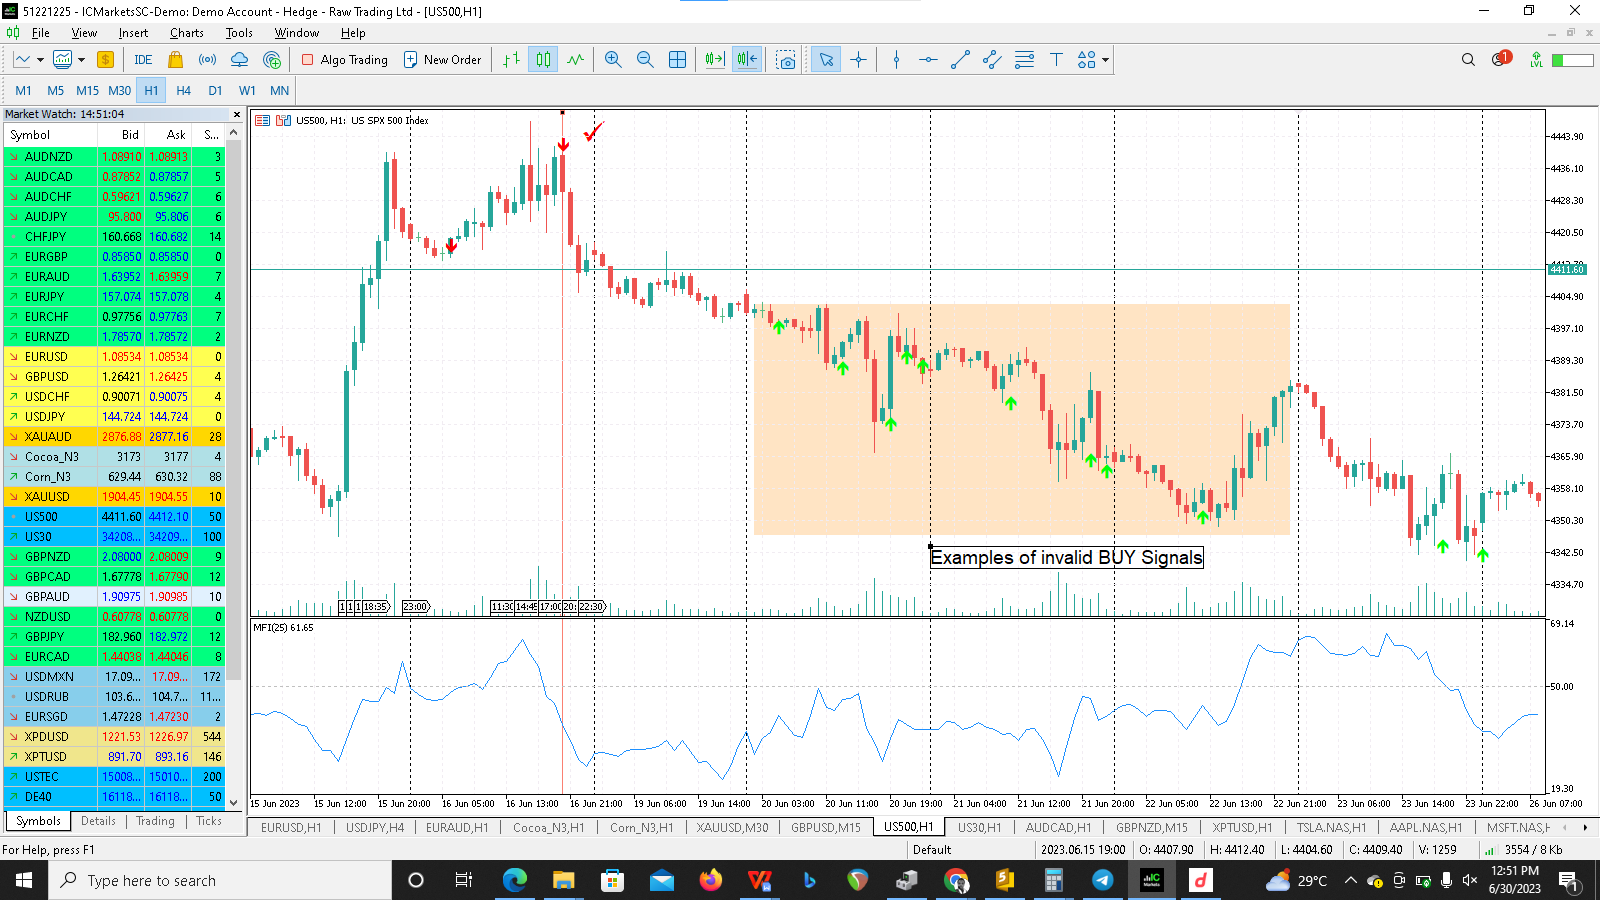
For a BUY Signal wait for the MarketMagnet to display an arrow up. Now, you will have to confirm that the Money Flow Index indicator is above 50. If the conditions are true, place a BUY trade.

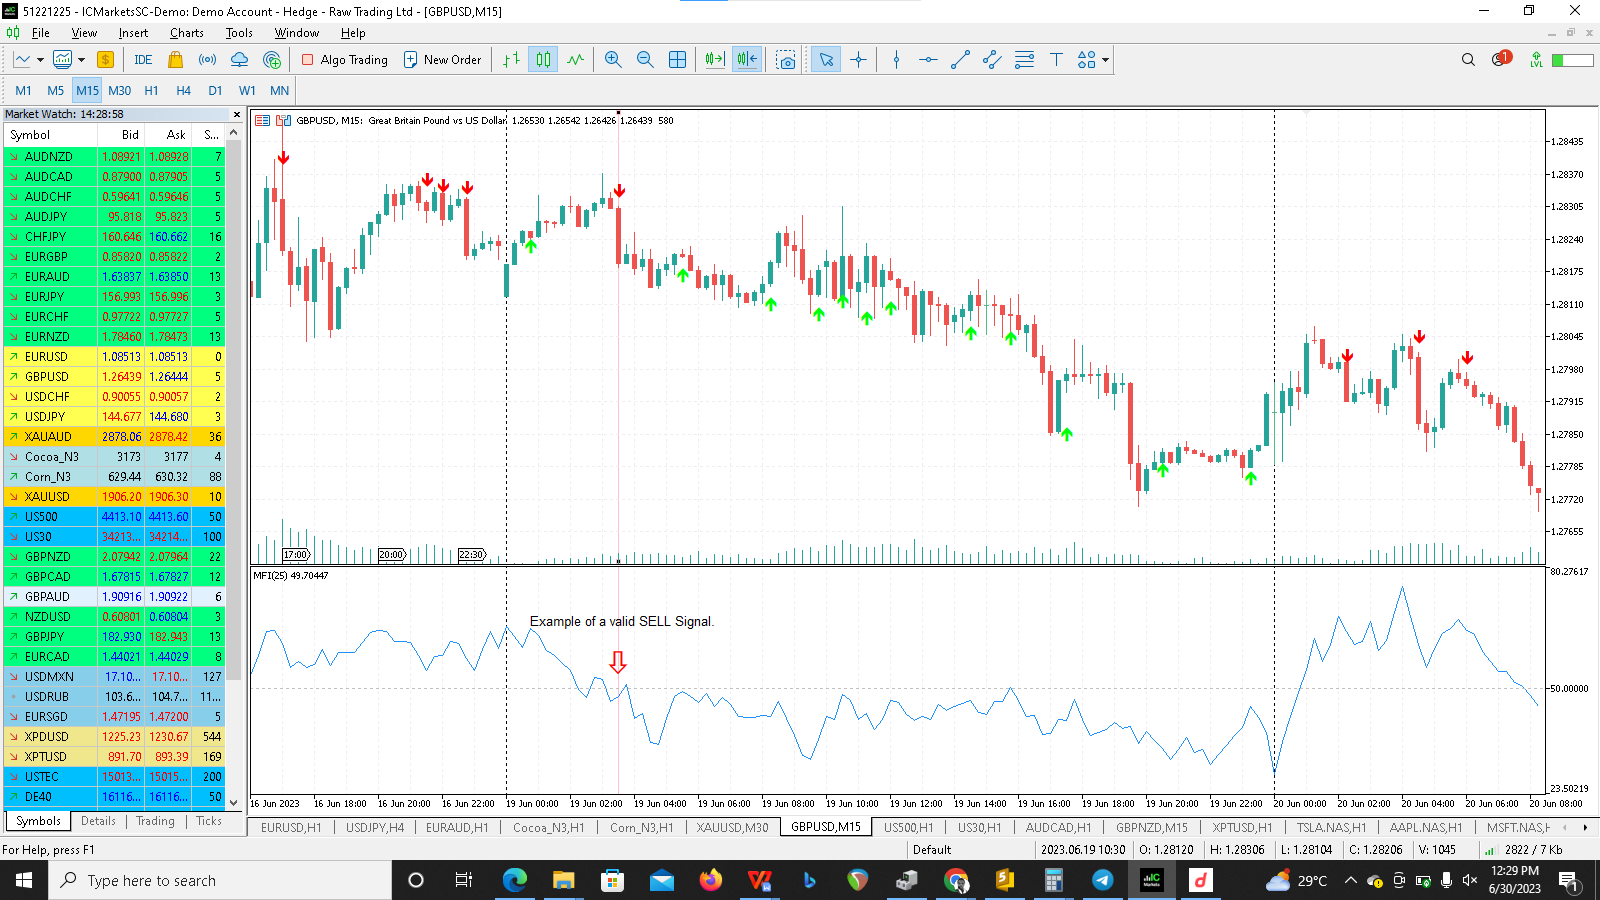
For a SELL Signal wait for the MarketMagnet to display an arrow down. You will also have to confirm that the Money Flow Index Indicator is below 50. If the conditions are true, place a SELL Trade.


With MarketMagnet, you have the opportunity to unlock a world of profit potential. Even though this indicator was designed for scalping the trend, it could also lead to longer trends. This groundbreaking indicator combines the power of Momentum and CCI, providing you with early entries, precision, and versatility across multiple currency pairs and instruments. Harnessing the power of MarketMagnet, you can navigate the dynamic world of trading with confidence, excitement, and the potential for exceptional returns. Are you ready to embark on this thrilling journey and revolutionize your trading experience? The choice is yours – seize the power of MarketMagnet today!

推荐产品
Limitless MT5
Dmitriy Kashevich
Limitless MT5 is a universal indicator suitable for every beginner and experienced trader. works on all currency pairs, cryptocurrencies, raw stocks Limitless MT5 - already configured and does not require additional configuration And now the main thing Why Limitless MT5? 1 complete lack of redrawing 2 two years of testing by the best specialists in trading 3 the accuracy of correct signals exceeds 80% 4 performed well in trading during news releases Trading rules 1 buy signa
Trend Catcher with Alert MT5
Issam Kassas
4.63 (78)
趋势捕捉器: 具有警示指标的趋势捕捉器策略是一种多功能的技术分析工具,可帮助交易员识别市场趋势和潜在的进出点。它采用动态趋势捕捉器策略,根据市场条件进行调整,清晰地呈现趋势方向。交易员可以自定义参数,以符合其偏好和风险容忍度。该指标有助于识别趋势,发出潜在的反转信号,充当跟踪止损机制,并提供实时警报,以便及时应对市场。 具有警示指标的趋势捕捉器策略是一种多功能的技术分析工具,可帮助交易员识别市场趋势和潜在的进出点。它采用动态趋势捕捉器策略,根据市场条件进行调整,清晰地呈现趋势方向。交易员可以自定义参数,以符合其偏好和风险容忍度。该指标有助于识别趋势,发出潜在的反转信号,充当跟踪止损机制,并提供实时警报,以便及时应对市场。 特点: 趋势识别:信号牛市趋势和熊市趋势。 趋势反转:当蜡烛颜色从牛市变为熊市,反之亦然时,提醒可能的反转。 实时警报:为新趋势识别生成警报。 建议: 货币和货币对:EURUSD,AUDUSD,XAUUSD... 时间框架:H1。 账户类型:任何ECN,低点差账户。
FREE
Free automatic Fibonacci is an indicator that automatically plots a Fibonacci retracement based on the number of bars you select on the BarsToScan setting in the indicator. The Fibonacci is automatically updated in real time as new highest and lowest values appears amongst the selected bars. You can select which level values to be displayed in the indicator settings. You can also select the color of the levels thus enabling the trader to be able to attach the indicator several times with differe
FREE
Divergence Detection: The indicator is designed to identify divergences between the price movement and the Stochastics oscillator. This can help traders spot potential trend reversals or trend continuation opportunities. Early Warning System: By capturing divergences, the Stochastics Divergence Indicator can provide an early warning of possible market turning points. This allows traders to take timely action and make informed decisions. Versatility: The indicator can be applied to various finan
X3 Trend Arrow
Brendan Chinwedu Eze
由於經紀公司的技術和邏輯操作,我花了很長時間才推出了這個後方指標,它結合了具有以下功能的眾多策略: 市場趨勢識別:了解市場的整體趨勢。 反轉點:辨識市場可能改變方向的潛在點。 進入和退出點:確定進入和退出交易的最佳時間。 若要全面了解如何使用該指標,請觀看隨附的影片。此外,下載提供的指標以進行完整分析。 ------------------------------------------------------------------------ https://www.mql5.com/en/market/product/92909 AND https://www.mql5.com/en/market/product/109519  
SYSTEM INTRODUCTION:   The Binary Options Conqueror System Is Specifically Designed For Binary Options Trading. Unlike Other Systems And Indicators That Were Adopted From Other Trading Environments For Binary Options. Little Wonder Why Many Of Such Systems Fail To Make Money . Many End Up Loosing Money For Their Users.     Forward Testing Of The System Has Shown Remarkable Results . The Results Of Forward Testing On Live Trading Account Is Consistent With The Results Obtained By Back Testing .
WanaScalper
Isaac Wanasolo
1 (1)
A scalping indicator based on mathematical patterns, which on average gives signals with relatively small SL, and also occasionally helps to catch big moves in the markets (more information in the video) This indicator has three main types of notifications: The first type warns of a possible/upcoming signal on the next bar The second type indicates the presence of a ready signal to enter the market/open a position The third type is for SL and TP levels - you will be notified every time price r
可以说,这是您可以为MetaTrader平台找到的最完整的谐波价格形成自动识别指标。它检测19种不同的模式,像您一样认真对待斐波那契投影,显示潜在的反转区域(PRZ),并找到合适的止损和获利水平。 [ 安装指南 | 更新指南 | 故障排除 | 常见问题 | 所有产品 ] 它检测19种不同的谐波价格形态 它绘制了主要,衍生和互补的斐波那契投影(PRZ) 它评估过去的价格走势并显示每个过去的形态 该指标分析其自身的质量和性能 它显示合适的止损和获利水平 它使用突破来表明合适的交易 它在图表上绘制所有样式比率 它实现了电子邮件/声音/视觉警报 受斯科特·M·卡尼(Scott M. Carney)的书的启发,该指标旨在满足最纯粹和最熟练的交易者的需求。但是,它采取了一种使交易更容易的方式:在向交易发出信号之前,它会等待Donchian朝正确方向突破,从而使交易信号非常可靠。 斐波那契投影与向量无关 它实现了电子邮件/声音/推送警报 它绘制了ABCD投影 重要提示: 为了符合 Scott M. Carney先生 的商标申诉,某些图案名称已重命名为不言自明的替代方式, Scot
The Plasma Trend indicator is a simple technical indication that is used to determine the current trend direction in the market. The Plasma Trend indicator is a powerful tool for determining the direction of the trend in the Forex market. It is based on both standard technical indicators and proprietary mathematical calculations, which provides a more accurate and reliable trend determination. Its implementation in the form of lines of two colors simplifies the visual determination of a change
How to use Pair Trading Station Pair Trading Station is recommended for H1 time frame and you can use it for any currency pairs. To generate buy and sell signal, follow few steps below to apply Pair Trading Station to your MetaTrader terminal. When you load Pair Trading Station on your chart, Pair Trading station will assess available historical data in your MetaTrader platforms for each currency pair. On your chart, the amount of historical data available will be displayed for each currency pai
This indicator uses support and resistance, volume and some special formula to calculate the volume to filter the candles. If the volume reaches a specific value, And at the same time, Candle breaks the support/resistance line, There would be a signal and we can enter the market. Signals appear when the current candle closes. then you can enter the trade when a new candle appears. Please don't forget to follow your money management plan. MT4 Version Support/Resistance Breakout MT4 :   https
Make Sure to Read the Description! UT Bot Plus contains free EA! The EA can be downloaded from telegram channel:  https://t.me/ +NSOJTvH39fNhZmU0 Unlock the Power of Automated Trading with UT BOT Indicator, Integrated with a FREE EA! ( Limited time offer ) This version has been expanded to include multiple additional filtering options. These options are fully configurable and can be switched on and off. This versatile UT BOT indicator is crafted and optimized to work seamlessly with the
Smooth price for Monarch
Konstantin Gruzdev
5 (1)
The Smooth Price technical indicator is used for plotting a smoothed line as close to the price of the financial instrument as possible, and serves to eliminate its noise components. The indicator is part of the Monarch trading system, but here it is presented as an independent technical analysis tool. The indicator is based on the cluster digital filter , which, unlike the ClusterSMA , is applied directly to the price time series. Smooth Price does not redraw (except the very last, zero bar) an
ATrend
Zaha Feiz
4.5 (2)
ATREND: 工作原理及使用方法 工作原理 “ATREND”指标针对MT5平台设计,旨在通过结合多种技术分析方法为交易者提供强有力的买卖信号。该指标主要利用平均真实波幅(ATR)来测量波动性,并结合趋势检测算法来识别潜在的市场动向。 购买后请留言,您将获得特别的赠品。 剩余8份,售价39美元。 主要特点: - 动态趋势检测:该指标评估市场趋势并相应调整信号,帮助交易者与当前市场条件对齐策略。 - 波动性测量:通过使用ATR,该指标衡量市场波动性,这对于确定最佳止损(SL)和止盈(TP)水平至关重要。 - 信号可视化:该指标在图表上直观地表示买卖信号,增强交易者的决策能力。 操作步骤 输入和设置: - 时间框架:此输入允许您设置指标计算的主要时间框架,默认值为15分钟。 - 时间框架2:此输入可用于定义额外分析的辅助时间框架,默认值为1分钟。 - 移动:此参数允许您将指标的计算向回移动,默认值为0。 - SLATR:此输入定义用于根据ATR计算止损水平的乘数,默认值为2.56。 - TPATR:此输入定义用于根据ATR计算止盈水平的乘数,默认值也为2.56。 - Alerts
Cycles Forecast
Pooriya Alirezaee
This indicator is based on a mathematical formula and an ANN combined, designed to make a model(using previous prices) of the most recent market condition (any chart*) in order to use the model as a forecasting tool. *This indicator can operate on any chart/timeframe, but it's suggested you use multiple timeframes for each trade because this method relies solely on the time factor, you can not use this indicator to predict price volatility, but if it's fit correctly it will show you when the nex
Naked Forex Kangaroo Tail Indicator Kangaroo Tail Indicator is a pattern recognition indicator for Forex, Stocks, Indices, Futures, Commodities and Cryptos. The Kangaroo Tail is a multi-bar pattern. The Kangaroo Tail pattern is very effective and is very simple to trade. The strategy that comes with the Kangaroo Tail is based on price action. The indicator does what it was designed for: displaying Kangaroo Tail patterns.   Don't expect to follow the up and down arrows and make money . Tr
TSO Fibonacci Chains MT5
Dionisis Nikolopoulos
Fibonacci retracement is a method of technical analysis for determining support and resistance levels. The TSO Fibonacci Chains Indicator is different from a simple Fibonacci Retracements indicator in that it provides the targets for each retracement level. In other words, there is an Extension Level (D) for every Retracement Level (C). In addition, if an Extension Level is reached, then a new Fibonacci setup is created automatically. These consecutive Fibonacci setups create a chain that reveal
Candle EA MT5
Mansour Babasafary
4.38 (45)
This expert is based on patterns The main patterns of this specialist are candlestick patterns Detects trends with candlestick patterns It has a profit limit and a loss limit, so it has a low risk The best time frame to use this expert is M30 time frame The best currency pairs to use with this expert is the EURUSD, GBPUSD, AUDUSD, USDCAD currency pairs Attributes: Can be used in the EURUSD, GBPUSD, AUDUSD, USDCAD  currency pairs Can be used in M30, H1, H4 time frames Has profit limit an
Hello There, Today I want to show you my new researchable fore BUY SELL indicator, it work all asset, and also work Derive Volatility asset! it work all time frame, but i recommend start 5 minute to H1 when you receive a signal just take trade and stay wait for your take profit asset All Major Pair And minor IT WORK ALSO XAUUSD Fantastic results,  for more info,,, message us thank you   
Liquidity Oscillator
Paolo Scopazzo
5 (1)
A powerful oscillator that provide Buy and Sell signals by calculating the investor liquidity. The more liquidity the more buy possibilities. The less liquidity the more sell possibilities. Please download the demo and run a backtest! HOW IT WORKS: The oscillator will put buy and sell arrow on the chart in runtime only . Top value is 95 to 100 -> Investors are ready to buy and you should follow. Bottom value is 5 to 0 -> Investors are ready to sell and you should follow. Alert + sound will app
该指标找到AB = CD回撤形态。 AB = CD回调模式是一种4点价格结构,其中初始价格区间被部分回调,然后与回调完成后等距移动,这是所有谐波模式的基本基础。 [ 安装指南 | 更新指南 | 故障排除 | 常见问题 | 所有产品 ] 可定制的图案尺寸 可定制的AC和BD比率 可定制的突破时间 可定制的线条,颜色和大小 它根据CD纤维水平显示SL和TP水平 视觉/声音/推送/邮件警报,用于模式和突破 AB = CD Retracements可以扩展和重新绘制很多内容。为了使事情变得更容易,该指标实施了一个转折:它在向交易发出信号之前等待正确方向的Donchian突破。最终结果是带有非常可靠的交易信号的重新粉刷指示器。输入donchian突破时段作为输入。 看涨回撤是蓝色的 空头回撤是红色的 请注意,价格模式(例如AB = CD)可以扩展,指标必须重新绘制以跟随该模式的扩展。如果图案重涂超出了参数中输入的AC / BD / AB = CD比率,则该图案将消失,因为它将不再有效。要交易这些模式,请求助于donchian突破信号。 输入参数 幅度:AB = C
SYSTEM INTRODUCTION:   The Binary Options Momentum System Is Specifically Designed For Binary Options Trading. Unlike Other Systems And Indicators That Were Adopted From Other Trading Environments For Binary Options. Little Wonder Why Many Of Such Systems Fail To Make Money . Many End Up Loosing Money For Their Users.  A Very Important Fact That Must Be Noted Is The Fact That Application Of Martingale Is not Required. Thus Making It Safer For Traders Usage And Profitability. A Trader Can Use Fi
PZ Trend Trading MT5
PZ TRADING SLU
3.67 (3)
许多盈利交易者不仅知道如何识别市场趋势,而且也能把握趋势建立后的交易机会。 Pz 趋势交易 指标设计用来在趋势行情中尽可能的赚取利润。 已建立的趋势提供了一揽子交易机会,但大多数趋势交易指标完全忽视了它们,让交易者在趋势行情时完全不知道该如何做!一般趋势指标只通知有关的趋势变化,但根本不足以得到卓越的回报. Pz 趋势交易 指标比一般趋势指标显示多达 20 倍的交易 , 因为它注重所谓的市场时机。它不仅显示当前的市场趋势,也有回调,内柱线的突破和调整。它令您在趋势回调之后介入,安全的柱线内突破金字塔加仓,以及发现潜在的反转,和已知的调整。 趋势改变 一个趋势改变在市场方向变化时发生。趋势变化在图表上用带数字的彩色圆圈显示。蓝色 (1) 信号为上涨开始, 而红色 (1) 信号为下跌开始。趋势变化并非评估当前价格动作的结果, 它意味着交易设置是不定时地。如果您正确使用本指标, 在趋势变化时, 您将将已经入场 (参看下面的调整)。 回调 但凡趋势在运动中,行情上下抖动,盈利者收割利润,且其它参与者入场。趋势回调代表好的买入机会,通常是由主力获利离场导致。如果行情在回调后回归上行, 指
Atomic Analyst MT5
Issam Kassas
4.6 (20)
首先值得强调的是,该交易指标是非重绘、非延迟的指标,这使其成为手动和机器人交易的理想选择。 用户手册:设置、输入和策略。 Atomic Analyst是一种PA价格行动指标,利用价格的力量和动量来寻找市场上更好的机会。配备了高级过滤器,可帮助去除噪音和假信号,并提高交易潜力。使用多层复杂的指标,Atomic Analyst扫描图表,并将复杂的数学计算转化为任何初学者都能理解并用来做出一致交易决策的简单信号和颜色。 “Atomic Analyst”是专为新手和经验丰富的交易者量身定制的综合交易解决方案。它将高级指标和一流功能融合为一体的交易策略,使其成为所有类型交易者的多功能选择。 日内交易和剥头皮策略:专为快速准确的日内交易和短期交易而设计。 日内和摆动交易策略:可用作追求价格大幅波动的日内和摆动交易者的可靠工具。 多货币和市场:凭借其可靠的精度,在不同的工具和市场上运作。 多个时间框架:可在多个时间框架上使用,性能良好。 稳定性:所有指标均不重绘、不重绘和不滞后,确保可靠的信号。 信号清晰度:提供箭头信号,用于清晰的入场和出场点。 实时警报:通过交易入场、SL和TP警报通知交
HandleTrend
Kirill Subot
Trend indicator, a revolutionary unique solution for trend trading and filtering with all important trend features built into one tool! This is a 100% non-repainting multi-timeframe and multi-currency indicator that can be used on all currency pairs. HandleTrend is an effective trend following indicator that gives trend signals in the form of arrows on the chart.
PipFinite Exit EDGE MT5
Karlo Wilson Vendiola
4.89 (37)
Did You Have A Profitable Trade But Suddenly Reversed? In a solid strategy, exiting a trade is equally important as entering. Exit EDGE helps maximize your current trade profit and avoid turning winning trades to losers. Never Miss An Exit Signal Again Monitor all pairs and timeframes in just 1 chart www.mql5.com/en/blogs/post/726558 How To Trade You can close your open trades as soon as you receive a signal Close your Buy orders if you receive an Exit Buy Signal. Close your Sell orde
SmartTrendMt5
Andrey Spiridonov
The SmartTrendMt5 trend indicator generates signals based on the principle of combined analysis of calculated reference points within the Keltner channel. The indicator plots the Keltner channel in a separate window (by default, red lines and a blue line - the middle of the channel), and also draws the histogram of calculated reference points for each candle (by default, the histogram bars are yellow). The should be attached to a chart of any timeframe and any trading symbol in the usual way.
Your Trend Friend
Luigi Nunes Labigalini
5 (1)
The trend is your friend! Look at the color of the indicator and trade on that direction. It does not  repaint. After each candle is closed, that's the color of the trend. You can focus on shorter faster trends or major trends, just test what's most suitable for the symbol and timeframe you trade. Simply change the "Length" parameter and the indicator will automatically adapt. You can also change the color, thickness and style of the lines. Download and give it a try! There are big movements
该产品的买家也购买
VTrende Pro
Andrii Diachenko
5 (1)
VTrende Pro - MTF indicator for trend trading with a display panel for MT5 *** Videos can be translated into any language using subtitles (video language - Russian) Although the signals of the VTrende Pro indicator can be used as signals of a full-fledged trading system, it is recommended to use them in conjunction with the Bill Williams TS. VTrende Pro is an extended version of the VTrende indicator. Difference between Pro version and VTrende: - Time zones - Signal V - signal 1-2 waves
IVISTscalp5
Vadym Zhukovskyi
5 (5)
我们向您介绍iVISTscalp5指标,它不仅独特,而且在交易操作中也非常有效。该指标基于时间数据,是多年金融市场经验和深入分析的结果。iVISTscalp5指标是手动交易的优秀工具。便利性、简单性和可视化 - 所有的复杂性都隐藏在内部。我们将iVISTscalp5指标的设置和使用简化到了最大程度。该指标适用于MT5终端中您所拥有的所有金融工具。 操作时间为UTC+3的早上4点到晚上8点。 iVISTscalp5指标菜单(见截图1): History - 计算行情的周数 dT_min - 选择时间间隔的时间(分钟) TFline - 绘制水平成交量(时间帧) BARSline - 绘制水平成交量(条数) TFtrend1 - 绘制日线通道(时间帧) BARStrend1 - 绘制日线通道(条数) TFtrend2 - 绘制周线通道(时间帧) BARStrend2 - 绘制周线通道(条数) ALERT_TIMER - 设置闹钟 ALERT - 开启/关闭闹钟 Save - 开启/关闭将时间记录到文本文件。 图表上的红色和蓝色旗帜表示时间(VIST智能剃须系统的信号)。卖出信号为红旗,买入
Ershov 38 parrots MT5
Aleksei Ershov
5 (1)
The indicator is designed to close positions on the market in time. For example: to take profits ahead of schedule if the price has not reached TakeProfit, and the market is turning around. The indicator analyzes the momentum, not the trend. He does not give any information about the trend. The indicator is well suited for finding divergence. The Ershov 38 Parrots indicator dynamically adjusts to the market and detects price movement impulses of medium and high amplitude. It almost does not rea
Fibonacci Suavizado
Cesar Juan Flores Navarro
Indicador en MQL5, que obtiene el promedio de 10 EMAS, que son alineadas según Fibonacci, obteniendo un promedio, que sera suavizado.  Se puede ingresar un numero desde 2 a N, que multiplica a los EMA-Fibonacci. Funciona en cualquier criptomoneda, etc. etc... pudiendo calcular el futuro segun la tendencia de las EMAS. Funciona excelentemente en tramos largos, determinando exactamente el mejor inicio/salida. El precio inicial por apertura sera por un periodo de tiempo, luego aumentará.
EQ Cutrim Theory
Marco Aurelio Santos Costa
Ronal Cutrim has been a dedicated mathematician for 14 years and has more than 10 years of experience in the financial market. The concept of the theory is simple, find imbalance between buyers and sellers. Which makes a lot of sense, because nothing goes up forever, nothing falls forever.   When you find an asset with a mathematical probability of unbalanced equilibrium, it is a great way to get into trading:  TUTORIAL: Turn on the subtitles, the video is subtitled
Классификатор силы тренда. Показания на истории не меняет. Изменяется классификация только незакрытого бара. По идее подобен полной системе ASCTrend, сигнальный модуль которой, точнее его аппроксимация в несколько "урезанном" виде, есть в свободном доступе, а также в терминале как сигнальный индикатор SilverTrend . Точной копией системы ASCTrend не является. Работает на всех инструментах и всех временных диапазонах. Индикатор использует несколько некоррелируемых между собой алгоритмов для класси
Pendiente de Precio
Cesar Juan Flores Navarro
Indicador en base a la pendiente de la linea de precio, dibuja una línea de color cuando sube a base de los precios que previamente has sido procesados o linealizados, y cuando baja la pendiente la linea linealizada toma otro color. En este caso se a considerado 6 lineas de diferentes procesos desde pendientes largas hacia las cortas, observándose que cuando coincidan las pendientes se produce un máximo o mínimo, lo que a simple vista nos permitirá hacer una COMPRA O VENTA.
Индикатор Coefficient Of Determination (COD) представляет собой значение коэффициента детерминации или квадрат коэффициента корреляции между зависимой переменной — ценой и объясняющей переменной — тиковым объемом. Что это дает нам на практике? COD отлично распознает кульминацию трендовых движений, что позволяет подбирать оптимальные точки и ловить развороты рынка. Как использовать индикатор: Наиболее популярная торговая стратегия строится совместно с трендовым индикатором Moving Average (MA), пе
Fibonacci Multiple 12
Cesar Juan Flores Navarro
Fibonacci Múltiple 12, utiliza la serie fibonacci plasmado en el indicador fibonacci, aumentadolo 12 veces según su secuencia. El indicador fibonacci normalmente muestra una vez, el presente indicador se mostrara 12 veces empezando el numero que le indique siguiendo la secuencia. Se puede utilizar para ver la tendencia en periodos cortos y largos, de minutos a meses, solo aumentado el numero MULTIPLICA.
Recommended TimeFrame >= H1. 100% Non Repainted at any moment.  Use it carefully, only with Trend Direction. Trading Usage: 2 Variants: as Range System or as BreakOut System (Both Only With Trend Direction)::: (Always use StopLoss for minimise Risk); [1] as Range System: (Recommended) in UP TREND:  - BUY in Blue Line , then if price goes down by 50 points (on H1) open Second BUY.   Close in any Profit you wish: TrailingStop(45 points) or Close when Price touches upper Gold Line. in DOWN TR
Linea Horizontal Inteligente
Cesar Juan Flores Navarro
En base a cálculos matemáticos de determino una linea Horizontal que cruza a todas las señales de trading, mostrando los máximos y mínimos. La linea horizontal parte en dos las subidas y bajadas de las señales de trading, de tan manera que es fácil identificar los máximos y mínimos, y es inteligente por que es sensible a las subidas y bajadas, afín de no quedarse en un solo lado por siempre, trabaja excelentemente con otros indicadores suavizadores ya que les garantiza que en un intervalo de tie
Spike Detector
Tete Adate Adjete
this indicator is a Spike detector indicator, it is specially designed to trade Boom 1000, Boom 500, Crash 1000 and Crash 500 We recommend using it on Deriv Boom and Crash indices only Its setting is intuitive, familiar, easy to use it has notification functions; audible notifications and push notifications. this tool is simple to use, easy to handle This update is based on different strategies for spikes
AutoSignals Trend Panel
Danilo Maia Siqueira
指標基於每個圖表時間的6個信號,跟踪同一資產的5個不同圖表時間的趨勢。 該指標的主要目的是向我們展示放置該金融資產的多數趨勢。 系統在數個圖形時間中傳輸趨勢信息,這樣用戶可以廣泛查看資產的移動,這種工具通過幫助操作員執行訂單使用戶具有較高的命中率 支持趨勢。 指标基于每个图表时间的6个信号,跟踪同一资产的5个不同图表时间的趋势。 该指标的主要目的是向我们展示放置该金融资产的多数趋势。 系统在数个图形时间中传输趋势信息,这样用户可以广泛查看资产的移动,这种工具通过帮助操作员执行订单使用户具有较高的命中率 支持趋势。 Zhǐbiāo jīyú měi gè túbiǎo shíjiān de 6 gè xìnhào, gēnzōng tóngyī zīchǎn de 5 gè bùtóng túbiǎo shíjiān de qūshì.
Panel Visao axetrend
Danilo Maia Siqueira
trend view panel; AutoSignals Trend The indicator tracks the trend in 5 different chart times for the same asset, based on 6 signals for each chart time. The main objective of the indicator is to show us the majority trend of the financial asset in which it was placed. The system transmits the information of the trends in different graphic times, in this way the user is able to have a wide view of the movement of the asset, this type of tool makes the user have a higher hit rate by
Escalera Inteligente
Cesar Juan Flores Navarro
Indicador en MQL5, recibe la información del precio SUAVIZADO, lo procesa anulando los picos inteligentemente, y el resultado lo envía al desarrollo de la escalera que iniciara y subirá o bajara según el peldaño o INTERVALO ingresado Ingreso PERIODO = 50 (variar segun uso) Ingreso MULTIPLICA AL PERIODO = 1 (variar segun uso) Segun la configuración la escalera puede pegarse o separarse de los precios,, Se aplica toda la linea de tiempo, y a todas las divisas, etc.  
Seconds Charts
Aleksandr Goryachev
Micro  ******************* Секундные графики MT5 ********************** Более точного инструмента для входа в сделку вы не найдёте. Входные параметры: Timeframe, sek - период построения графика, секунды Displayed bars - отображаемые бары Step of price levels, pp, 0-off - шаг отрисовки ценовых уровней, пункты Scale points per bar, 0-off - масштаб в пунктах на бар Show lines - отображение текущих уровней Show comment - отображение комментария Standard color scheme - стандартная цветовая сх
QuantXSTocks Trading Range Indicator for MT5: INSTRUCTIONS TO USE OUR INDICATOR:- User needs to take trade on Arrow or after an Arrow CandleStick, You can achieve up-to 35-125 pips target by this Indicator. Best Timeframes for Stocks and Indices are M30 and H1: AMAZON M30 (50 pips) TESLA M30 (50 pips) APPLE M30 (50 pips) ADOBE M30 (50 pips) NASDAQ100 H1 (125 pips) The above are the approximate amount of pips you can achieve by this Indicator, Green arrow appears to be buy arrow while the Red a
Super Suavizador
Cesar Juan Flores Navarro
Indicador en MQL5 que obtiene el promedio de 10 EMAS que son alineadas y procesadas según Fibonacci luego el promedio es suavizado"  Se ingresa un número de 2 a N que multiplica los EMA-Fibonacci y por consiguiente aumenta los fibonacci, resultando un promedio.   Se ingresa un número que suaviza los EMA-Fibonacci. Considerando los números 1/1 seria la suavización minima. Considerando los números 3/5 seria la suavización media. Considerando los números 10/30 seria la suavización alta.....etc
Trend and Signals MT5  indicator scans  30 trading Instruments (Forex, Metals and Indices).     It uses special algorithm on the  current market   based on   Pure Price Action   and display the overall trend and signal on the dashboard. When signals are produced the indicator sends alert and notification. Strategy for Signals This indicator uses the daily timeframe to determine the direction of the trend. The hourly timeframe is used to identify possible entries. Main trend and is determined by
BC Scalper Aroow
Tete Adate Adjete
This indicator is based on the crossing of two Moving Average with the RSI It is intended for scalpers Specially designed for Boom and Crash syhtetic indices from Binary.com/Deriv.com It is easy to use and intuitive. We recommend its use on M1 and is equipped with three types of notification Email alert Sound notification Push notification these parameters can be activated and deactivated.
该指标提供了一种基于'回归通道工具'概念的强大市场分析方法。通过利用此工具,交易员可以在图表上对回归通道获得出色的控制,从而使他们能够做出更明智的交易决策。 '回归通道工具'是交易员工具箱中的一个强大工具。它旨在为价格趋势和潜在支撑和阻力水平提供有价值的见解。该工具特别适用于在趋势内部可视化修正波动,提供了对价格动态的综合视图。 以下是更详细地了解使用此指标的关键功能和优势: 通道水平和支撑/阻力:   该指标的主要优势之一是其能够生成作为动态支撑和阻力区域的通道水平。这些水平在确定潜在的入场和出场点方面至关重要,增强了交易策略的精确性。 修正波动水平:   通过启用修正波动水平,交易员可以在更大的趋势内识别潜在的修正。这个功能有助于识别回撤,并帮助交易员利用有利的价格波动。 直接控制:   该指标的控制面板允许无缝地操纵回归通道。交易员可以微调填充和射线选项等设置,提供符合其分析风格的通道定制视图。 更高时间框架分析:   为了获得更广泛的视角,该指标具有从更高时间框架加载数据的功能。这个功能可以帮助交易员评估不同时间尺度上的趋势和通道,促进对市场动态的更全面了解。 如何使用: 设置
Use with JUMP 25. However it can can with the volatility indices as well because it is a modified version. It is advisable to use create a healthy account management. Measure your risk and happy trading. Other experts to be loaded soon. These are modified in order to optimise profits. Ideal candidates are high risk, high returns individuals who hold trades at a maximum of 1 - 2 hours
This indicator is a scalping indicator intended solely for the Boom and Crash indices of the Deriv Limited market It supports Boom 500, Boom 1000, Crash 500 and Crash 1000 Not repaint and no bug The settings are intuitive and easy to use The product activation number is 20 The Time Frame used depends on the user If you are an aggressive scalper then just use M1 For long trades use M15 If you are conservative use M5 Please contact me for more details of its use
RadioMedia
Cesar Juan Flores Navarro
Indicador de MQL5 basado en 3 EMAs, en función del precio. El precio influye en las EMAs, de tal forma que los Máximos y Mínimos solo la alteran minimamente, este influjo lo llame radio. Considerando la influencia del radio como constante, por lo que no tiene valores de entrada. Ideal para todas las criptomonedas. Funciona en todos los tiempos. Se sugiere operar cuando el precio este abajo y en bajada.... o cuando el precio este encima y en subida.
Super Suavizador Inteligente
Cesar Juan Flores Navarro
El Super Suavizador Inteligente es la culminación de la evolución de los suavizadores en funcion del precio, funciona en todos los pares de divisas, es fácil de usar, y puedes usarlo varias veces en un mismo par, afin de darte una idea de hacia donde va el precio, muy util para ver la tendencia a largo plazo. El SSI trata siempre de formar ondas de subidas y bajadas a fin de poder mostrar el máximo y/o mínimo de la tendencia del precio.
Aliens dougkang de moviles
Cesar Juan Flores Navarro
Tomamos 5 medios móviles las unimos en una la cual suavizamos y volvemos a suavizar, resultando un mega suavizador de medios móviles suavizadas. Indicador de mql5 funciona en cualquier broker y para todos los tiempos, siendo el mas optimo el de 5, 15 a mas. Funciona mejor en grupo consigo misma osea poner uno de 14 y otro de 50 y 400,, así se observa mejor su desempeño.
AIS MT5 INDICATOR 5 ALL INCLLUSIVE SET GUIDE CHAPTER 1  IMPORTANT INFORMATION <1> THIS INDICATOR IS ONE OF THE SERIES OF NEW AIS INDICATORS AIS MT5 INDICATOR 1 =ADVANCED CLASSIC= AIS MT5 INDICATOR 2 =MULTIFRAMES= AIS MT5 INDICATOR 3 =LINES= AIS MT5 INDICATOR 4 =MARKET PROFILES= AIS MT5 INDICATOR 5 =ALL INCLUSIVE SET CHAPTER 2 GENERAL FEATURES OF THE SERIES <1> AIS MT5 INDICATOR 1 =ADVANCED CLASSIC= < DEVELOPMENT PAUSED >     DISPLAYS MAIN TIME POINTS AND PRICE LEVELS OF THE CHART     
ForexAndCryptoTradeTool
Gabriel Ferreira Da Silva
Quantitative analysis software, this indicator came from another country and thanks to my network today I can share this software with you! Russian Tool plots arrows on your asset, indicating the trend the asset will enter, easy to use and easy to install indicator We have been working with robots and indicators since 2018! We came to MQL5 to be able to bring better benefits at the time of payment by our customers!, our Instagram where we post daily stories of operations: https://www.inst
十二個人工神經網絡分為四個集成 試圖預測未來價格走勢的方向: 小:1分鐘, 中:5分鐘, 大:30分鐘, 皇家:15分鐘。 該活躍高頻交易指標已準備好使用 一個單獨啟動的 EA,並以指標發布的全局變量的形式從指標接收信號。 該指標在策略測試器中不起作用,因此請觀看視頻或, 向我的郵件發送請求,要求為您提供限制為一周的試用演示版。 tgwls2@gmail.com 此程序為 64 位版本,同時請確保您的計算機 支持 OpenCL 加速器 2.0 或更高版本,並且 至少 8 GB 的 RAM 和現代處理器。 預測在主圖表窗口中顯示為箭頭。 一小段時間——一個小箭頭,一個大箭頭——一個大箭頭。 因為皇家合奏有自己的箭頭。 可以更改箭頭相對於當前欄的顏色和偏移量 就在主窗口中,以及其他設置:選擇星期幾 為使指標起作用,主圖表總偏移的百分比和 用於神經網絡安全和緊急停止的按鈕。 在安全停止時,指標等待訓練時期結束 所有神經網絡,保存權重並停止指標。 建議緊急安裝以保證拆除 屏幕上的所有圖形對象。 否則,每五個訓練時期都會自動保存權重。 分別為每個神經網絡。 建議對神經網絡權重文件進行備份,
Recuroid
Andriy Sydoruk
The Recuroid indicator shows very good entry points. Just look at the screenshots, then download the free version and look in the strategy tester and see for yourself. The system is based on two key algorithms. The first algorithm (managed) creates a system of balanced transition from the buy zone to the sell zone and vice versa, draws arrows and lines, and forms entries. The second algorithm (managing) corrects the initial data for the first algorithm (managed) by measuring virtual windows,
筛选:
无评论
回复评论
版本 2.20 2023.07.01
We made some major changes with the positions of the arrows so it is at least 2 pips away from the entry candle. We also made sure signals are generated immediately after the signal candle closes so, you can enter at the earliest available price. You can also stall our new indicator Beautiful Money Flow as an easy visual replacement of the traditional Money Flow Index indicator. Please enjoy and leave a feedback.