Forex Currency Power Index FCPI Indicator for MT5
- 指标
- Roberto Jacobs
- 版本: 3.0
- 更新: 26 六月 2023
- 激活: 5
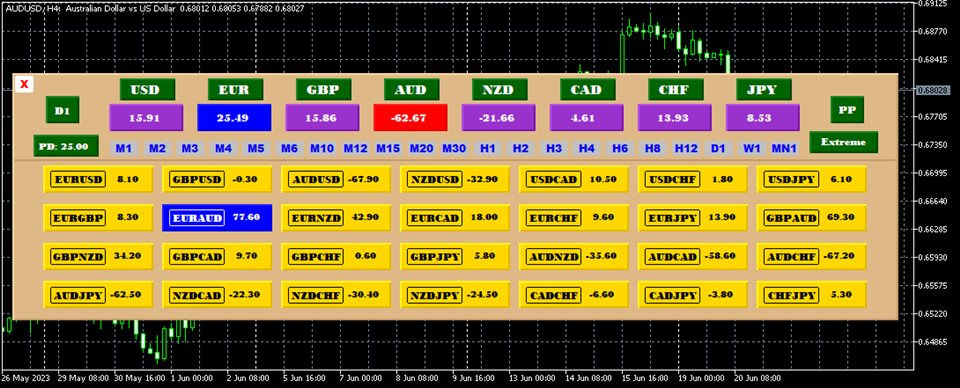
The FCPI indicator or Forex Currency Power Index indicator is a multi currency pairs indicator that displays 28 pairs on 1 chart, which consists of 8 Major Pairs and 20 Cross pairs.
8 Major Pairs dan 20 Cross pairs:
EURUSD,GBPUSD,AUDUSD,NZDUSD,USDCAD,USDCHF,USDJPY,EURGBP,EURAUD,EURNZD,EURCAD,EURCHF,EURJPY,GBPAUD,
GBPNZD,GBPCAD,GBPCHF,GBPJPY,AUDNZD,AUDCAD,AUDCHF,AUDJPY,NZDCAD,NZDCHF,NZDJPY,CADCHF,CADJPY,CHFJPY.
Automatically detects symbols that have a symbol prefix and/or a symbol suffix.
The FCPI indicator provides a unique calculation to scan the forex market and identify the strongest extreme currency strength against the weakest extreme currency strength.
To scan the forex market and identify the strength of a currency the FCPI indicator provides 2 options for calculation formulas.
First choice: Price Power, and Second choice: ADX Power. Options can be selected by drop down menu.
The default selection for the calculation formula is Price Power.
Meanwhile, to identify extreme currency strengths, the FCPI indicator also provides 2 extreme calculation options mode.
First choice: Extreme, and Second choice: Side Extreme. Options can be selected by drop down menu.
The default selection for Extreme calculation mode is Extreme.
Options for calculation formulas and options for identifying currency extreme strengths are calculated based on Timeframes.
And the Timeframe for calculations can be selected by simply clicking on the Timeframe period on the indicator panel for MT5 starting from M1 to MN1 Timeframes (21 Timeframes).
The FCPI indicator by default distinguishes the extrememum currency strength by 2 colors:
The color for the strongest extremum currency strength is blue. (color can be selected by drop down menu)
Meanwhile, the color for the strength of the weakest extremum currency is red. (color can be selected by drop down menu)
Accuracy in calculating and identifying the strength of the strongest extreme currency against the strength of the weakest extreme currency is 100 percent depending on the speed of price movement that changes, especially on the Low Timeframes M1-H1.
The FCPI indicator provides the results of calculations and identification of the strength of the strongest extreme currency against the strength of the weakest extreme currency in the pair concerned among the 28 pairs, where the color is blue for the strongest pairs and red for the weakest pairs. In other words, the blue color is for the BUY signal and the red color is for the SELL signal in the pair name in question.
To immediately see the calculation results and identify extrememum currency strength, you only need to click on the name of the red or blue pair, then the chart symbol and timeframe will immediately change according to the name of the pair clicked.
FCPI indicators can be used for manual trading, both scalping and day trading.
Recommendations for use from me as an author are very good for use on High Timeframes, on H2 to MN1 Timeframes.


Very handy assistant! the developer quickly solved the problem with suffixes in pairs on specific brokers