Trend Sensor MT5
- 指标
- Yuriy Lyachshenko
- 版本: 1.30
- 更新: 20 十一月 2023
- 激活: 5
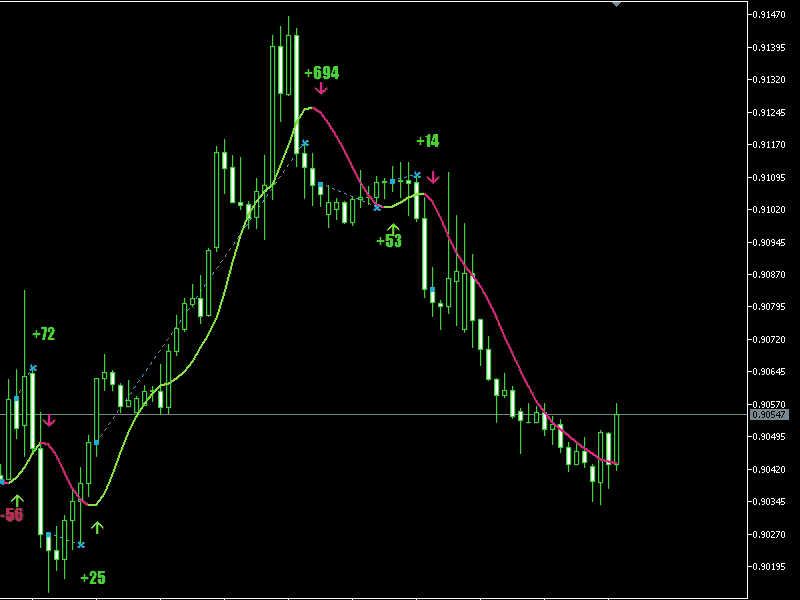
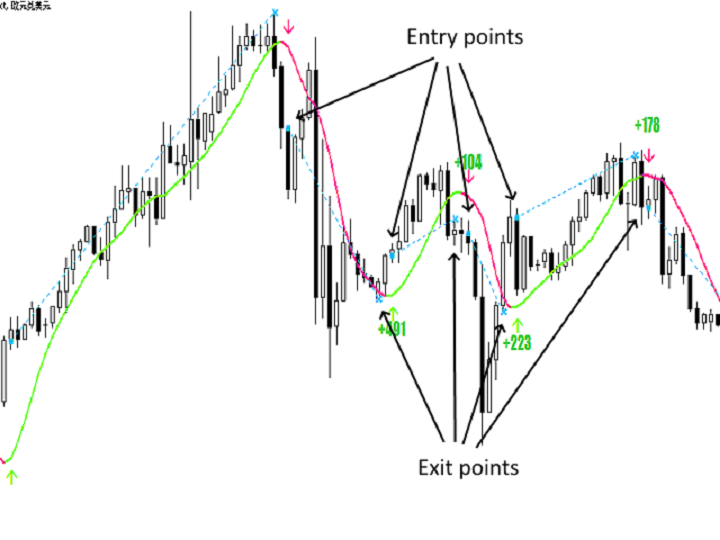
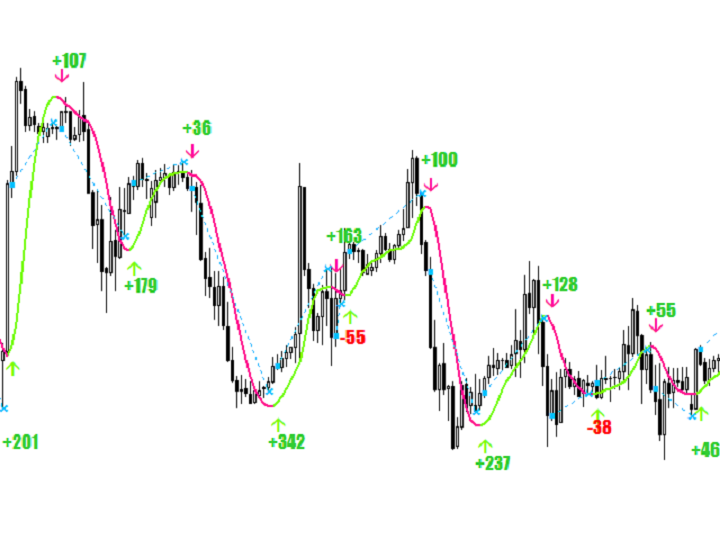
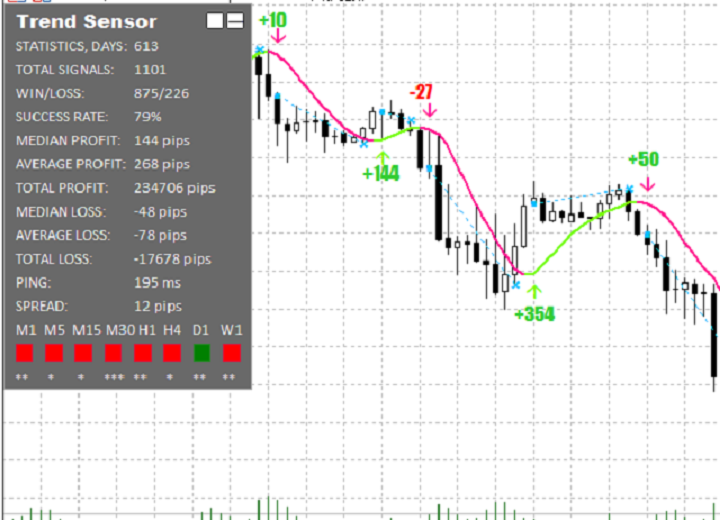
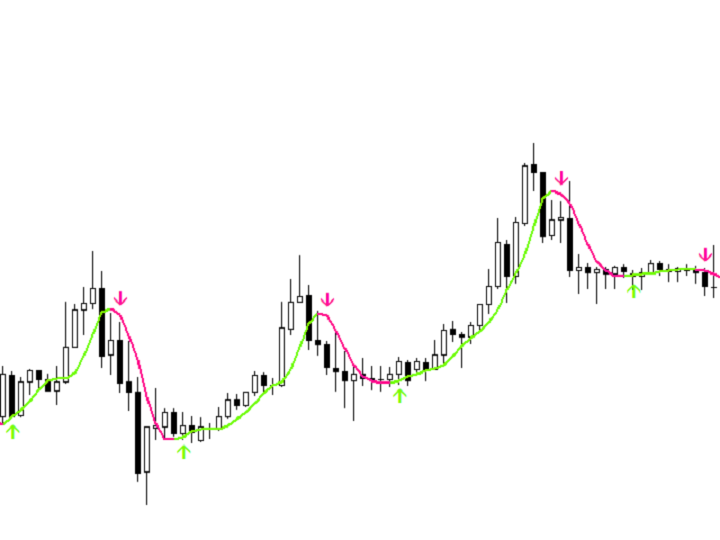
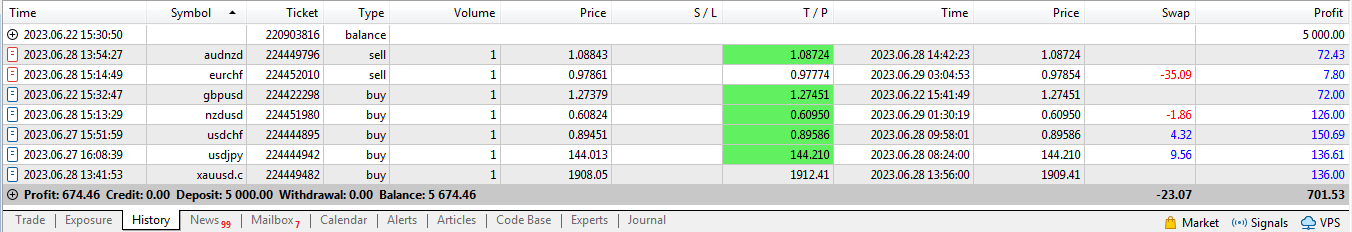
该指标显示最合适的进入和退出点。它还显示所有信号的统计数据,以便更好地分析交易。
在这个指标的帮助下,你将能够更好地了解市场。
一旦趋势的力量开始减弱(这将显示在面板上),趋势线将引向水平位置 - 这是退出交易的信号。或者你可以在达到平均/中值利润水平时退出。
该指标是我自2010年以来的交易经验的结晶。
特点
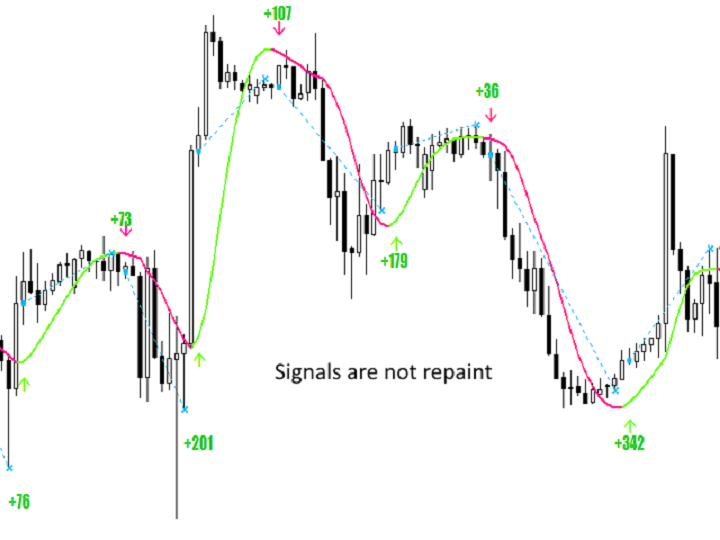
- 这个指标不会重新绘制。印在历史图表上的东西也将被实时打印出来。
- 它可以用于交易任何资产:加密货币、股票、金属、指数、商品和货币。
- 在所有的时间框架上都可以工作。
- 进入的信号出现在新蜡烛的开端。
- 退出交易的信号是暂定的,因为通常你可以用更大的利润关闭交易。
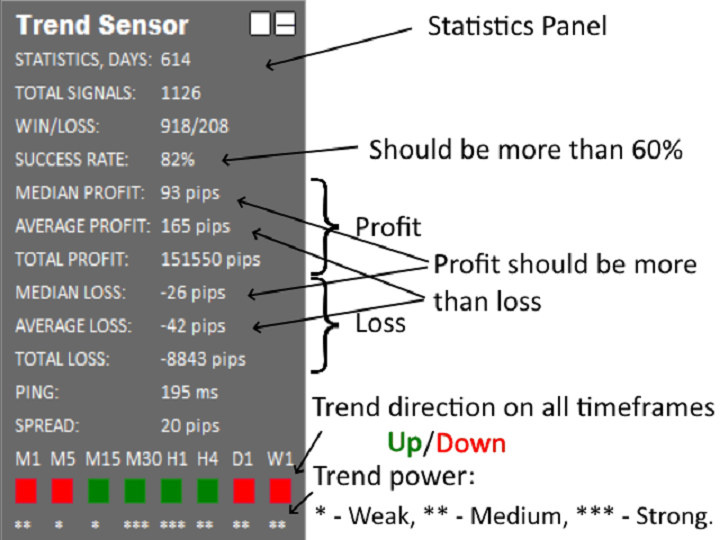
- 在左上方有一个详细的交易统计面板,它可以被最小化。
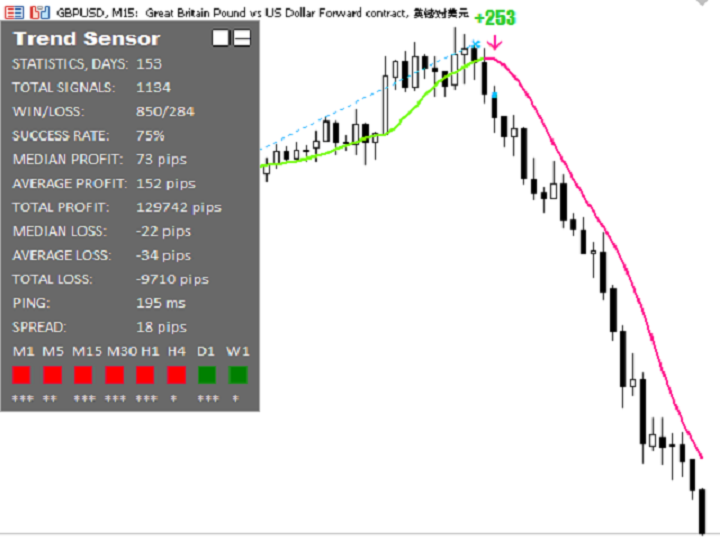
- 在M1到W1的时间框架上,一次显示趋势的方向和它的力量。
- 有一个轻量级的代码,所以它不需要加载,也不会降低终端的速度。
- 使用一个特殊的公式计算移动平均线,它决定了趋势的方向。
- 为了不错过交易的信号,你可以在警报窗口和推送中收到通知。
- 适用于所有级别的用户,从初学者到专家。
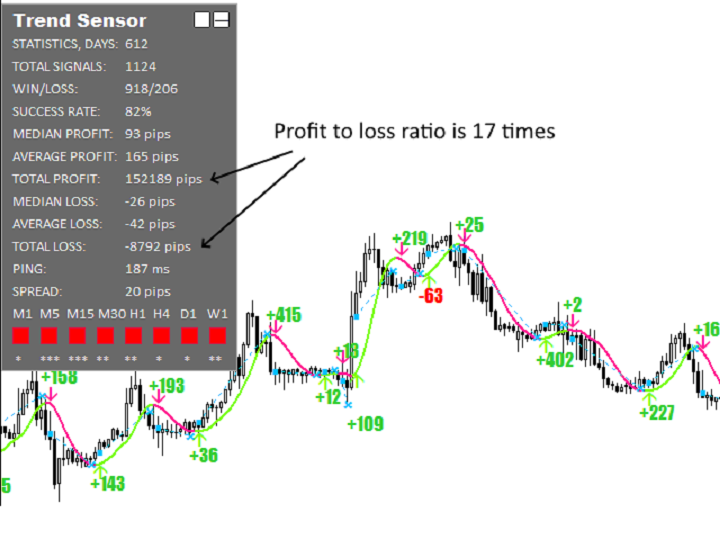
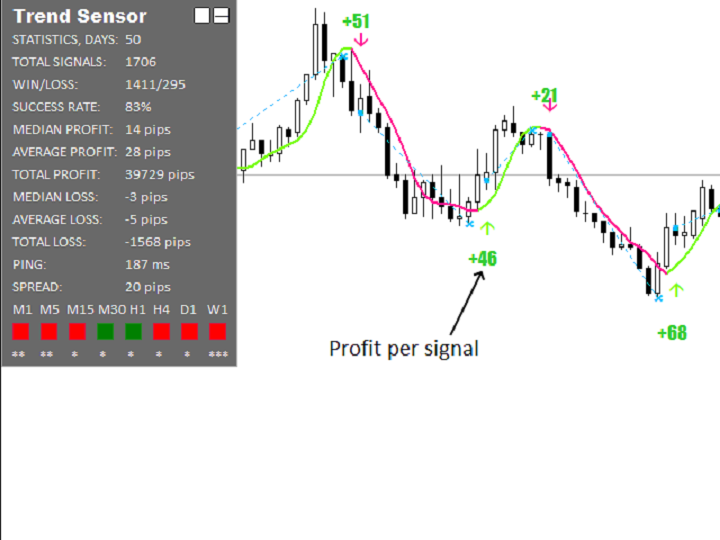
统计小组
- 取自信号历史的天数。
- 提供统计的信号总数。
- 盈利和亏损信号数量的比率。
- 赢利信号总量的百分比。
- 每个信号的利润中位数。
- 每个信号的平均利润。
- 所有信号的总利润。
- 每个信号的损失中位数。
- 每个信号的平均损失。
- 所有信号的总损失。
- 最后一次ping到经纪人的服务器。
- 当前点差。
- 在M1到W1的时间段内,趋势的方向是向上/向下。
- 衡量趋势的力量: *弱 **中 ***强。
参数
| Trading style | 攻击性 中等 安全 (指标灵敏度,越灵敏越有信号) |
| Working hours | 指示器工作时间,在该时间段出现入市信号的间隔 (时间格式应该是 xx:xx-xx:xx,例如 00:00-23:59) |
| Show statistics | 开/关 在图表的左上角显示信号的统计面板 |
| Show line | 开/关 闭显示趋势线 |
| Show arrows | 开/关 趋势变化时显示箭头 |
| Show entry/exit | 开/关 显示市场的进入和退出点 |
| Use alert notification | 开/关 弹出式窗口的通知和声音通知 |
| Use push notification | 开/关 推送通知 |